

MMassel/iStock Unreleased via Getty Images
Introduction
My previous Seeking Alpha note on J Sainsbury (OTCQX:JSAIY) published in early July 2022 rated the UK’s second largest supermarket group a BUY (based on the stock’s London Stock Exchange price of around £2.07). In early October 2022 the share price dipped to around £1.70, at which point a great deal of negativity regarding the outlook for the UK economy was being priced in. The stock has bounced nicely off the October lows and currently trades at around £2.20. This note highlights interesting aspects of the 1H23 profit announcement and provides an updated fundamental valuation assessment of J Sainsbury. Note that the commentary below uses SBRY to refer to the group (this is the stock code for J Sainsbury PLC’s listing on the London Stock Exchange).
Sales Trends – COVID-19 Still Muddying the Waters
Year-on-year retail sales growth performance was rather weak, but it is important to remember that 1H22 was influenced positively by COVID-19, with UK supermarkets benefitting from stronger than normal demand in 1Q22 prior to the broader opening up and return to post-lockdown normality in 2Q22. The sales performance data for the 2Q comparatives provides a better guide regarding the health of the business; 2Q23/2Q22 growth of 3.8% in grocery is a solid enough result, although the contribution of inflation must be kept in mind.
Chart 1:
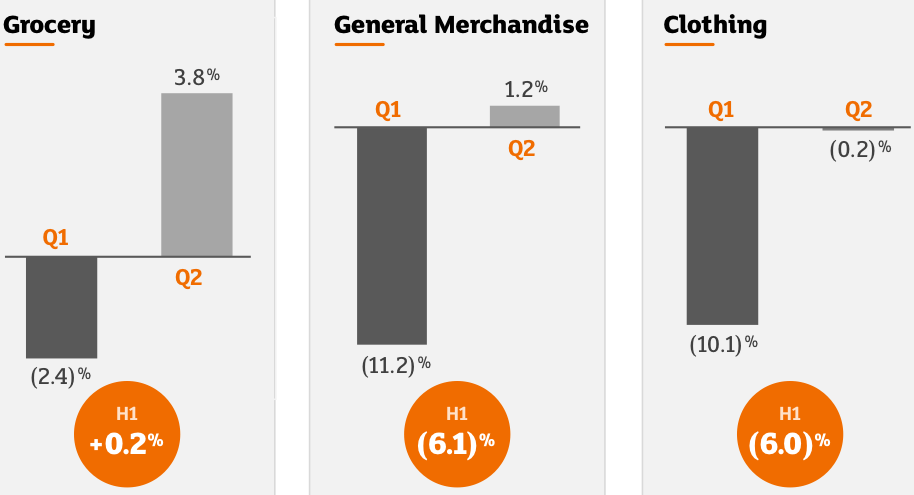
Source: SBRY 1H23 Presentation, slide 10.
At current levels of ~£2.20 (London Stock Exchange), SBRY shares are trading roughly in line with where they were three years ago. The lack of share price growth is somewhat inconsistent with the growth in sales over the last three years; grocery sales were 9.3% higher in 1H23 than 1H20 (which was a pre-COVID-19 period), and total retail sales were up 5.9% over the same period (note that this excludes fuel). 1H23 underlying profit before tax was up 8.5% versus 1H20.
Outperforming Major UK Peers
My previous Seeking Alpha research on SBRY discussed the ‘Save to Invest’ strategy, which involves SBRY using targeted cost reductions to fund lower product prices. A major motivation behind the strategy was to defend against the growth of discounters Aldi and Lidl. The charts below show how lower product pricing has allowed SBRY to keep product price inflation at sub-market levels, with this investment in the customer proposition translating to a slight gain in volume market share over the last three years (during a period in which major peers lost ground). The quality of SBRY’s operating performance can also be seen in the group’s leading customer satisfaction rating.
Chart 2:
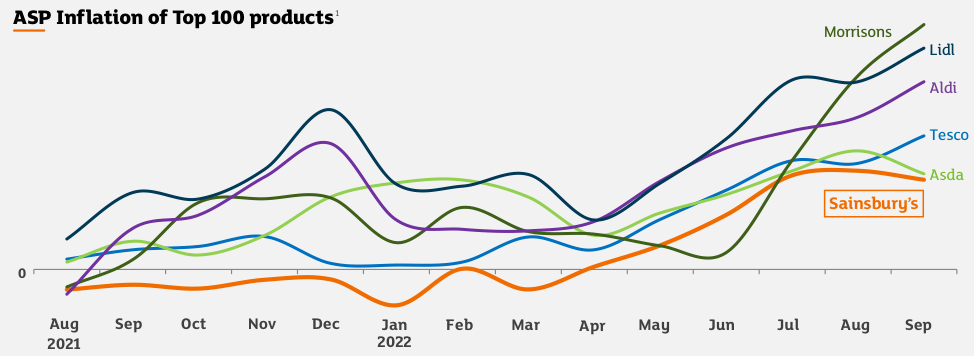
Source: SBRY 1H23 Presentation, slide 22.
Chart 3:

Source: SBRY 1H23 Presentation, slide 7. (Supermarket CSAT – competitor benchmarking, 12 weeks to 17 September 2022.)
SBRY has traditionally been thought of as a slightly more ‘premium’ supermarket than its major peers (although offering much better customer value than genuine premium offerings such as Waitrose and Marks & Spencer). The Save to Invest strategy serves to address the downside risk of having a premium pricing customer offer in what is a highly competitive market, however it must be executed carefully in order to protect SBRY’s brand strength and reputation for quality. Relative to major peers, I would say that SBRY’s customer base is skewed to a slightly higher income/wealth socio-demographic; it can therefore be argued that SBRY’s customers may, on average, be feeling less stress from cost-of-living pressures. Chart 4 below supports this argument – it shows that:
- SBRY has experienced less customer switching to discounters Aldi/Lidl.
- SBRY customers are reducing basket size, but to a smaller extent than has been observed at other supermarkets.
- SBRY customers are trading down (switching to own-brands or budget offerings), but to a lesser degree than seen at every major competitor other than Morrisons.
Chart 4:
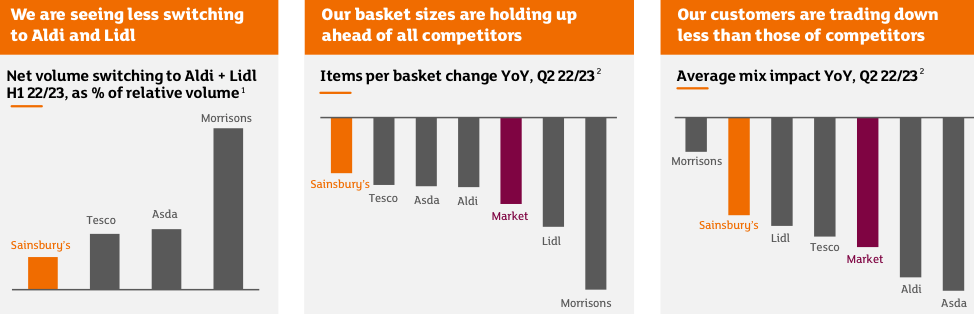
Source: SBRY 1H23 Presentation, slide 29.
General Merchandise – Near-Term Downside Risk
SBRY has a material exposure to general merchandise. With ~20% to ~25% of SBRY group retail sales relating to general merchandise, this represents an area of potential weakness during an economic downturn as customers cut back on discretionary purchases. If there is a positive angle, it is that Argos is perceived to offer good value and so has the potential to gain market share within the general merchandise segment during a period when customers are spending carefully. The group may also be able to offset some of the P&L pressure from lower general merchandise sales with a continued focus on expenses. SBRY has made major changes to the Argos distribution network, including investment in new fulfilment centres. The strategy to close stand-alone Argos stores and move them into supermarkets co-locations appears to have been well executed upon; as at 1H23 SBRY had 414 Argos stores inside Sainsbury’s supermarkets. Through driving down operating costs, management says that profitability levels for Argos have shifted above pre-COVID-19 metrics.
Challenging Conditions for UK Retail
Whilst SBRY’s operating performance is solid, particularly when measured against major supermarket peers, it is important to be realistic about the challenges facing the UK economy and what that implies for supermarkets and the retail sector more broadly. As CEO Simon Roberts noted in the 1H23 Q&A session, grocery volumes at an industry level are going backwards as consumers tighten their belts and react to price inflation. In addition to shrinking basket sizes, customers are also trading down and shifting spend to own-brand products and basic staples. SBRY has already hedged 75% of expected FY24 utilities costs – this downside protection is helpful, but energy costs will obviously put pressure on the group’s operating margin. In regard to near-term risks, the Christmas trading period is always vitally important for the retail sector and it is far from clear how Christmas 2022 is going to play out in terms of consumer demand levels. On that topic, UK retailers may actually be quite happy about the Royal Mail strikes in the lead up to Christmas. Customers who might otherwise have shopped for gifts online could play it safe and shop in-store rather than risk delivery delays; this could prove quite beneficial for Argos.
COVID-19 Consumer Behaviors Fading
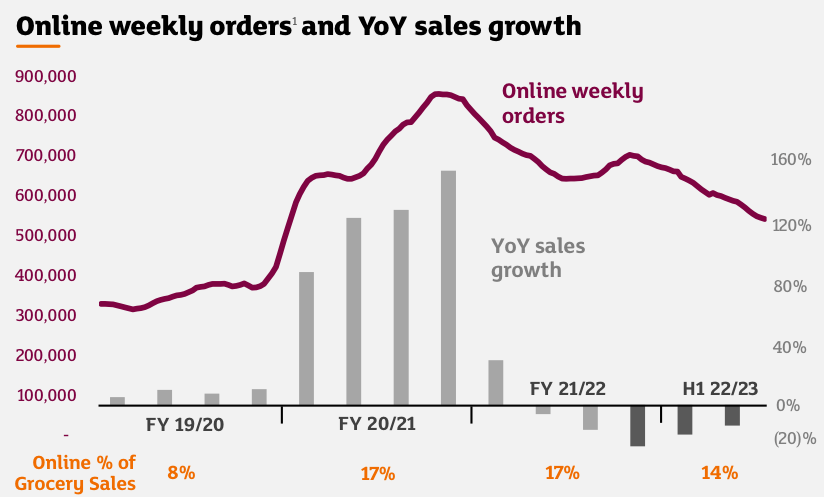
Many commentators confidently stated that changes in consumer behavior triggered by COVID-19 were permanent. The idea was that COVID-19 had just brought forward inevitable behavioral shifts, and that once these changes were made, they would stick. The spike in online grocery shopping was one obvious example. Personally, I never bought in to this narrative. My assumption was always that a good chunk of COVID-19 behaviors would eventually reverse (consumer spending tilt to online, WFH dynamics, raging demand for rural properties and campervans/motorhomes, a sudden spike in dog ownership etc., etc.).
The chart from SBRY below shows that online order volumes are continuing to normalize and will likely end up back in line with the trend profile that existed prior to COVID-19. Part of the boost in online orders is due to SBRY (and other supermarkets) massively increasing the number of available delivery slots during the pandemic (online order demand is in part driven by online order slot availability). Whilst it is true that the profitability of online is probably better today than pre-COVID-19, SBRY’s profitability is still better served by in-store shopping than online shopping. I therefore see the trend back to in-store shopping as a positive for the UK supermarket sector.
Chart 5:
Source: SBRY 1H23 Presentation, slide 26.
Solid Balance Sheet Provides Flexibility
In FY22, SBRY exercised an option to buy 21 stores that were previously leased from two investment vehicles called Highbury and Dragon. The initial plan was to retain ownership of some of these stores and to execute sale and leaseback on around 18 others. However, market conditions subsequently changed in the commercial property sector, which meant that the expected financial benefits of the sale and leaseback strategy could not be captured. Without a strong balance sheet, SBRY would have had little option but to continue with the sale and leaseback plan – in effect SBRY would have been a forced seller in a buyer’s market. However, the group’s solid balance sheet provided the flexibility to fund the Highbury and Dragon transactions via a combination of cash and debt.
I like to see management taking long-term views and carefully considering value when making strategic decisions. It is easier to focus on long-term outcomes and value when a strong balance sheet provides the capacity to manage through unanticipated events, as SBRY has demonstrated.
In regard to net debt, it should be noted that there is typically quite a lot of seasonality in SBRY’s reported cash balances due to movements in working capital. The boost to cash in 1H23 from a reduction in working capital requirements can be expected to move in the opposite direction in 2H23. Note that I make an adjustment in my valuation for the seasonality of balance sheet cash holdings (rather than simply taking the stated net debt position at each balance date).
Valuation Analysis – Normalized Earnings Approach
To construct a 1-year forward normalized EBIT for SBRY, I have made a number of assumptions, adjustments and allowances, including:
- Adjust for lease accounting expenses that are reported through the finance costs line.
- Remove EBIT relating to Financial Services (as I value this division separately, applying a multiple of reported book value).
- Assume Retail sales 5% below the last-twelve-months to 1H23 sales.
- Assume a Retail profit margin of 3.0% (adjusted down relative to my previous valuation settings in order to capture the margin-squeeze impact of inflationary pressures).
- Allowance for normalized expenses relating to restructuring and other ‘below-the-line’ items of ~£50m pa.
Table 1 below sets out my calculation of AEV/EBIT, where AEV is the adjusted enterprise value, and EBIT is my normalized 1-year forward EBIT, as described above. To arrive at AEV, I make the following adjustments and allowances:
- Allowance for Financial Services at 0.5x reported book value.
- Adjust reported net debt for seasonality in working capital, and consideration as to how much of the reported cash holdings are available for investment.
- Remove lease liabilities from reported net debt.
- Allow for dividends and profits post balance date.
- Allow for residual restructure costs relating to the Save to Invest program announced in November 2020.
Table 1:
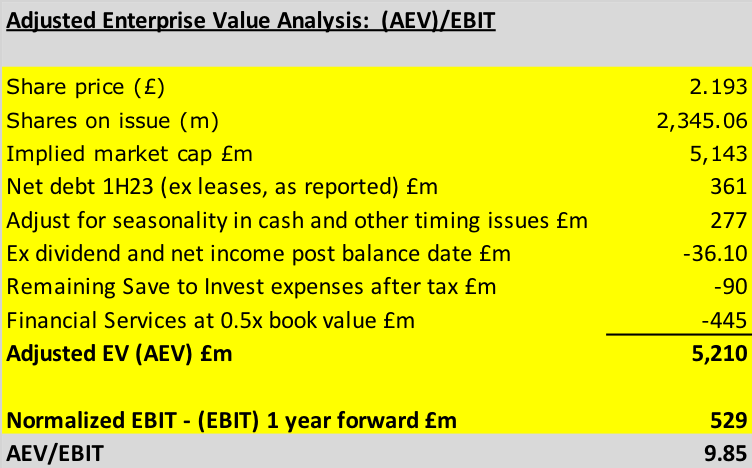
Source: Created by author using data from SBRY financial reports.
For a large supermarket group such as SBRY, I would typically regard an EV/EBIT multiple in the range of 12.5x to 14.8x as representing around fair value. Based on a current share price (London Stock Exchange close 23 December 2022) of £2.193, my analysis points to SBRY trading on a EV/EBIT multiple of ~9.9x.
Summary & Rating
Absent a very deep UK recession, my assumption is that the market has already priced in the impact of lower consumer demand for many UK retail stocks, including SBRY. I continue to believe that discretionary spending will be further squeezed as higher interest rates feed through into bigger mortgage repayments (the impact of which has been delayed by the large skew to two-year fixed rate mortgages). Falling house prices ought not to heavily dampen demand for supermarket sales, but the associated negative wealth effect and hit to consumer confidence is likely to be significantly negative for general merchandise sales.
SBRY has executed well to date on its Save to Invest strategy. I am persuaded by management claims that the company has more capacity than peers to use cost-out to mitigate against the inevitable squeeze on earnings caused by an economic recession and high inflation.
The valuation analysis described above points to SBRY currently being cheap. At £2.193 per share (London Stock Exchange market close 23 December 2022), SBRY is trading on a EV/EBIT multiple of ~9.9x. Near-term news flow for the UK retail sector is likely to be negative and this might provide a window for a lower entry price (as seen in October 2022), but overall I am happy to maintain a BUY rating on SBRY. An expected dividend yield of ~6% pa will appeal to income-focused investors.
Editor’s Note: This article discusses one or more securities that do not trade on a major U.S. exchange. Please be aware of the risks associated with these stocks.
Be the first to comment