

JasonDoiy/E+ via Getty Images
Introduction
I’m not a big fan of ETFs for a number of reasons. Reason one is that I like to do the work myself. It’s my job, so why let asset managers do the work for me? Reason two is that asset managers get a lot of power because of big ETF volumes. They can use this to fight proxy battles and other things. However, there are good ETFs on the market. ETFs that let investors buy certain industries, ETFs that give us insights into certain industries, and ETFs that do both. That’s where the iShares U.S. Transportation ETF (BATS:IYT) comes in. It holds some of my own biggest holdings and it tells us a lot about the economy. Right now, it’s telling us that there’s bad weather ahead. That’s bad for people who buy for short-term capital gains, but good news for people who like to buy value at a good price. In this article, I will give you the details and walk you through my thinking process.
So, without further ado, let’s get to it.
A Brief ETF Overview
I’m not going to bore you with things you already know, but an ETF is essentially an easy way to buy diversified exposure. This can be an S&P 500 ETF, a Nasdaq ETF, a Canada ETF, or an ETF covering one of many industries. In this case, we’re dealing with transportation stocks, which are part of the industrial sector and cover multiple industries.
This ETF is significantly exposed to railroads, air freight & logistics, and trucking. Airlines have the smallest exposure if we ignore a mere 1.7% exposure in marine transportation. I’m glad that airline exposure is small. It makes sense because the bigger three industries are bigger in general, but also because I do not like airlines as long-term investments. Competition is high and risks are very diverse as they include labor, fuel, weather, inflation in general, geopolitics, and more. Hence, airlines have been terrible long-term investments. I explain this in more detail in this article.
iShares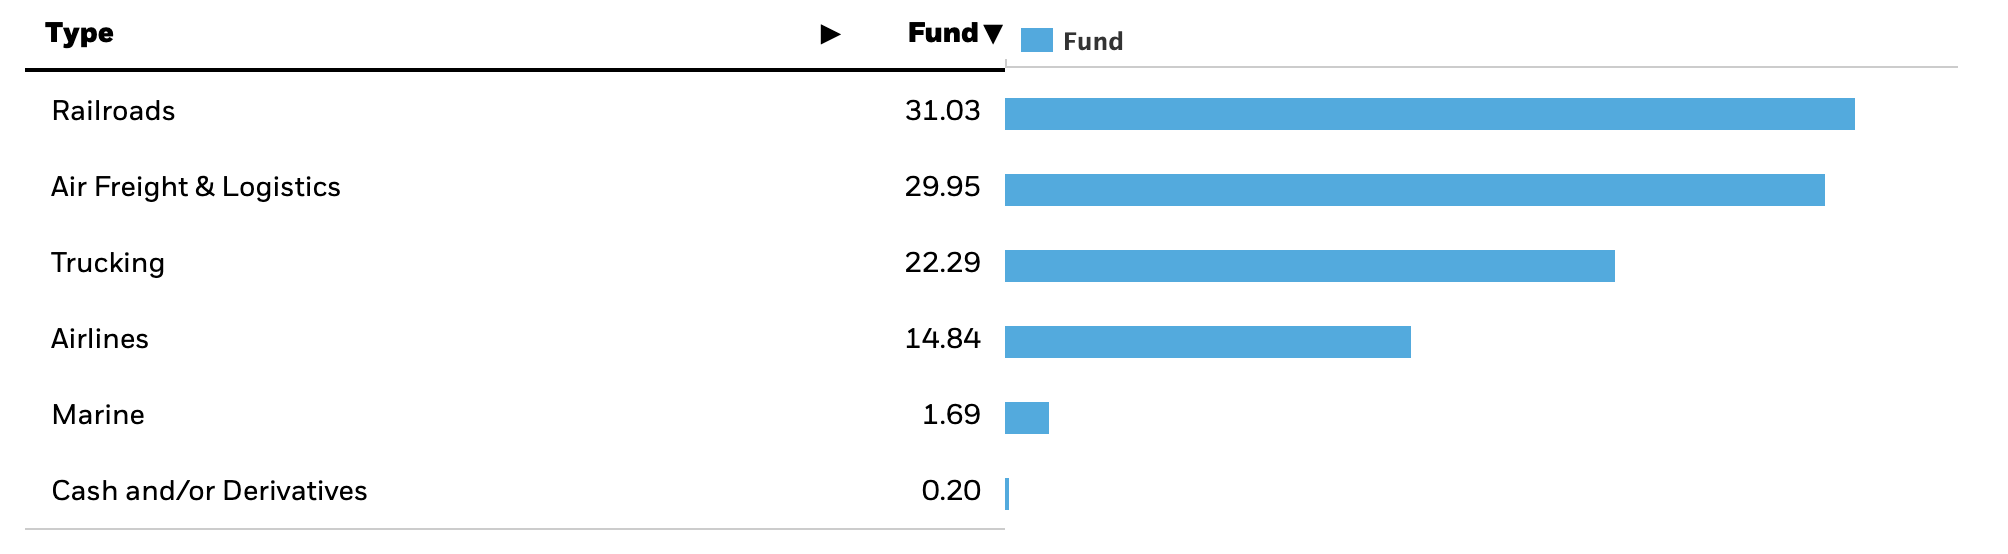
With that said, the table below shows the 49 biggest holdings with an above 0.15% weighting. Note that almost 20% is invested in Union Pacific (UNP) and United Parcel Services (UPS), I have invested close to 9% of my entire portfolio in Union Pacific, and I’m happy to see that iShares went overweight as well. I invite you to read my Union Pacific write-up here if you are interested.
Author (Data source: iShares)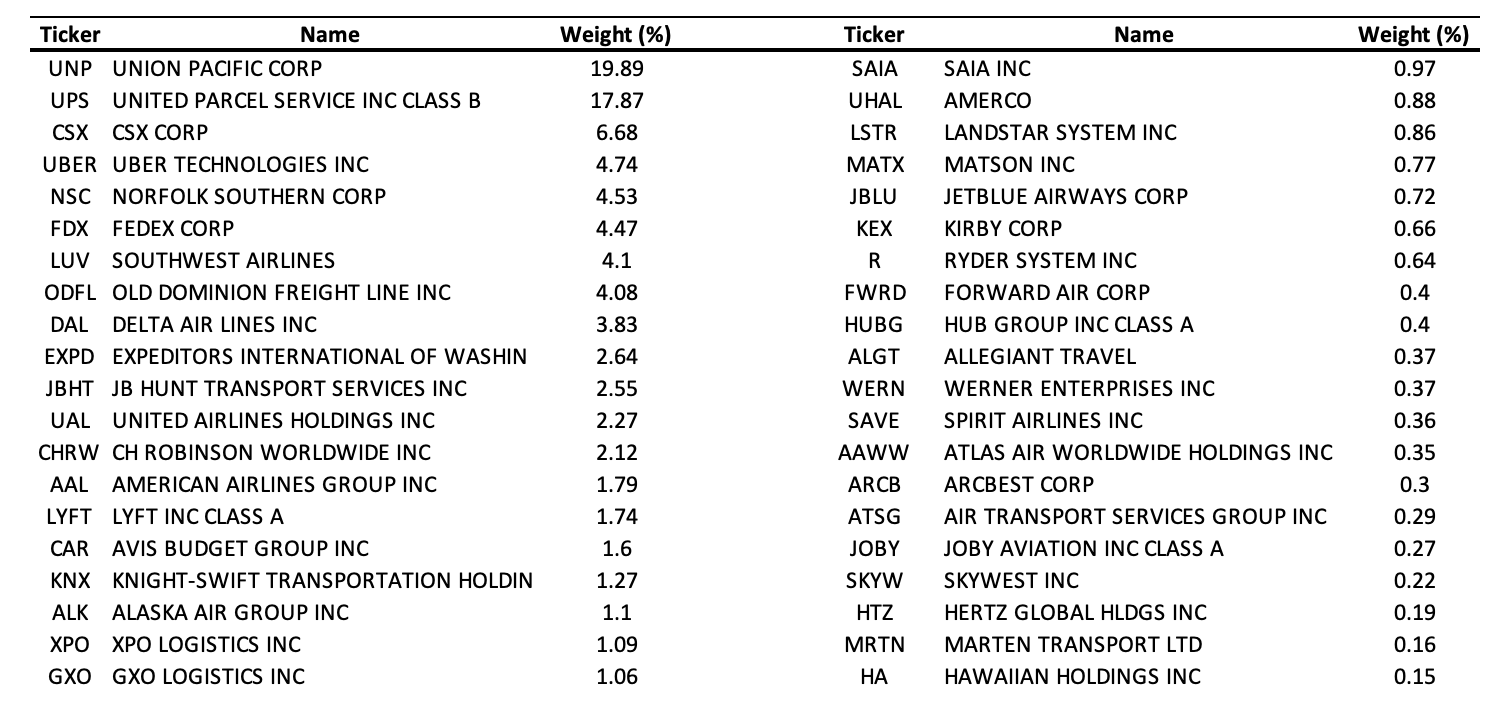
The ETF has a total of 52 holdings with an average 30 Day SEC (dividend) yield of 0.70%. That’s because a lot of freight companies have no dividend or a very low yield.
Last but not least, the fund has an 0.41% expense ratio, which is rather expensive, in my opinion. This means I prefer the ETF as a trading vehicle to “buy low and sell high” instead of a long-term investment alternative. I don’t want readers to (indirectly) pay their asset manager 0.41% per year. If investors want long-term exposure without too much risk, I suggest buying 1 railroad, 1 air freight and logistics company, and 1 trucking company.
My favorites are:
- Union Pacific – railroad – article
- FedEx Corp. (FDX) – air fright and logistics – article
- Old Dominion Freight Line (ODFL) – trucking – article
The graph below shows that investors get higher returns when buying the three stocks above with just a slightly higher standard deviation. The worst year is just 2 points worse. Hence, both the Sharpe and Sortino ratios are much better with a lower market correlation.
Portfoliovisualizer.com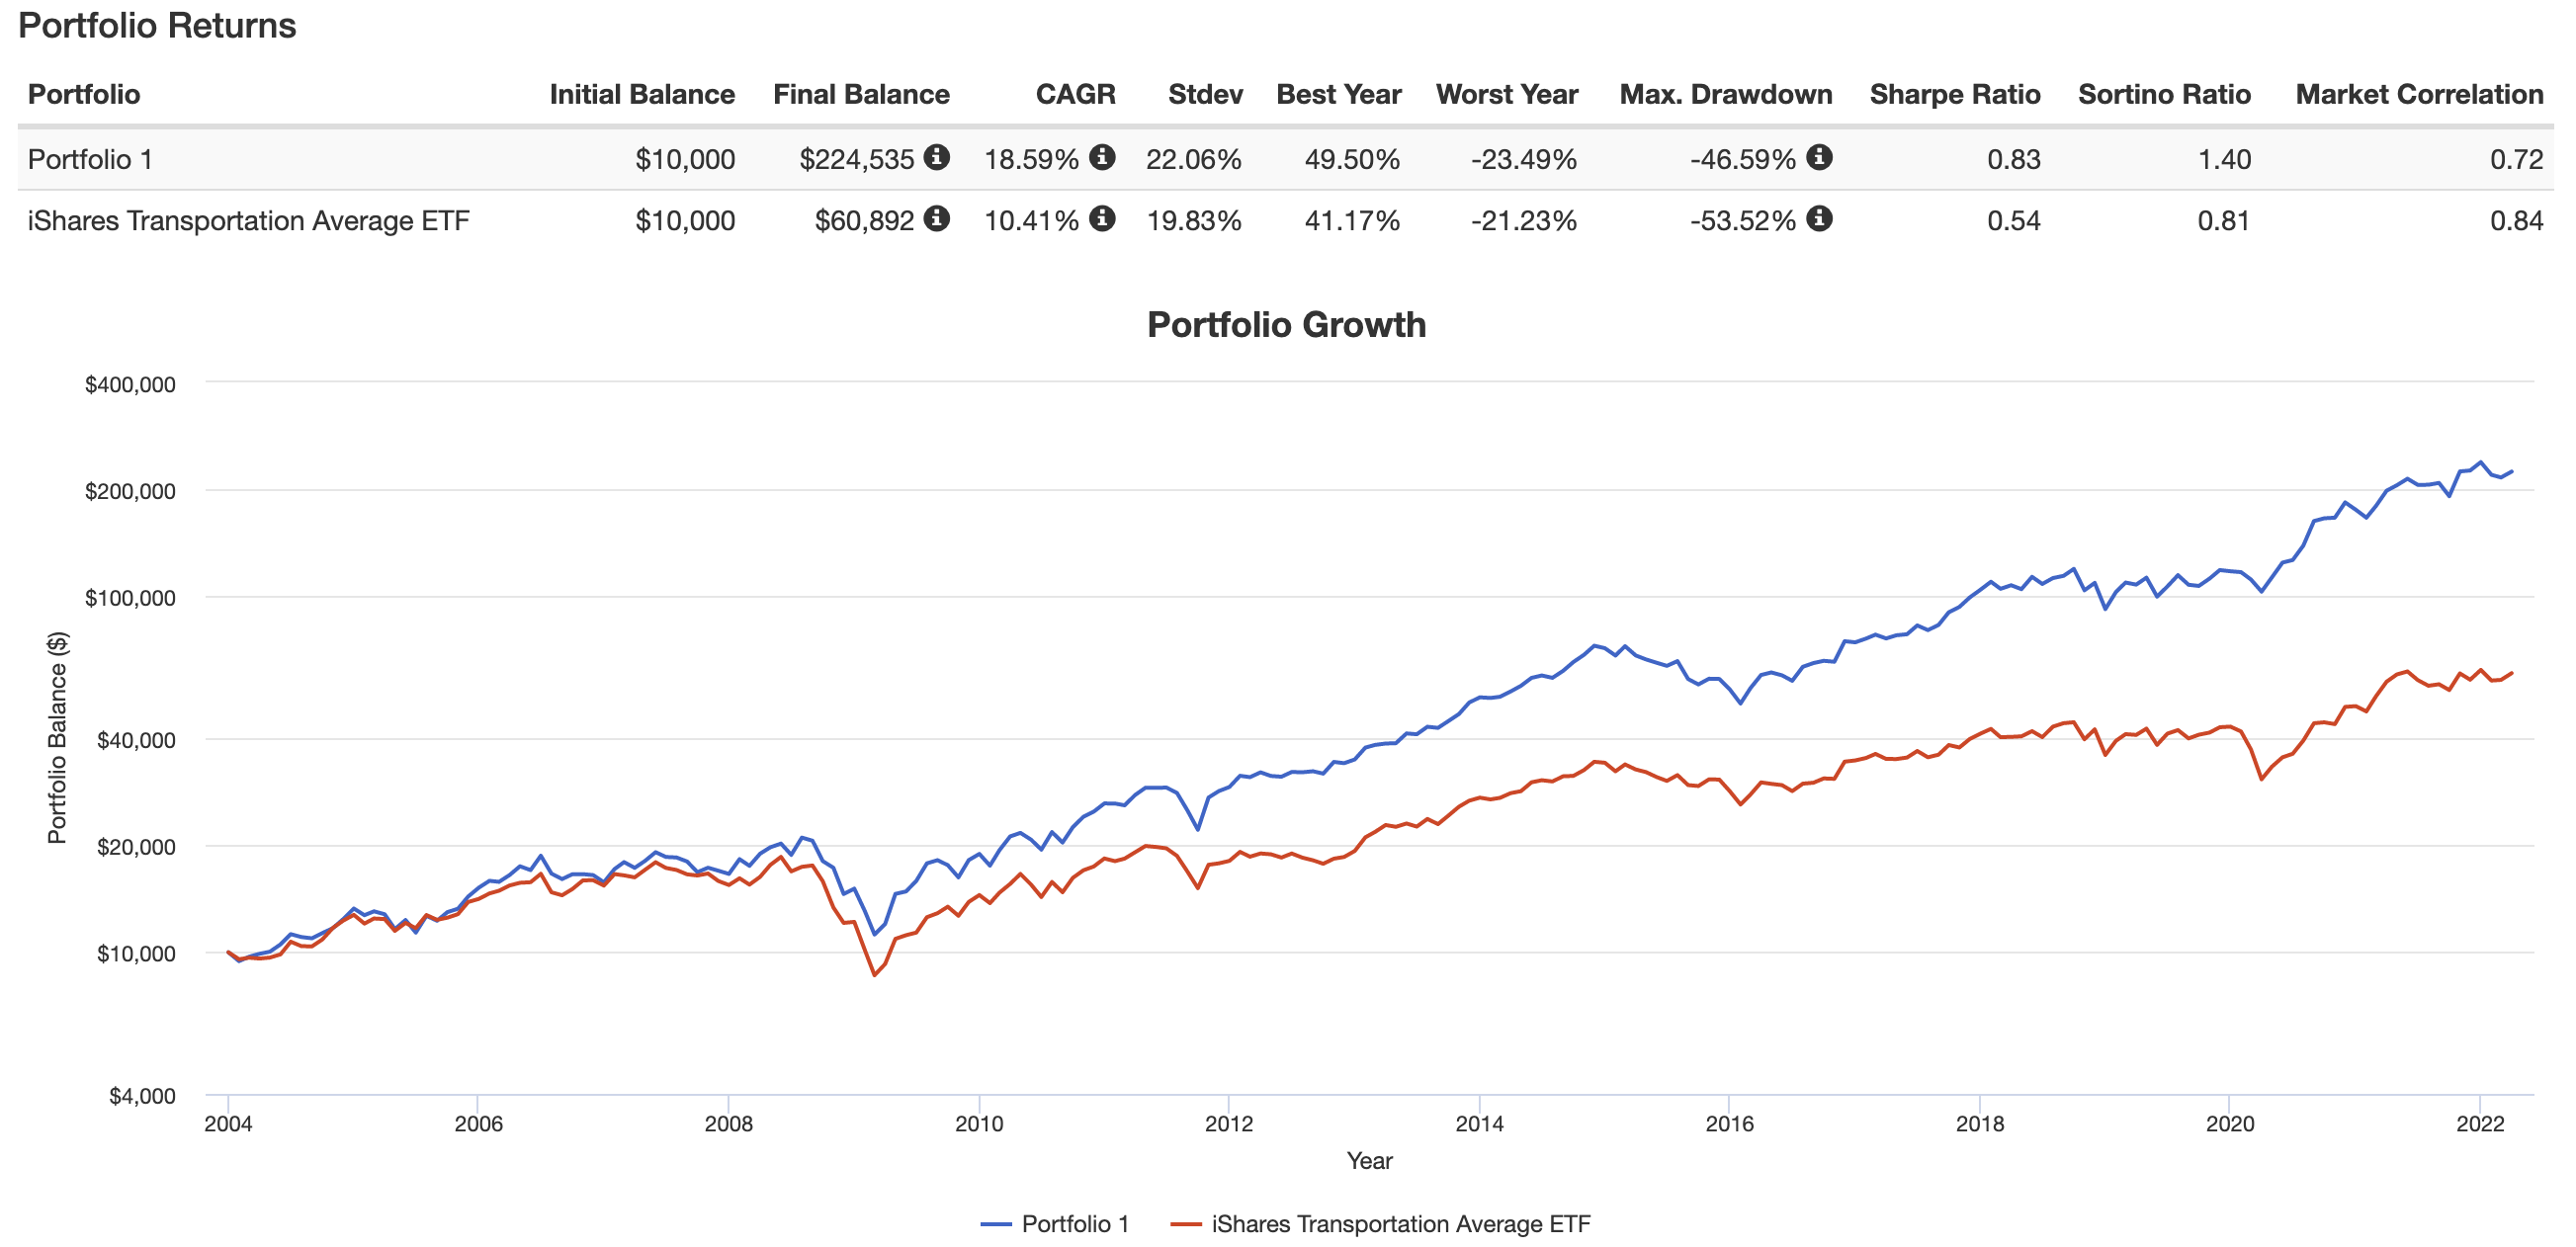
I’m not making the case that everyone should buy these three companies, but I want to offer an alternative after I said that 0.41% per year for IYT is too much. I think investors will like this much cheaper alternative.
Now, on to the economy:
Macro Headwinds: It’s Getting Cloudy
Transportation is the backbone of every country and company. It’s the blood of every economy as it connects every single component of every single supply chain. Especially when buying a diversified ETF like IYT, one gets exposure to every aspect of transportation. Road, rail, air, water. I think one can make the case that midstream companies are also transportation companies in a way. However, that’s energy and not industrial exposure.
In the Union Pacific article that I referenced twice in this article, I highlight a $240-$270 trading range. Using the updated stock price, this is what the trading range looks like:
FINVIZ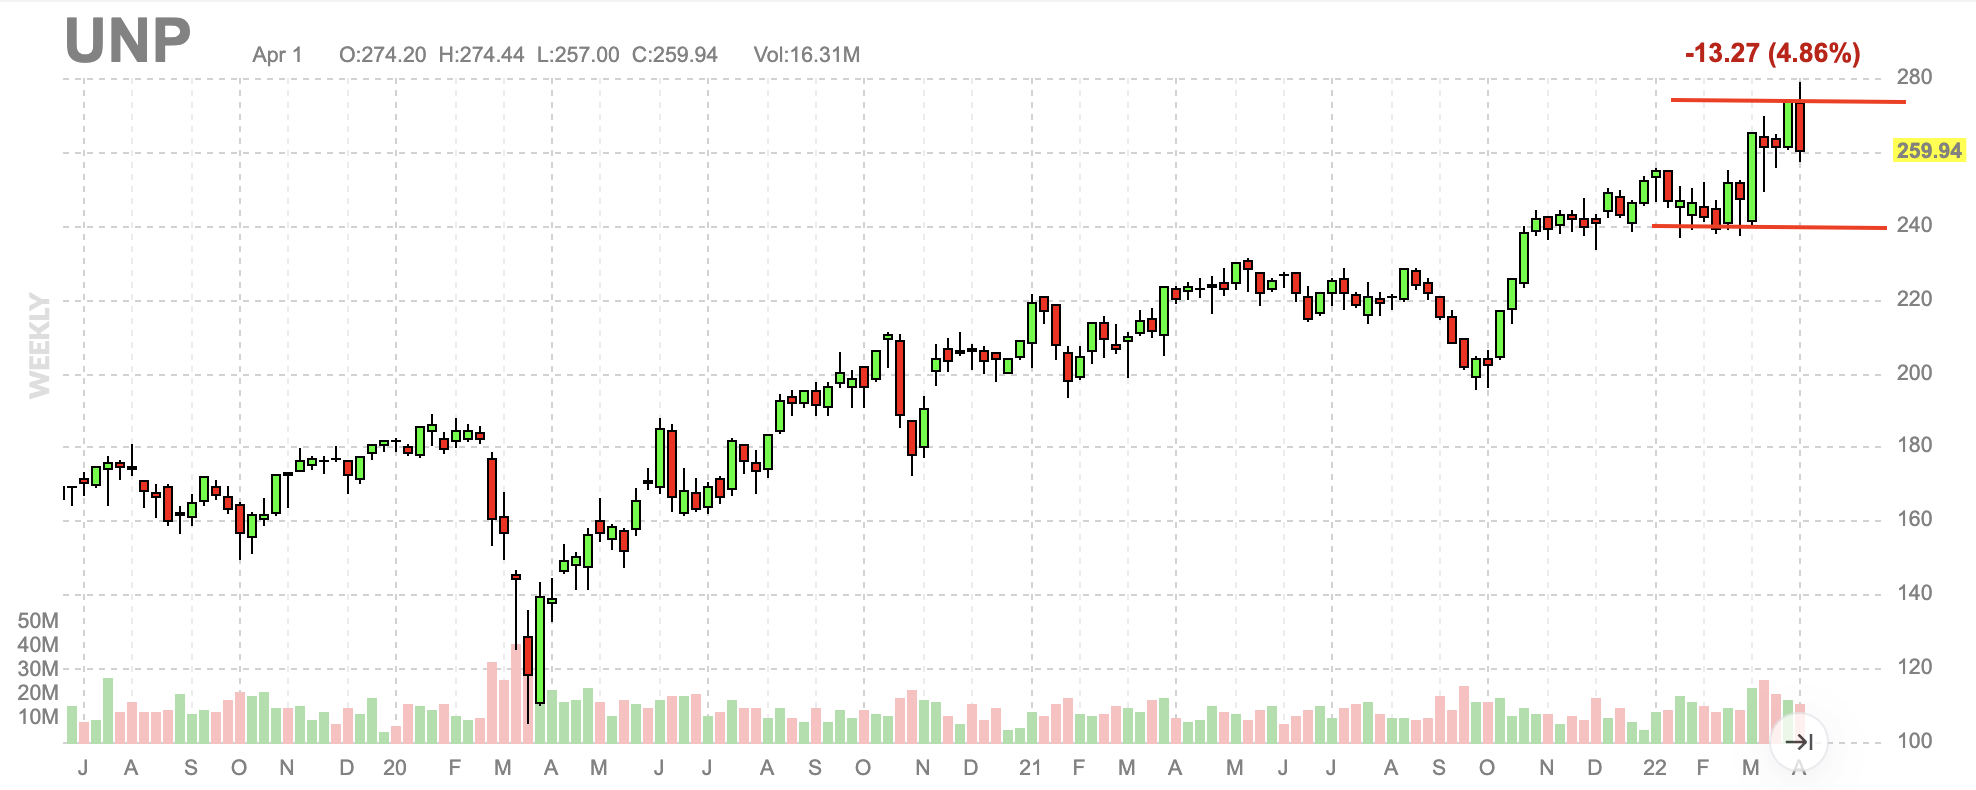
Bear in mind that UNP has a 20% weighting in IYT and that my reasoning was based on factors that impact more or less all transportation companies.
The problem is that we’re seeing growth slowing in the US and abroad, which hurts exports.
The graph below shows the ISM manufacturing index (orange) and the logarithmic chart of the IYT ETF. The ISM index is a monthly conducted survey that tells us where economic growth is headed. Right now, it’s down. While I am writing this, we just got the number for March: 57.1. While that is 7.1 points above the neutral 50.0 number, it’s another low in the current cycle. Hence, if history is any indication, investors will de-risk their portfolios. Right now, that’s causing IYT to roll over.
TradingView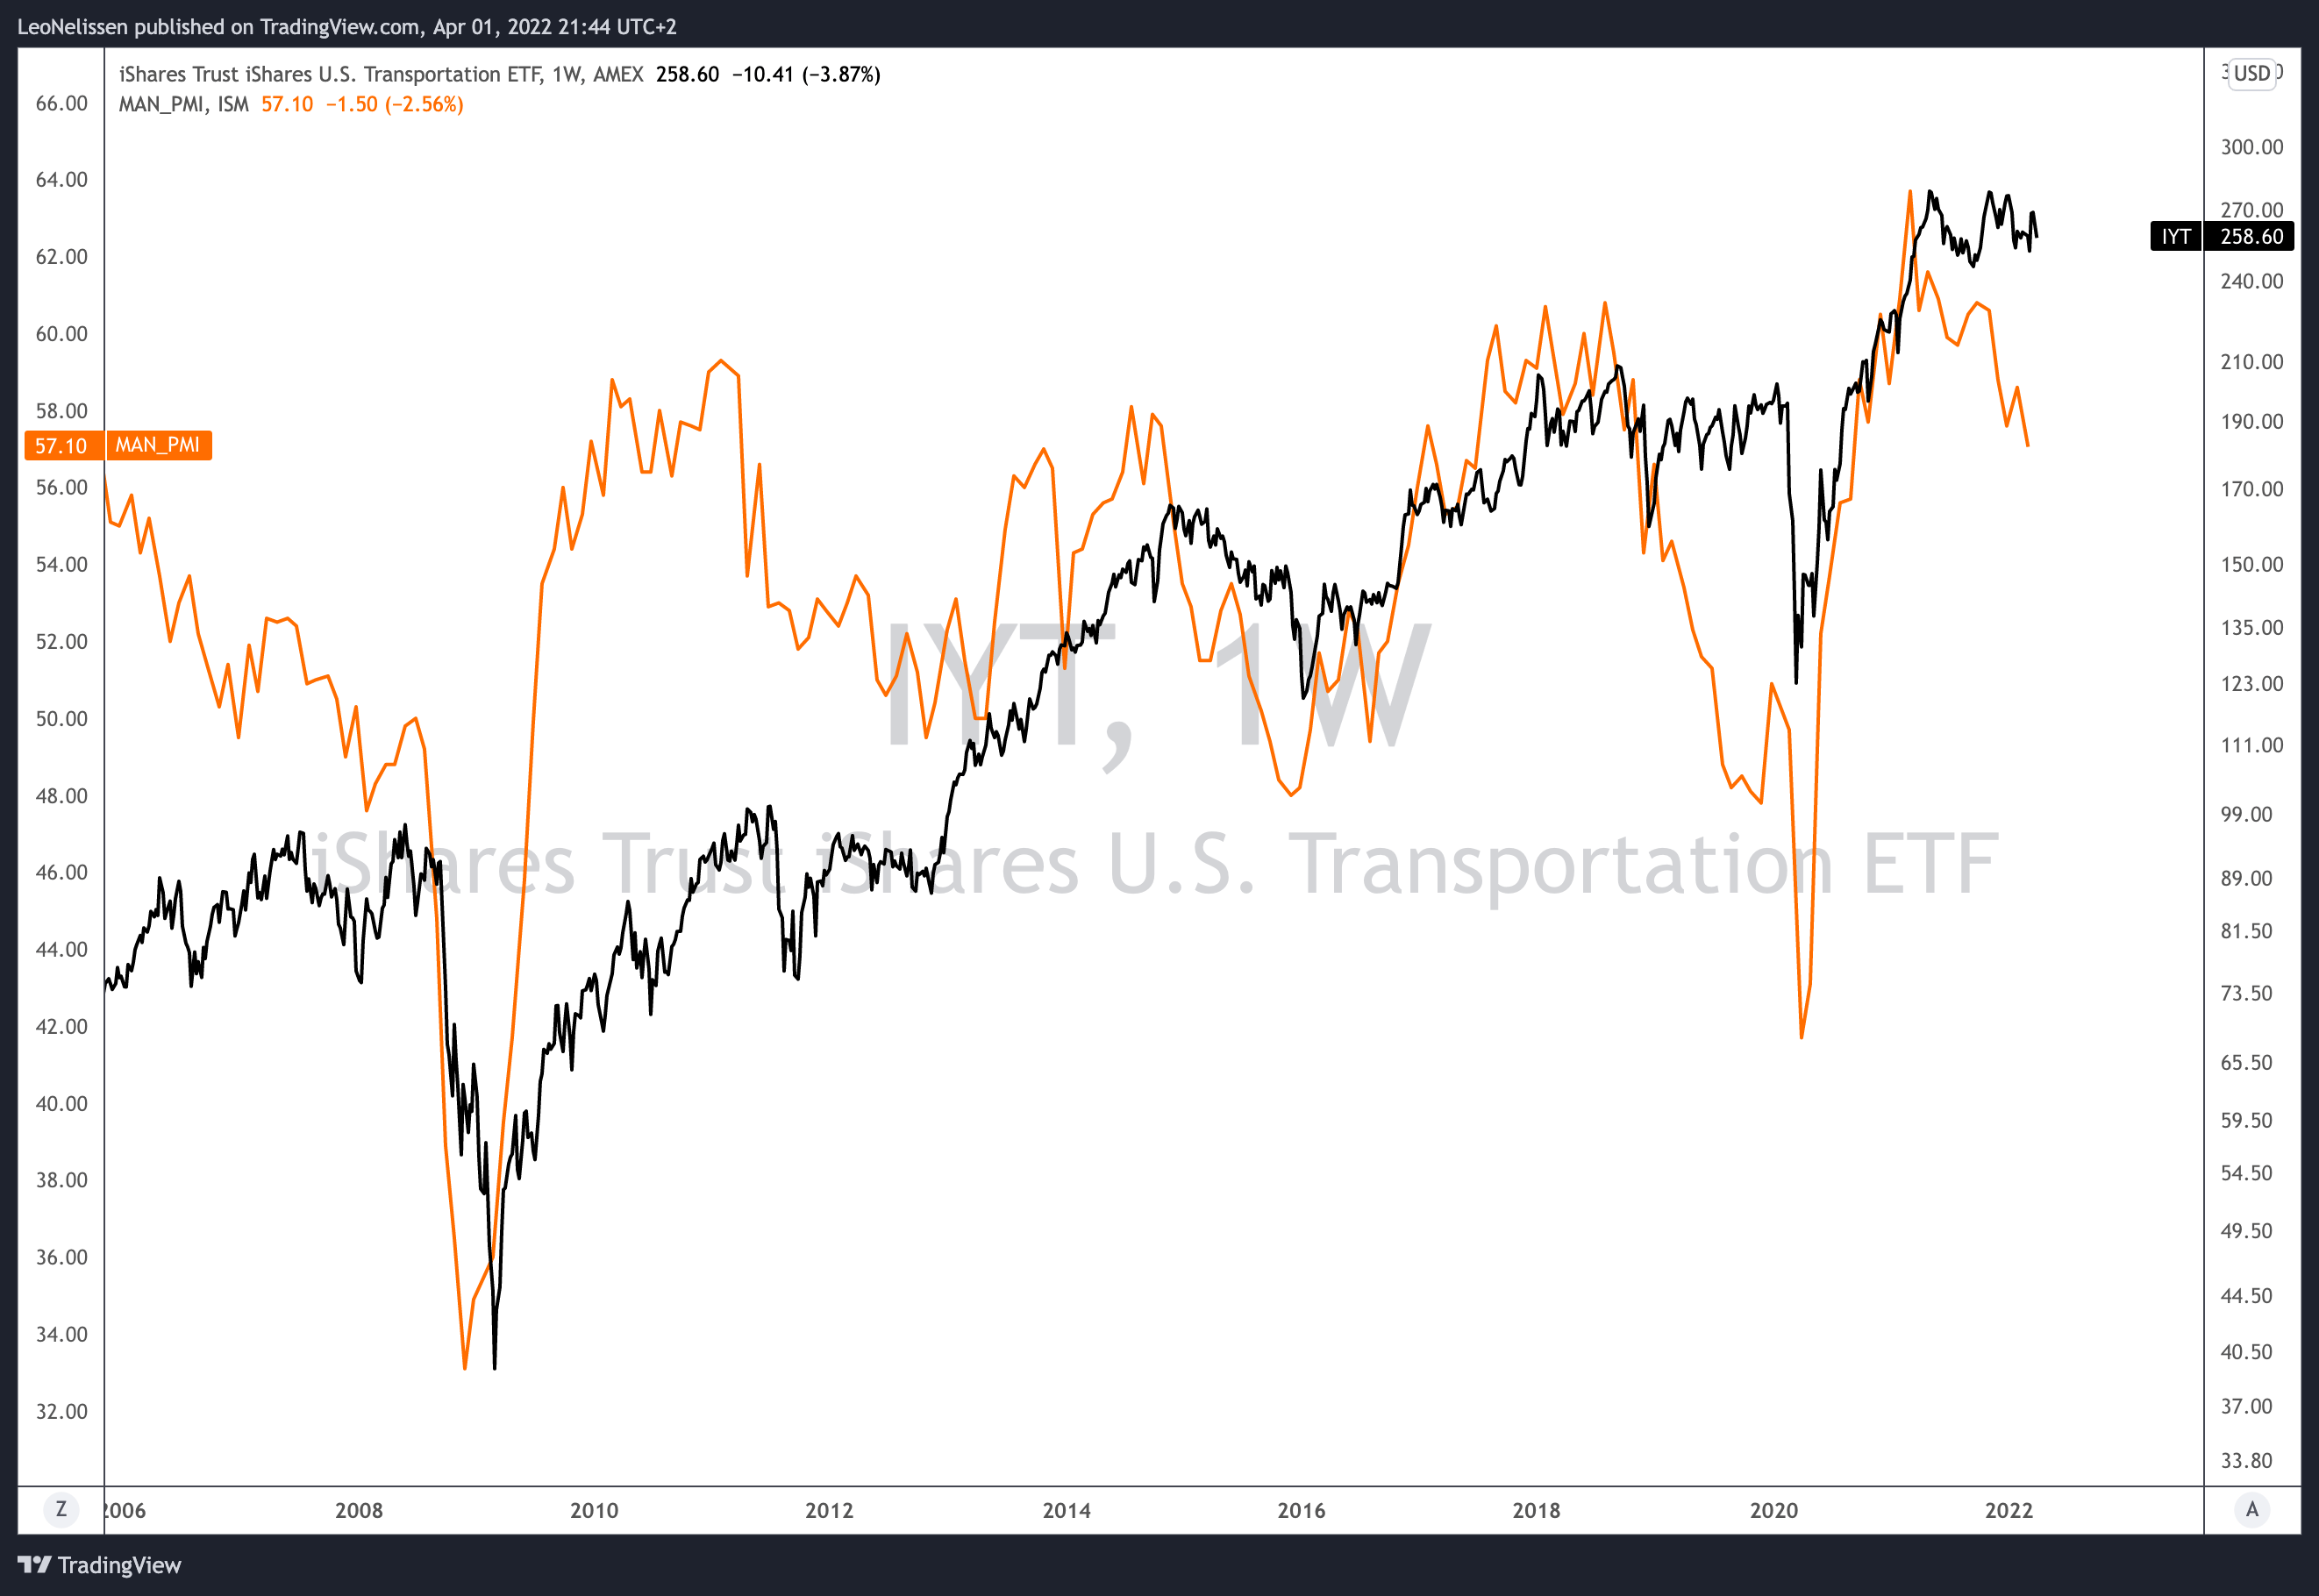
So far, transportation stocks have held up nicely, which I believe is the result of the war in Ukraine. Russia has been cut off from the global economy, which means it’s a bonus for US exports as it needs to ship more coal, agriculture commodities, and related materials. Also, transportation stocks are often “value” stocks. When tech sold off, the money went into these stocks.
The next graph also displays the ISM index. However, this time it shows the IYT/S&P 500 ratio instead of the outright price of IYT. While the pandemic prevented the ratio from bouncing back due to the rapid outperformance of tech (the S&P 500 has a lot of tech stocks), both lines still move in lockstep.
TradingView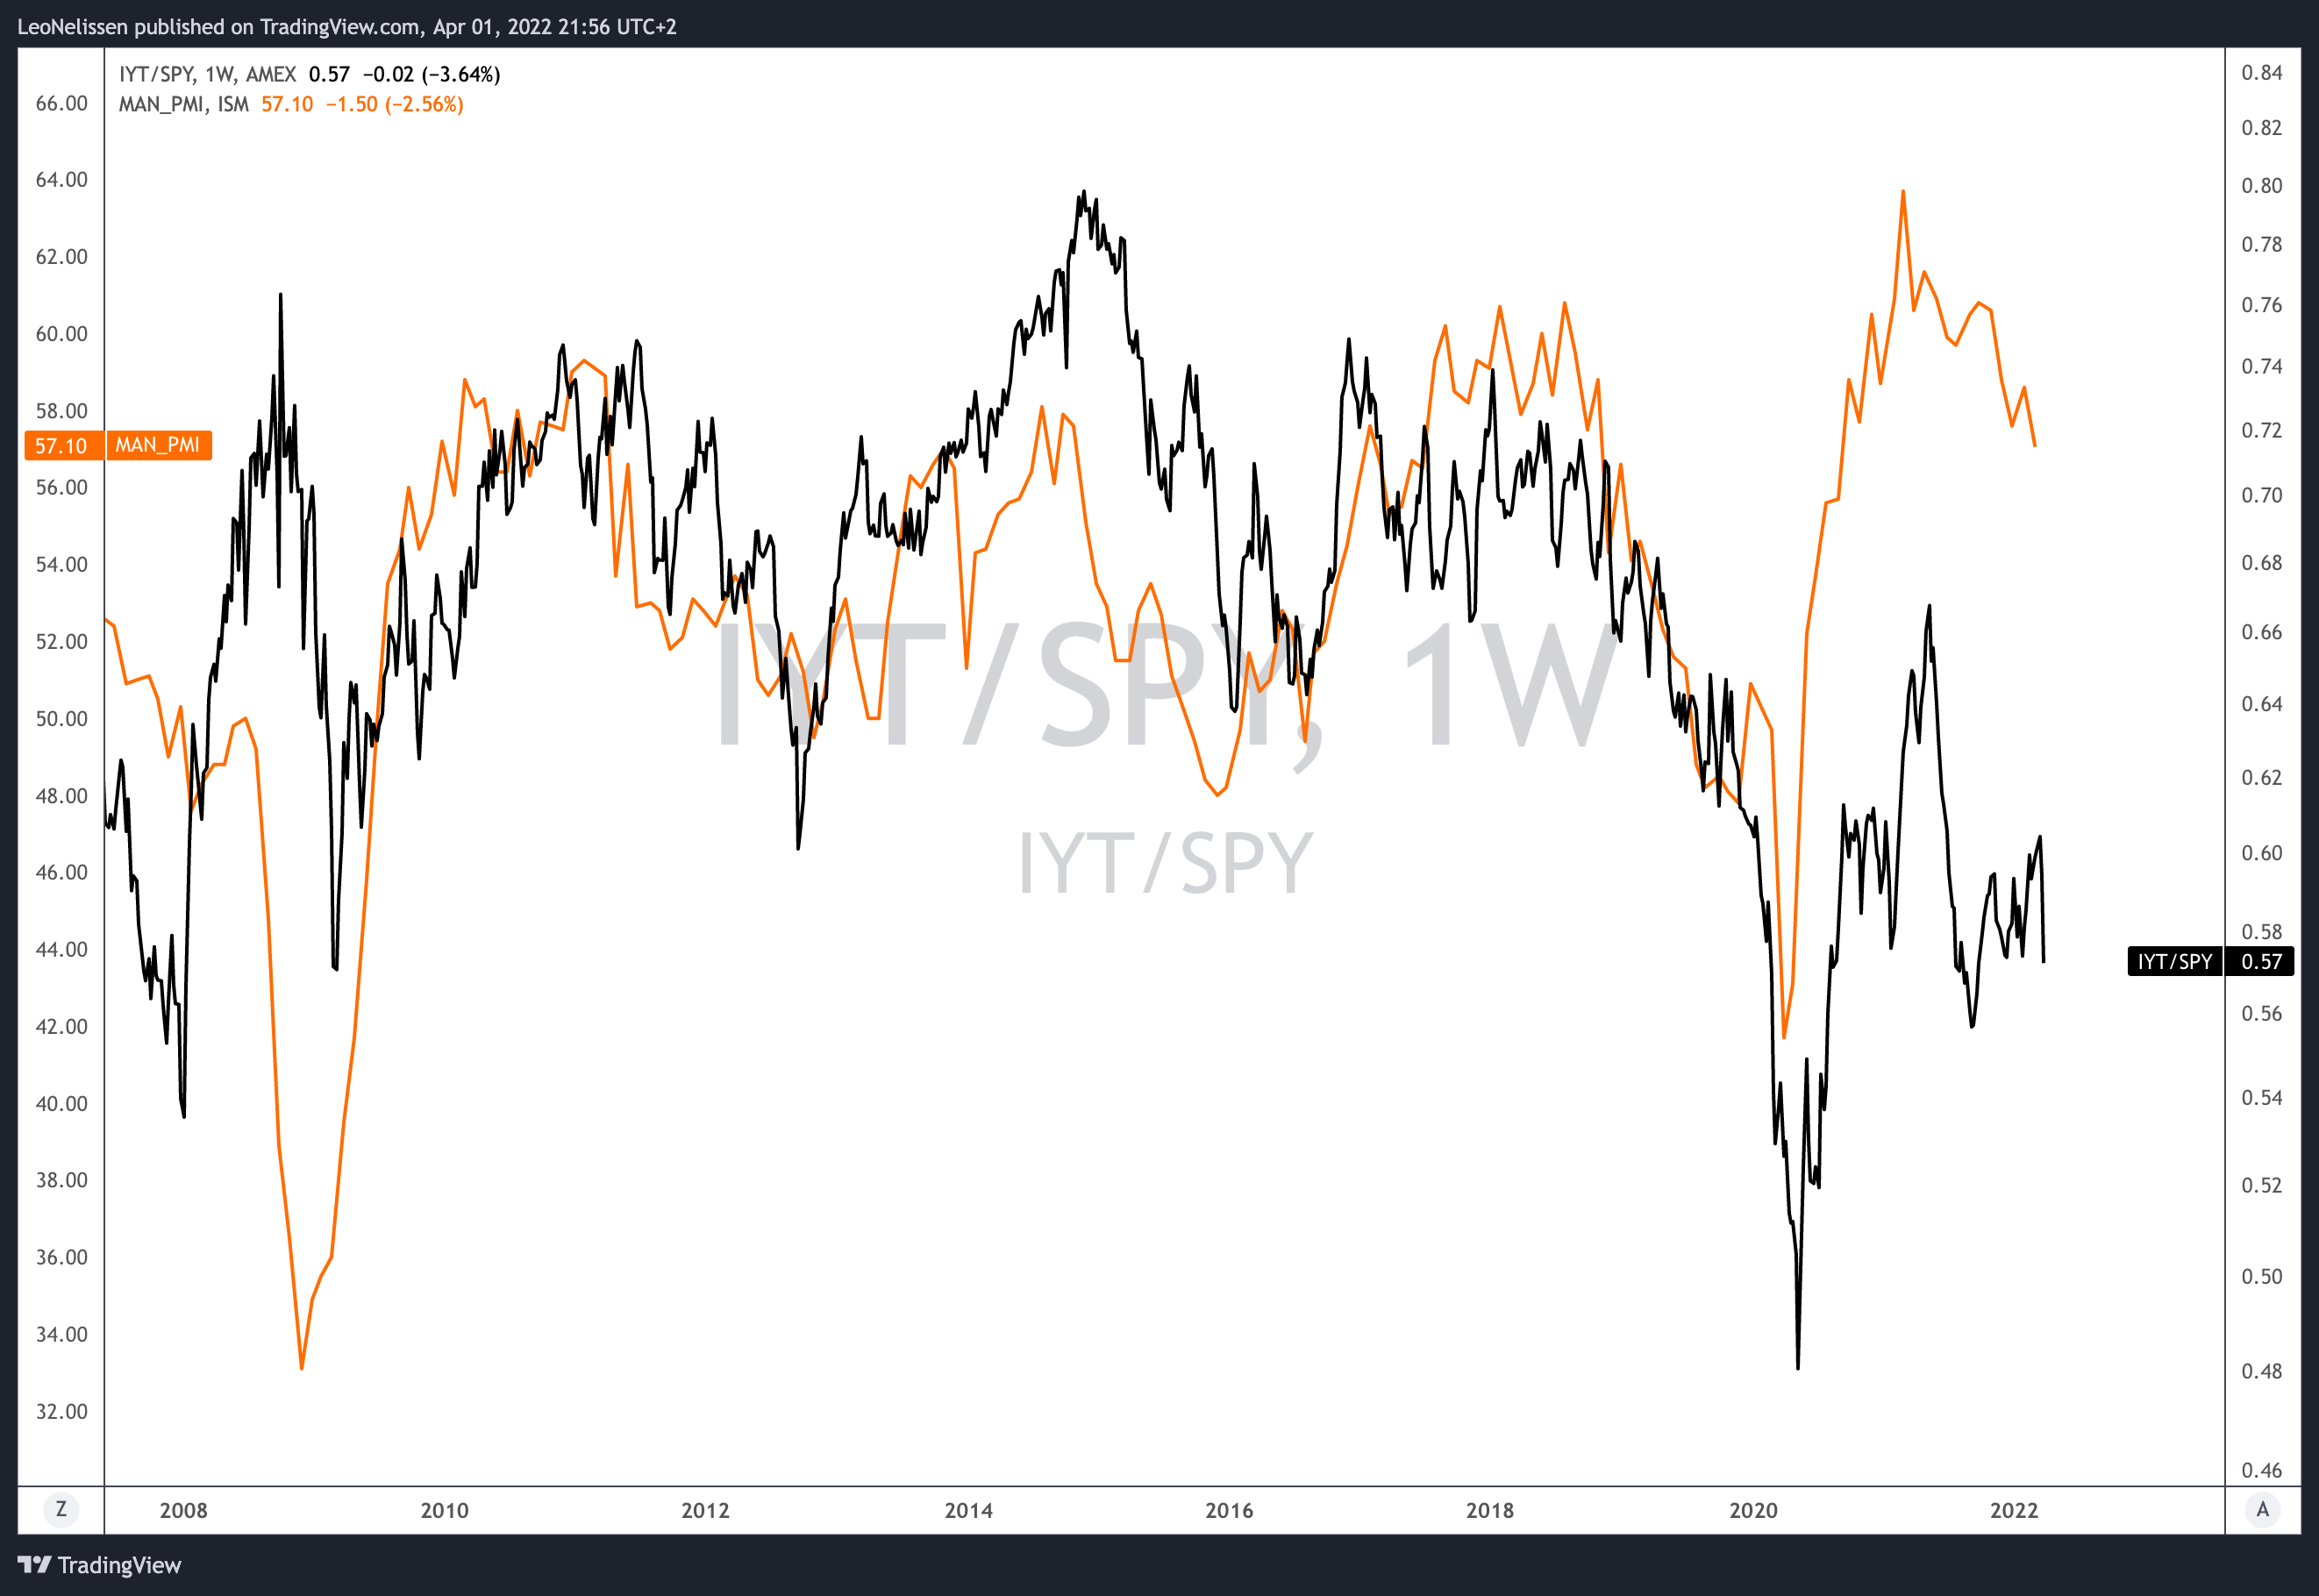
Moreover, consumer sentiment has rolled over. It’s now close to 2009 lows as high inflation, ongoing supply chain problems, and peaking economic growth are doing a number on the American consumer. Bear in mind that consumer spending is roughly 70% of the US economy with all major transportation companies being dependent on consumer-related shipments.
St. Louis Federal Reserve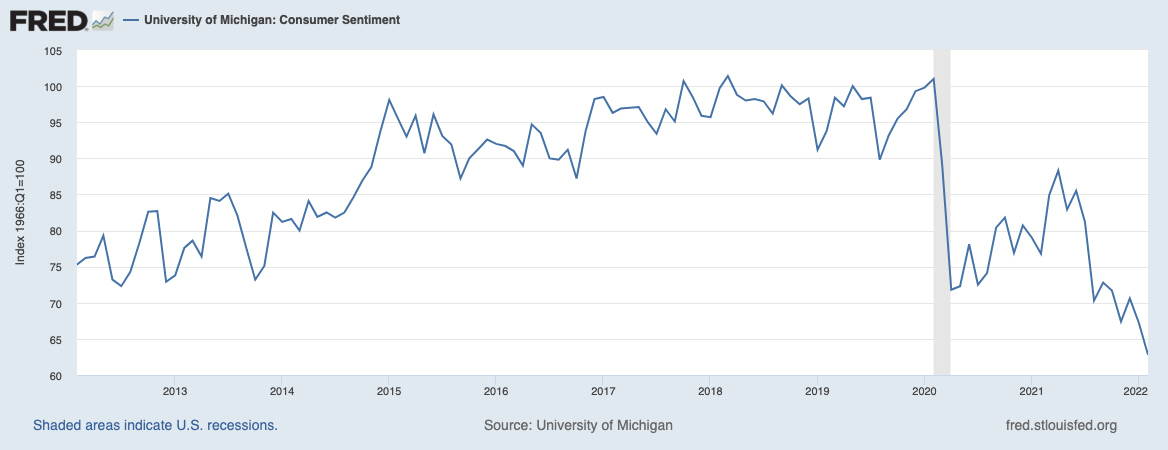
The good news is that the retailer inventory/sales ratio is still too low, which means that it will take some time until inventories are refilled, which will help transportation companies. The ratio is this low because of broken supply chains. Inventories were not able to keep up with rebounding demand. Major ports were clogged up, trucking companies had labor shortages, and high fuel costs made things worse.
St. Louis Federal Reserve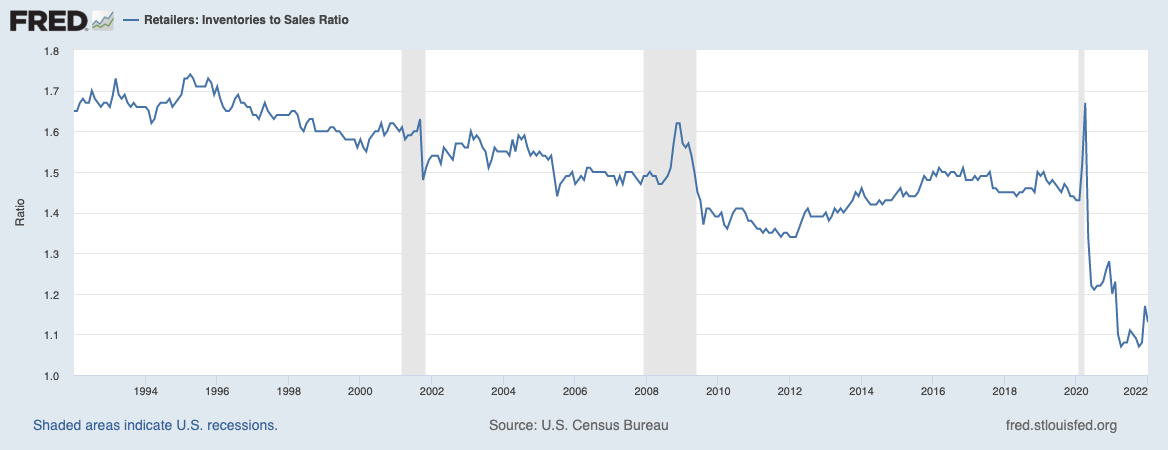
Unfortunately, for now, all eyes are on slower economic growth in combination with ongoing high inflation. This is causing serious stagflation risks, which is toxic for cyclical companies.
Moreover, the yield curve is now negative (10-year vs. 2-year yield). The 2-year yield is yielding more than the 10-year yield as market participants are betting on an aggressive Federal Reserve hiking cycle to combat inflation. A higher 2-year yield means that participants expect the 10-year average Fed rate to be lower than the average 2-year rate. Meaning the Fed will likely be forced to cut rates again after hiking. In other words, a recession is more likely.
TradingView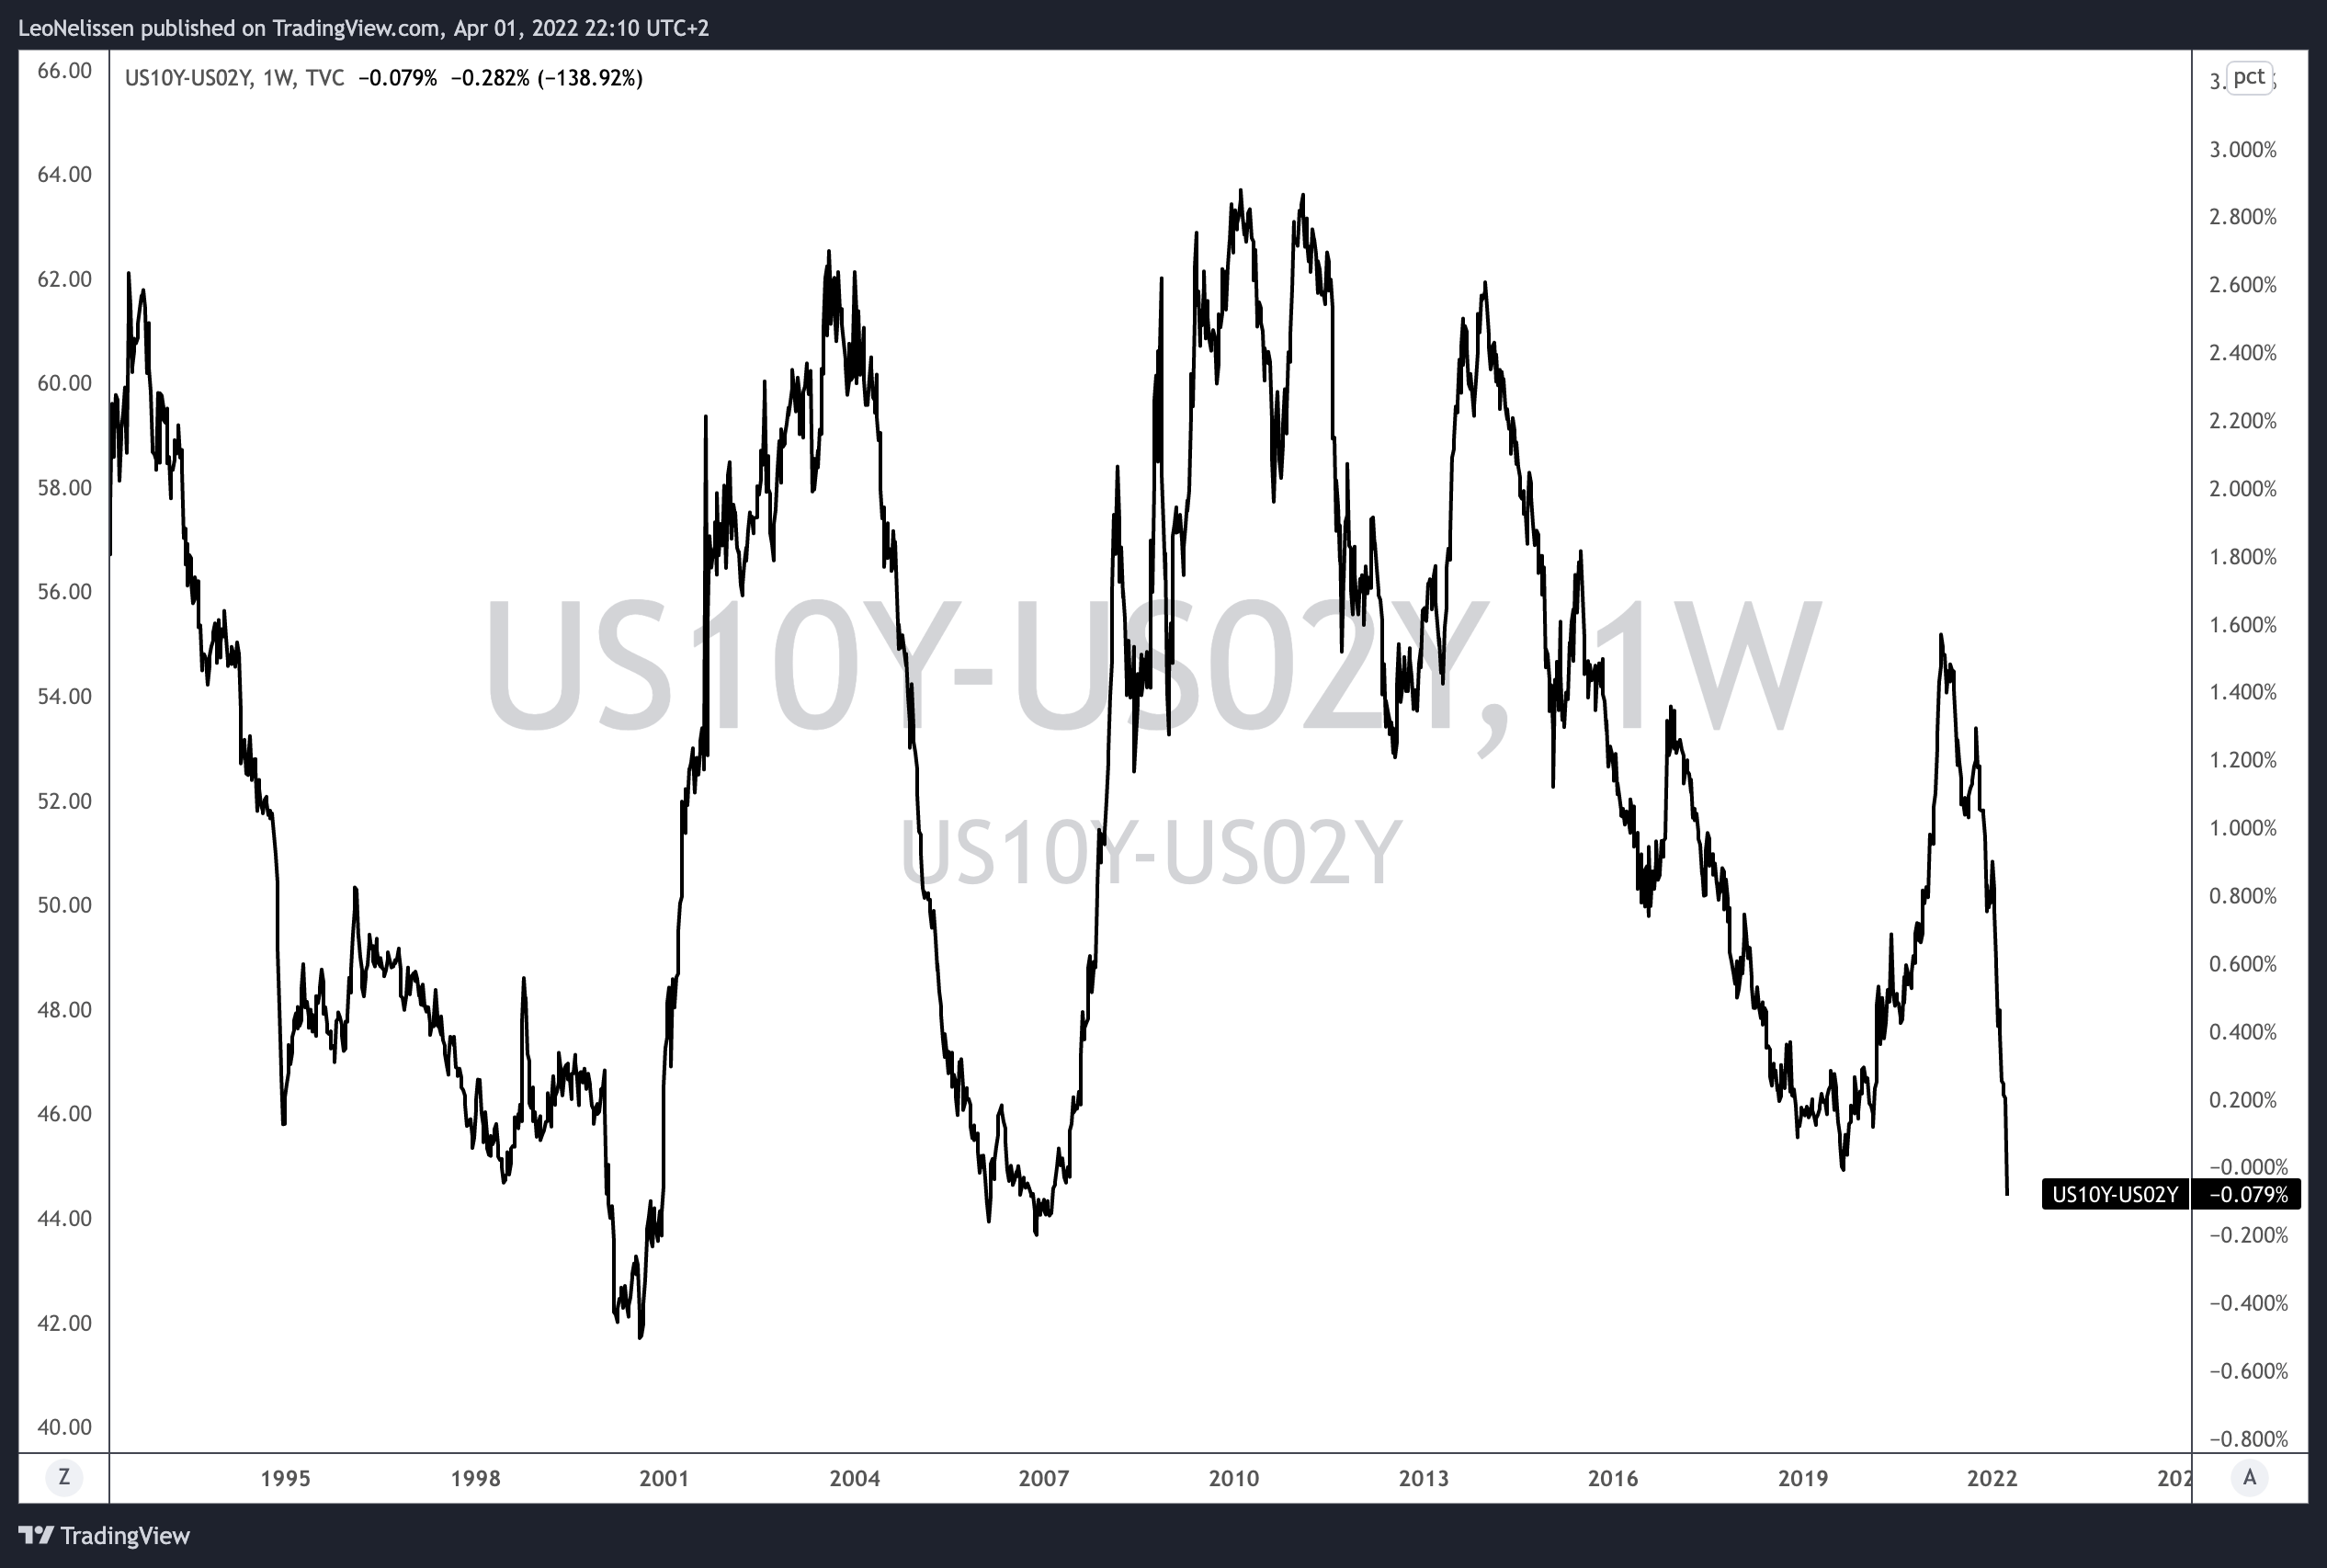
So, with all of this said, here’s how I’m dealing with the situation:
Takeaway
I’m a big fan of transportation stocks in general. I might be a bit biased because of my supply chain and purchasing background, but I have to say that the US has some of the best transportation stocks in the world. The IYT ETF holds high-quality dividend growth railroads, trucking companies that do well in a highly fragmented market, as well as air freight companies that have a footprint so big that “let me FedEx it” has become a saying.
However, there are some issues. The economy is in a tough place. Economic growth is falling, prices are not. We’re seeing a dangerous mix that could mean stagflation with severe consequences for the consumer while supply chain issues continue to bug industrial companies.
Hence, IYT does have more downside. It’s very hard to say how much, but I think a $240-$280 range, for the time being, is fair.
FINVIZ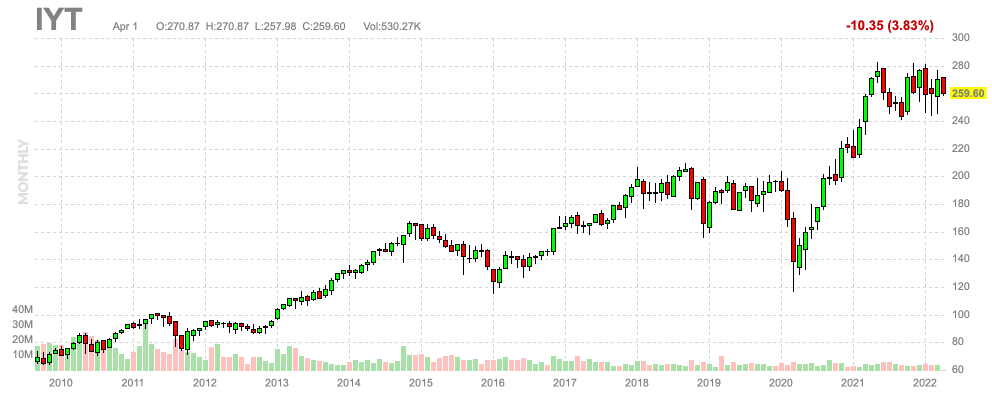
Personally, I’m lowkey rooting for lower prices as I want to buy more transportation stocks, which is something I frequently discuss on Seeking Alpha.
In this article, I gave you three alternatives that can be bought in case people do not want to pay an 0.41% expense ratio. The IYT expense ratio is high, and I would not be paying that much on a long-term basis.
So, my game plan is to buy individual stocks once IYT drops to $240 or slightly below. Investors who want to avoid stock picking can buy the ETF if the risk/reward is more attractive, but I would not hold it long-term for one reason only: the expense ratio.
Other than that, I think we’re dealing with a terrific ETF that’s telling us one thing right now: watch out, economic growth isn’t that great. Hence my neutral rating.
(Dis)agree? Let me know in the comments!
Be the first to comment