

Lazy_Bear
(This article was co-produced with Hoya Capital Real Estate)
Introduction
Recently I published MDY Vs. SPY: Skipping The Crowd Has Benefits that showed Mid-Cap stocks can be a great asset class to own, especially for investors overweighted in Large-Cap stocks. Looking deeper into the Growth/Value Mid-Cap asset’s sub-classes, history surprised me with which has treated investors better.
PortfolioVisualizer.com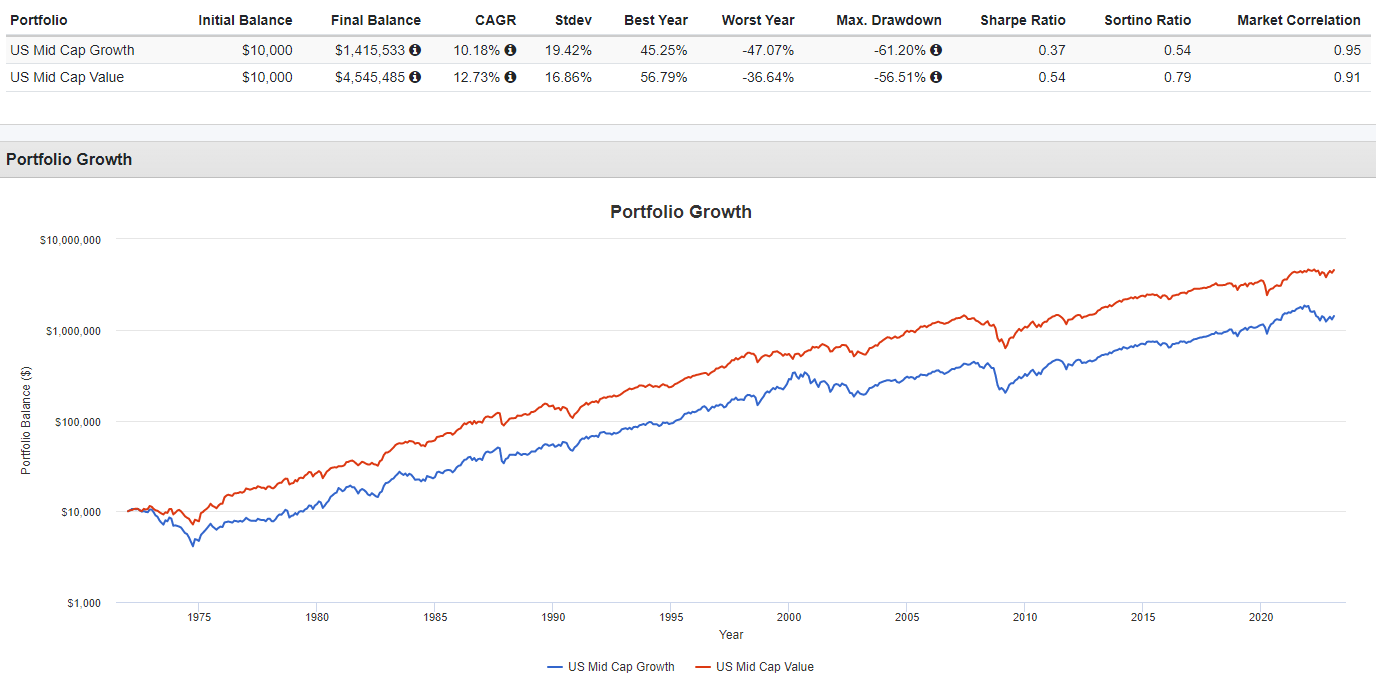
Based on that, I chose to review and compare two ETFs that invest in that sub-class based on two popular indices, those being:
Readers will see that the IJJ ETF has a slight edge in CAGR and risk ratios, but they are close enough that my suggestion is owning the one that matches the Index family of their other US equity ETFs that investor owns.
iShares Russell Mid-Cap Value ETF review
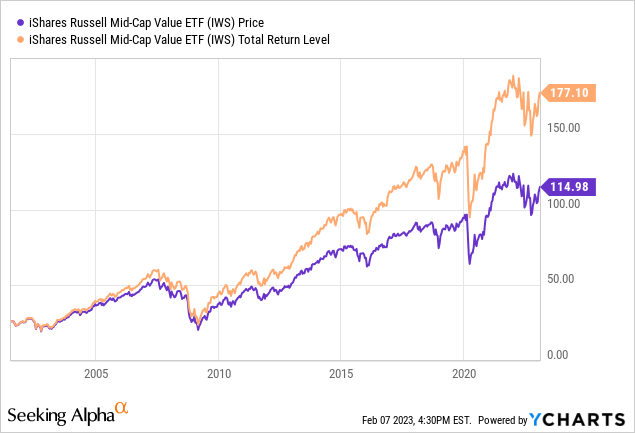
Seeking Alpha describes this ETF as:
IWS seeks to track the investment results of the Russell Midcap Value Index composed of mid-capitalization U.S. equities that exhibit value characteristics, using the Russell Midcap Value Index as its guidepost. IWS started in 2001.
IWS has $13.6b in AUM and provides investors with a 1.78% yield. The managers charge 23bps in fees; a level I find high for an index-based ETF.
Index review
Reviewing the Index helps potential investors understand how the portfolio might change. Russell Investments describes their index as:
The Russell Midcap® Value Index measures the performance of the midcap value segment of the US equity universe. It includes those Russell Midcap Index companies with relatively lower price-to-book ratios, lower I/B/E/S forecast medium term (2 year) growth and lower sales per share historical growth (5 years). The Russell Midcap Value Index is constructed to provide a comprehensive and unbiased barometer of the mid-cap value market. The index is completely reconstituted annually to ensure larger stocks do not distort the performance and characteristics of the true midcap value market.
Source: research.ftserussell.com Index
IWS holdings review
The sector allocation is currently:
ishares.com; compiled by Author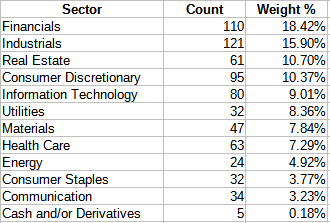
With 700 stocks, the top 4 sectors account for 55% of the stocks and weight of the portfolio. I will compare this data against the IJJ ETF later.
ishares.com; compiled by Author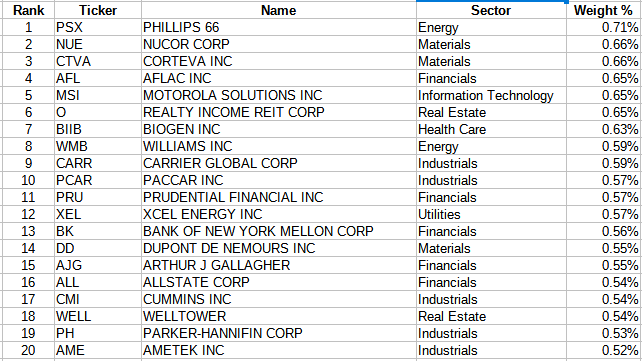
The top 20 stocks are just under 12% of the portfolio, with the smallest 350 stocks representing just over 18% of the portfolio. This is a lower share than what we will see for the IJJ ETF. The ETF also hold two future contracts; the S&P500 EMINI MAR 23 (25 contracts) and the expected S&P MID 400 EMINI MAR 23 (58 contracts). Since they don’t invest in Large-Cap, I cannot explain why that futures contract is held.
IWS distribution review
sekingalpha.com IWS DVDs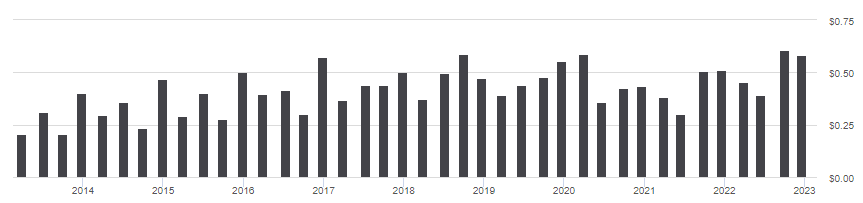
One advantage IJJ has over IWS is its much higher dividend growth over the 3, 5, and 10-year periods. Even so, the results still garnered a “A-” rating from Seeking Alpha’s Quant Rating.
seekingalpha.com IWS scorecard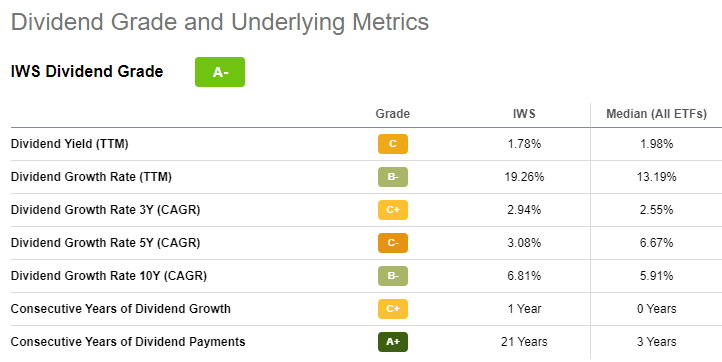
iShares S&P Mid-Cap 400 Value ETF review
Seeking Alpha describes this ETF as:
IJJ seeks to track the investment results of the S&P MidCap 400 Value Index composed of mid-capitalization U.S. equities that exhibit value characteristics. The ETF may invest up to 20% of its assets in certain futures, options and swap contracts, cash and cash equivalents. IJJ started in 2000.
IJJ has $8.4b in AUM and shows a 1.77% yield. Here the fees are lower, 18bps, but still above average for an index-based ETF.
Index review
S&P describes their index as:
We measure value stocks using three factors: the ratios of book value, earnings, and sales to price. S&P Style Indices divide the complete market capitalization of each parent index into growth and value segments. Constituents are drawn from the S&P MidCap 400®.
Source: research.ftserussell.com Index
They also provided basic characteristics for the MCV Index.
spglobal.com Index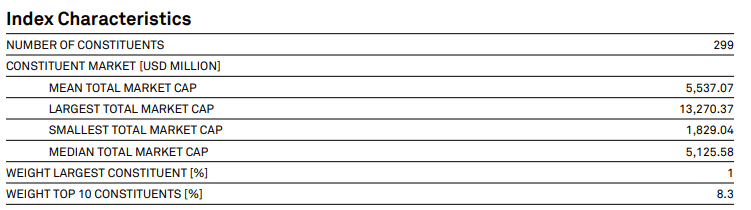
The Index is float-adjusted, market-cap weighted, with rebalancing occurs each calendar quarter.
IJJ holdings review
The sector allocation is currently:
ishares.com; compiled by Author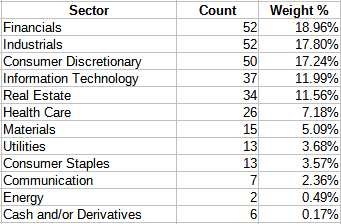
With 300 stocks, the top 3 sectors account for over half the stocks and portfolio weight.
ishares.com; compiled by Author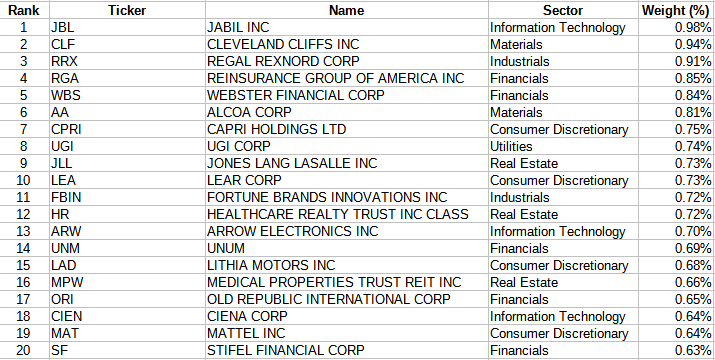
The Top 20 stocks account for 15% of the portfolio weight. With an impressive 30% weight, the smallest 50% of the stocks still account for a meaningful percent of the portfolio. To stay fully invested, IWS holds 50 contracts of the S&P MID 400 EMINI MAR 23 futures.
IJJ distribution review
seekingalpha.com IJJ DVDs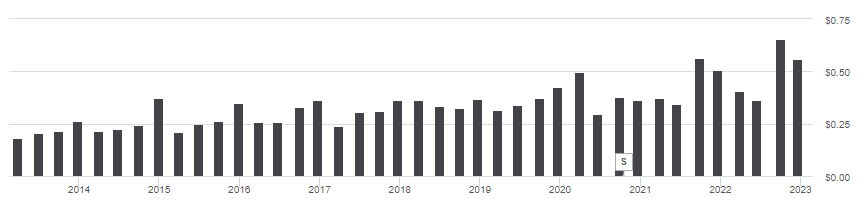
Payouts have shown a 10%+ growth rate over the past 3- and 5-year periods, with the 10-year CAGR just under 9%; easily beating inflation over each of those periods. This has earned IJJ an “A+” rating from the Seeking Alpha Quant ratings.
seekingalpha.com IJJ scorecard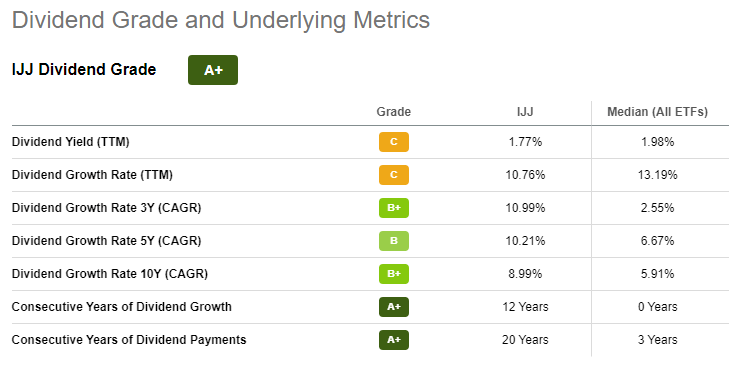
ETF comparison
Using Fidelity.com, I collected these equity factors.
Fidelity.com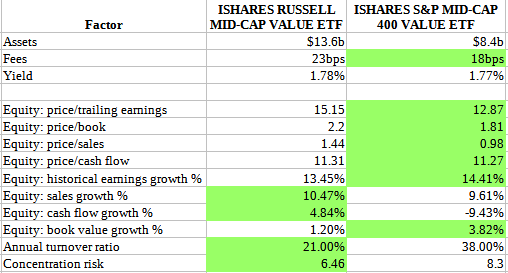
I marked in Green the ETF with what I deem the better factor value. I always find it interesting that two ETFs following the same strategy own so many non-overlapping stocks. That shows the importance of understanding the index used.
ETFRC.com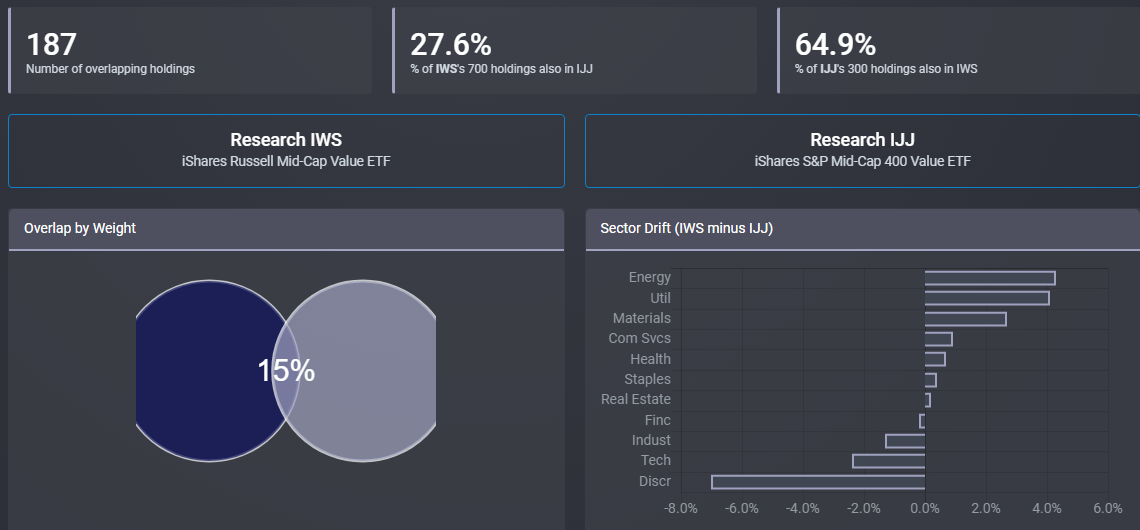
The next chart shows return and risk data for both ETFs.
PortolioVisualizer.com
The results are so close that the final decision on which, if either, to hold might simply be the manager or the index used.
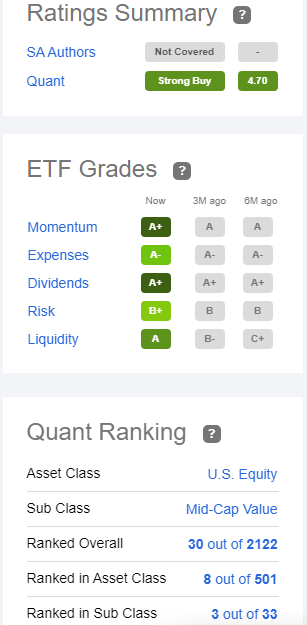
Seeking Alpha grades and ranks each US ETF on multiple factors. The sub-class ranking clearly favors the IJJ ETF over the IWS ETF.
seekingalpha.com IWS homepage seekingalpha.com IJJ homepage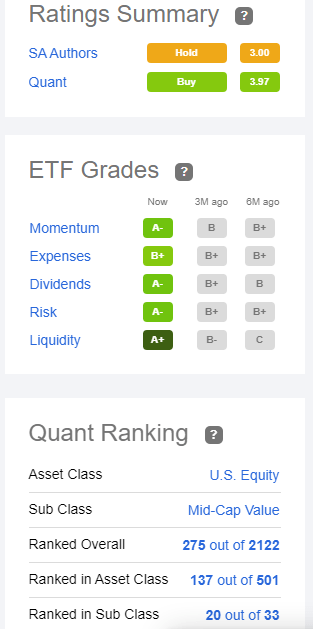
Portfolio strategy
Picking between Value and Growth funds is a popular topic on Seeking Alpha and other investment sites. I last tackled that question two years ago: Pondering Growth Vs. Value. That article used data from 1995 to early 2021, and there both Mid-Cap styles showed the same CAGR and trailed Large-Cap Growth stocks. Looking at just 2022 data, the year we all want to forget, Value stocks held up much better than Growth stocks, though Mid-Cap was not the best.
PortolioVisualizer.com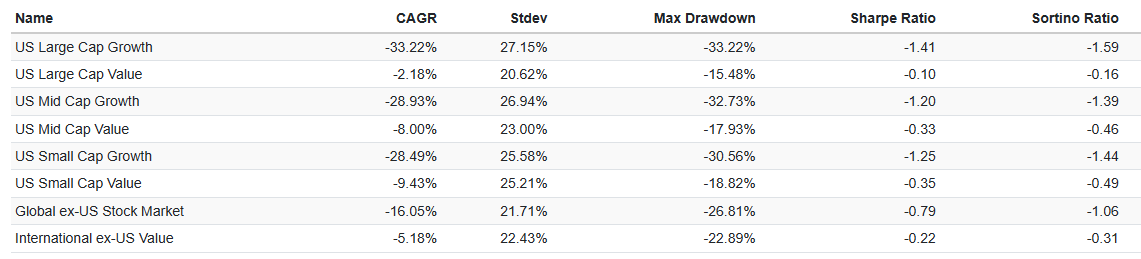
The point is that there is no one asset-class that is always the top performer. Or as the common proverb says: “Do not put all your eggs in one basket”. Translation for investors: some diversification is a good thing.
Besides Growth/Value, there are also Mid-Cap ETFs that use other factors. Two popular ones are:
- WisdomTree MidCap Dividend ETF (DON), with its dividend focus
- WisdomTree U.S. MidCap Fund (EZM), which has an earnings focus
I cover both here: WisdomTree Offers 2 Mid-Cap ETFs With EZM Besting DON.
PortolioVisualizer.com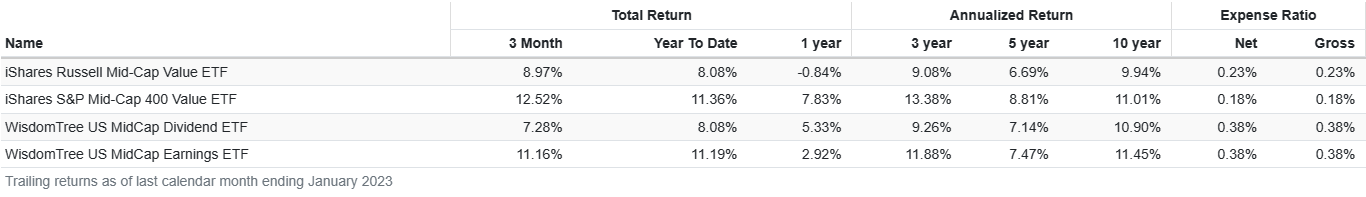
Since 2007, the EZM ETF has the best returns, but the IJJ ETF has the best over the past five. One ETF site listed over 60 ETFs that invest somewhere in the Mid-Cap space.
Be the first to comment