


chaofann
Investment Thesis
The iShares Russell 2000 Growth ETF (NYSEARCA:IWO) has lagged the iShares Russell 2000 Value ETF (IWN) by 32% since January 2021. Much of this underperformance is due to the fund’s composition, which is unlikely to change anytime soon. Overweighted companies are either pre-revenue, such as those in the Biotechnology industry, or overpriced ones in the Application and Systems Software industries. IWO currently trades at 25x forward earnings, but that figure doesn’t include the one-third of companies that didn’t turn a profit over the last year. Absent signs of positive risk-on sentiment, I don’t recommend investors buy IWO today.
However, this article will identify industries that stand out on profitability, valuation, and growth potential. Although they have negligible weightings in a broad-based ETF like IWO, I’ll suggest other related ETFs that could be better alternatives in this uncertain market.
ETF Overview
Strategy and Sector Exposures
IWO tracks the Russell 2000 Growth Index, which seeks to measure the performance of the small-cap growth segment of the U.S. equity market. The Index selects stocks with higher price-book ratios, higher two-year consensus sales and earnings growth forecasts, and higher five-year historical sales per share growth. The Index reconstitutes annually, and interested readers are encouraged to download the latest fact sheet provided by FTSE Russell for more information. Please note that the Vanguard Russell 2000 Growth ETF (VTWG) offers essentially the same product as IWO but with a cheaper expense ratio (0.15% vs. 0.23%).
With over 1,100 holdings, an analysis of IWO’s top holdings isn’t helpful, given the first 25 total just 12.18% of the ETF. Instead, let’s take a broader view by looking at its sector exposures.
Morningstar
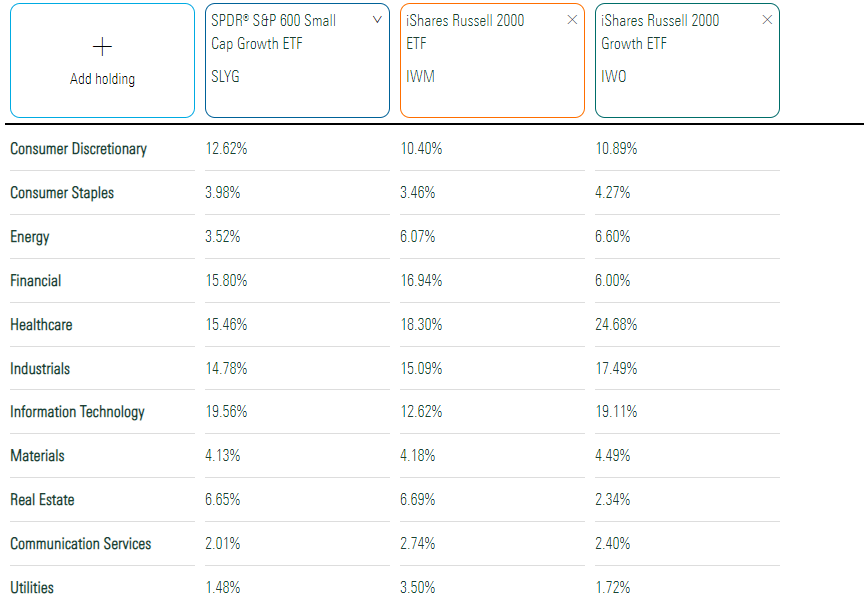
This table includes sector exposures for the SPDR S&P 600 Small Cap Growth ETF (SLYG) and the iShares Russell 2000 ETF (IWM). SYLG draws from a much smaller universe of 600 companies and, therefore, is more focused and likely to hold more profitable companies. Relative to SLYG, IWO overweights Health Care by 9.22% and underweights Financials by 9.80%.
Performance
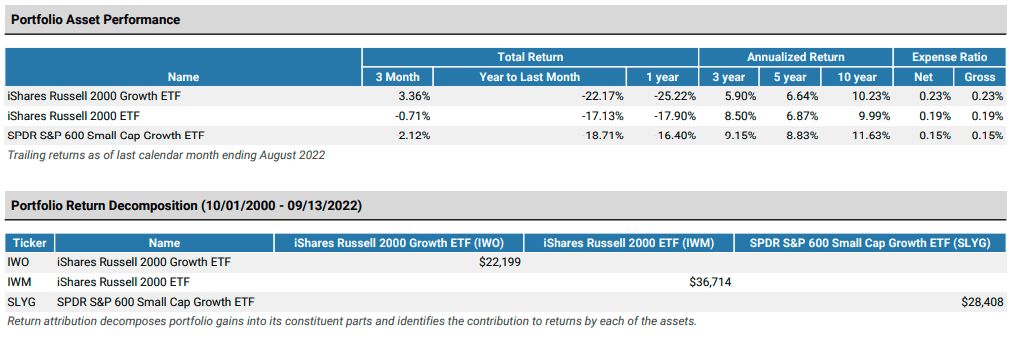
The table below shows how IWO gained an annualized 10.23% over the last ten years compared to 9.99% and 11.63% for IWM and SLYG. IWM also lagged SLYG in the previous three and five years by 3.25% and 2.19%.
Portfolio Visualizer
From October 2000 to August 2022, a $10,000 investment in IWO would turn into $22,199 compared to $36,714 and $28,408 for IWM and SLYG. In 2020, IWO outperformed SLYG by 15.20%, but lagged by 19.64% in 2021, illustrating how quickly market sentiment turned negative. YTD, IWO is behind 2.45%.
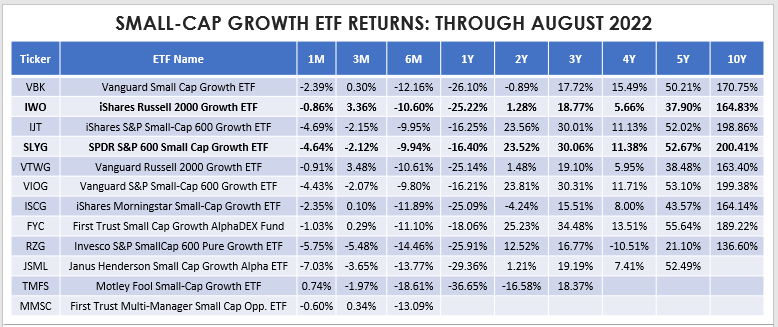
The following table summarizes periodic returns for all 12 small-cap growth ETFs I track. IWO is the second-largest by assets under management, and you can see that it’s underperformed the Vanguard Small Cap Growth ETF (VBK) over the last five and ten years. I believe the longer your time horizon, the less attractive IWO is because of the added exposure to speculative stocks.
The Sunday Investor
Fundamental Snapshot By Industry
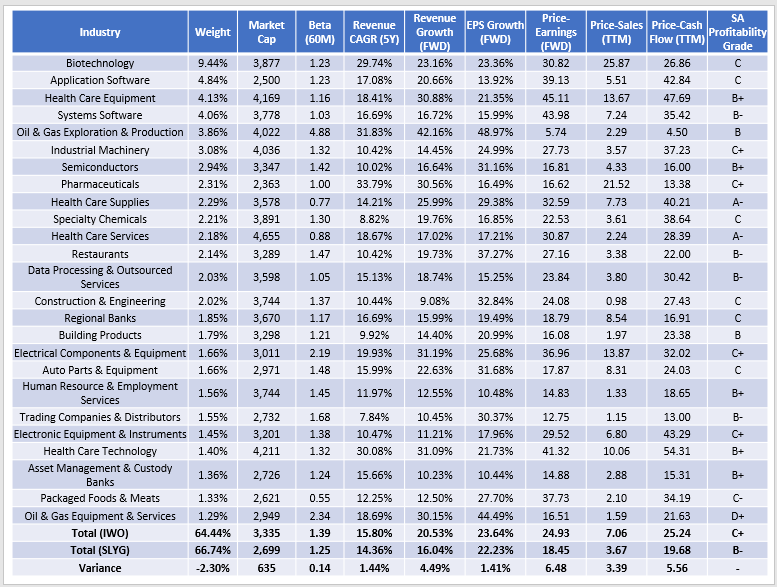
Finally, the following table summarizes IWO’s fundamentals for its top 25 industries, which total 64.44%. 111 Biotechnology stocks comprise 9.44%, and all but 12 reported negative EPS last quarter. This statistic flows through to Seeking Alpha’s Profitability Grade of C+, slightly behind SLYG’s B- Grade.
The Sunday Investor
Despite IWO’s larger number of holdings, its concentration in these top 25 industries is about the same as SLYG and tilts marginally higher on market capitalization. However, IWO is more volatile, as measured by its 1.39 five-year beta. Also, analysts expect better sales and earnings growth over the next twelve months (4.49% and 1.41%), but this added growth comes at a steep price. IWO trades at 24.93x forward earnings compared to 18.45x for SLYG. It’s also more expensive on a trailing sales and cash flow basis.
I believe a turnaround in market sentiment is necessary for IWO to be investable. I don’t see signs for that, so I can’t recommend it now. However, that doesn’t mean there aren’t opportunities. Let’s take a closer look at some exciting potential buys next.
Industry Standouts
IWO has exposure to 132 GICS industries, but ten stand out for their superior profitability, valuation, growth potential, and in some cases, all of the above. I calculated median values for the following metrics to help us find the best small-cap growth opportunities.
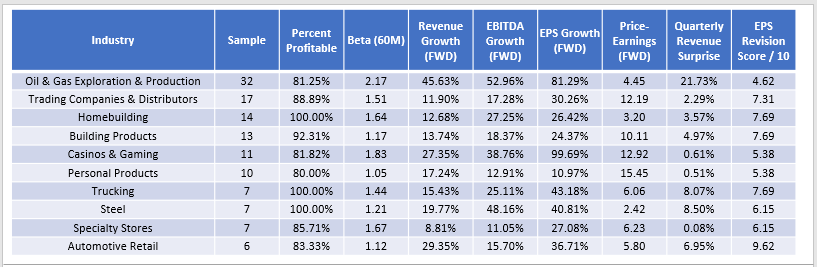
The Sunday Investor
First, notice how all have at least 80% profitable companies. For me, it’s a crucial screen because it provides a much-needed buffer in this uncertain market. There’s also a wide range of volatility you can select from, depending on your risk tolerance. Oil & Gas E&P stocks are the most volatile and dependent on higher oil prices, while Personal Products companies are generally safer.
This next section goes into more detail on the first five, including metrics for each company. I will also suggest some ETFs you can research that hold these industries in the highest concentrations.
Oil & Gas Exploration & Production
Small-cap E&P stocks are among the most volatile but arguably are some of the best inflation hedges you can own. Revenue, EBITDA, and EPS growth estimates are around 50% or better, and the median forward price-earnings ratio is only 4.45. Analysts have downgraded earnings projections recently, as indicated by the poor EPS Revision Score of 4.52. However, the last quarterly revenue surprises were 21.73%. Yardeni Research also reported a 30.50% surprise for the S&P 600 Energy sector in the previous quarter.
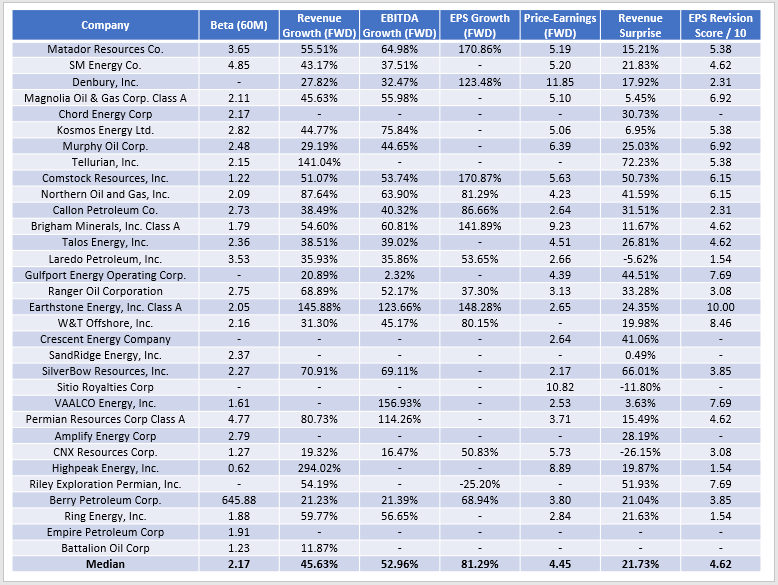
The Sunday Investor
Three ETFs have approximately 30% exposure to these 32 companies:
- Invesco Dynamic Energy Exploration & Production ETF (PXE)
- SPDR S&P Oil & Gas Exploration & Production ETF (XOP)
- Invesco DWA Energy Momentum ETF (PXI)
It’s no surprise that these three ETFs are trouncing IWO YTD. PXE has emerged as the leader, and this 30-stock fund has been the best-performing Energy ETF over the last year.
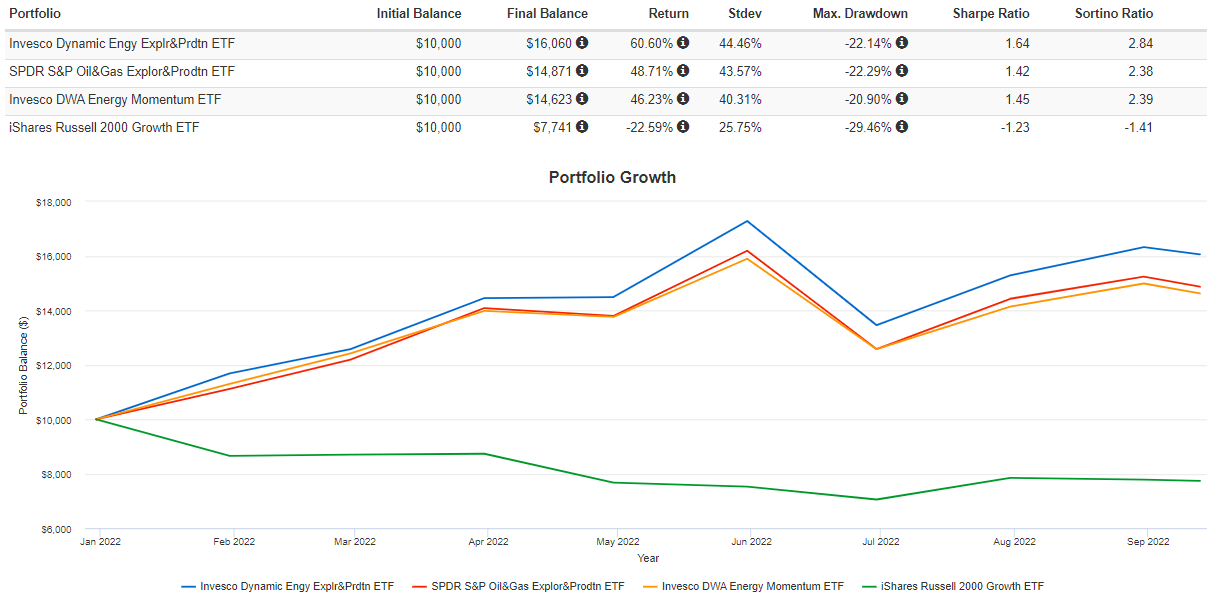
Portfolio Visualizer
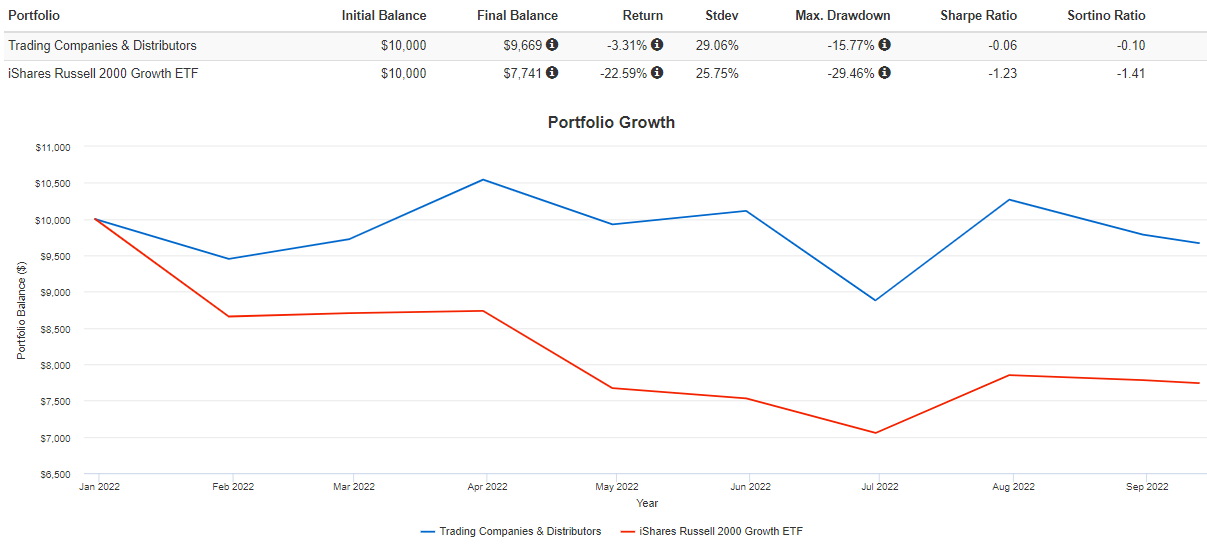
Trading Companies & Distributors
Fastenal (FAST) and W.W. Grainger (GWW) are the two largest industrials distributors by market capitalization, but analysts are only expecting about 10% sales growth over the next year. As an alternative, investors can turn to higher-growth companies in the small-cap space. Most are riskier but have double-digit estimated sales growth and, as a group, approximately 30% estimated earnings growth. Nearly all trade below 20x forward earnings and performed above expectations last quarter.

The Sunday Investor
An equal-weighted portfolio of these stocks, rebalanced monthly, lost just 3.31% YTD against 22.59% for IWO. They’ve likely benefited most from having a low 12.19 forward price-earnings ratio, but many should also rise in a bull market due to their strong growth rates.
Portfolio Visualizer
Unfortunately, not many ETFs have these stocks in high concentrations. The Invesco S&P SmallCap Industrials ETF (PSCI) is your best bet with a 7% total exposure. Next is KFA Small Cap Quality Dividend Index ETF (KSCD) at 6%, but this is a challenging industry to target efficiently with ETFs.
Homebuilding
Homebuilding is an excellent way to differentiate your portfolio, but you only get 0.77% total exposure with IWO. Many appear well-priced, but they’re a volatile group with only a 12.68% estimated sales growth rate.
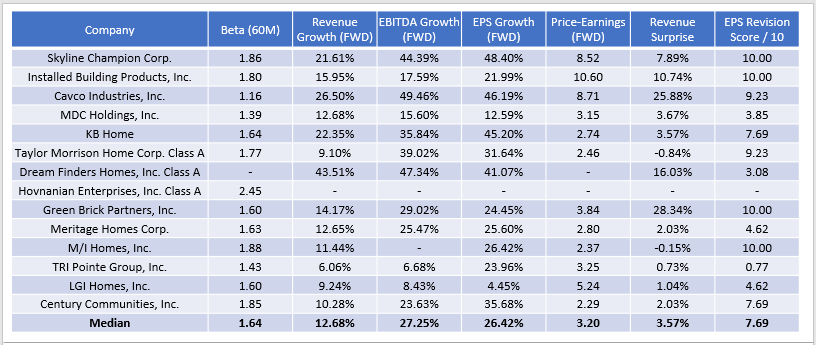
The Sunday Investor
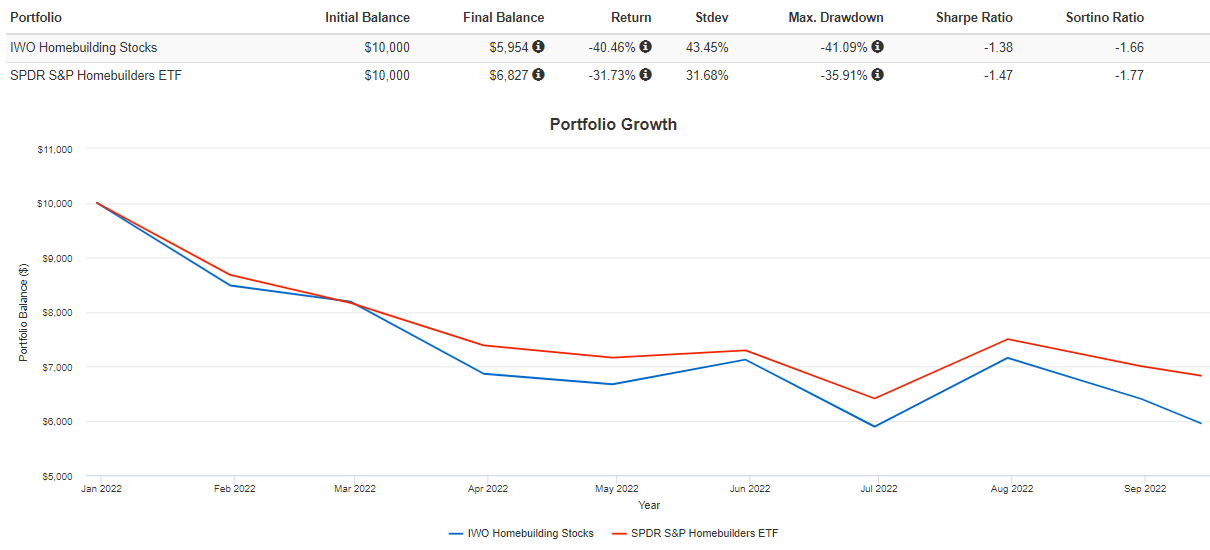
Unlike the two previously mentioned industries, homebuilding stocks are getting crushed in 2022, with these 14 companies averaging a 40.46% YTD loss against 31.73% for the SPDR S&P Homebuilders ETF (XHB).
Portfolio Visualizer
In an August report posted on the Hoya Capital Income Builder Marketplace, Hoya Capital noted how M.D.C. Holdings (MDC) trades at its steepest discount to tangible book value on record. However, there’s long-term growth potential resulting from a decade of significant under-building of single-family homes.
As for ETFs to take advantage of this, the Hoya Capital Housing ETF (HOMZ) targets a 30% exposure to Homebuilding and Construction companies and has a 9% total exposure to the above companies. For more exposure, investors can get 21% with the Invesco Dynamic Building & Construction ETF (PKB) and 16% with the iShares U.S. Home Construction ETF (ITB).
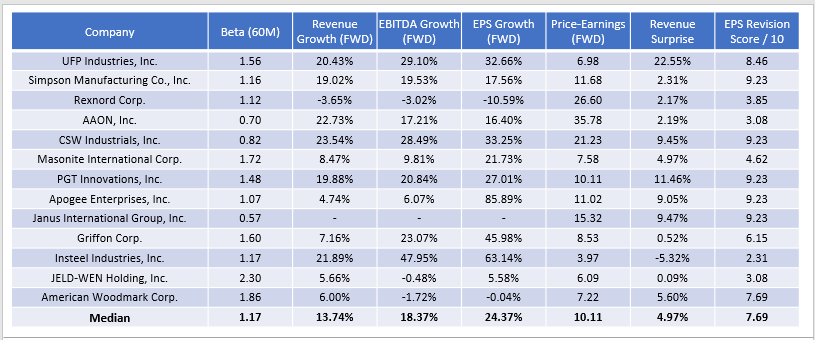
Building Products
The Building Products industry is a less risky option you may want to consider. Small-cap stocks in this industry don’t appear any more volatile than the large-cap ones in the S&P 500 Index, as their five-year betas are each around 1.20. They also have median earnings growth of 24.37% and trade at just 10.11x forward earnings.
The Sunday Investor
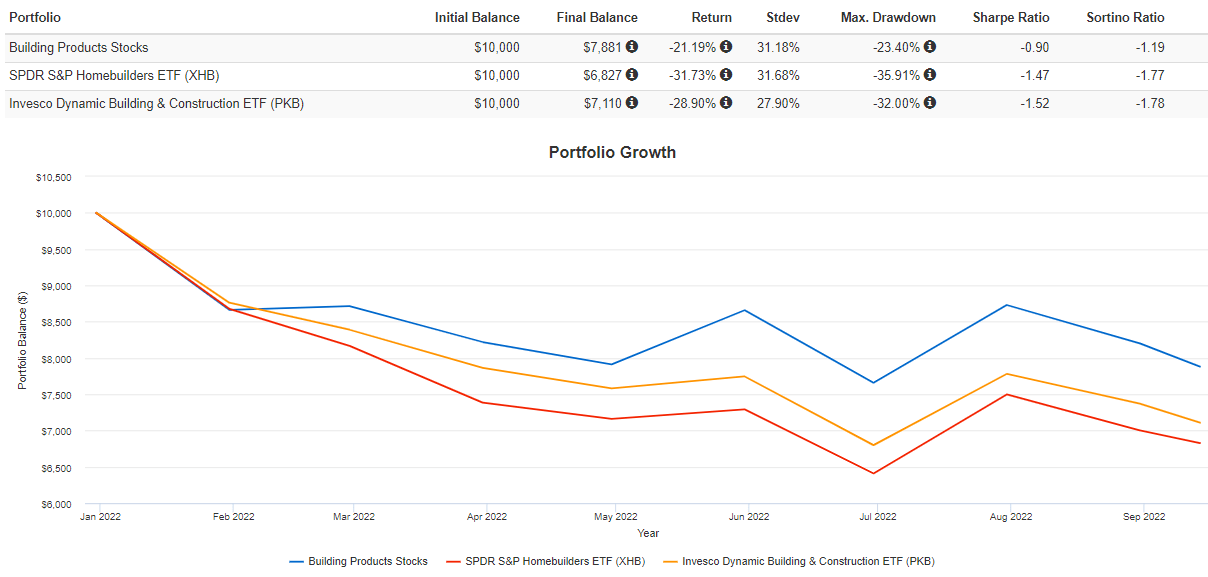
All but one of these companies had a positive sales surprise last quarter. As a result, they’ve weathered this downturn better than XHB and PBK by 10.49% and 7.71%, respectively. For maximum exposure to these specific companies, the Invesco S&P SmallCap Industrials ETF (PSCI) is your best bet at 9%.
Portfolio Visualizer
Casinos & Gambling
Finally, contrarian investors can consider the fundamentals below for IWO’s 11 Casinos & Gambling holdings. Their median five-year beta is 1.83, implying nearly twice the volatility of the broader market. Most have impressive revenue and EBITDA growth figures and trade around 13x forward earnings. However, last quarter’s sales surprises were on the low side at 0.61%, and the median EPS Revision Score of 5.38 implies negative sentiment on Wall Street. This score rivals the ARK Innovation ETF (ARKK), which I covered recently.
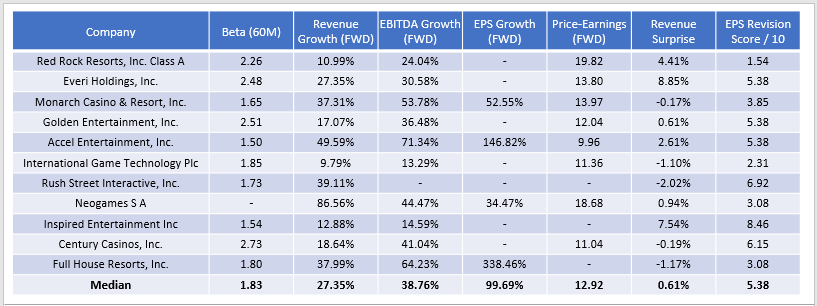
The Sunday Investor
These stocks gained 16.85% since January 2021 against a 2.76% loss for the Invesco S&P SmallCap Consumer Discretionary ETF (PSCD), so the potential is there. The Michigan Consumer Sentiment Index for September is due out Friday, with analysts expecting a boost to 60.0 from 58.2 last month. If this materializes, it should result in sizable gains for this industry.
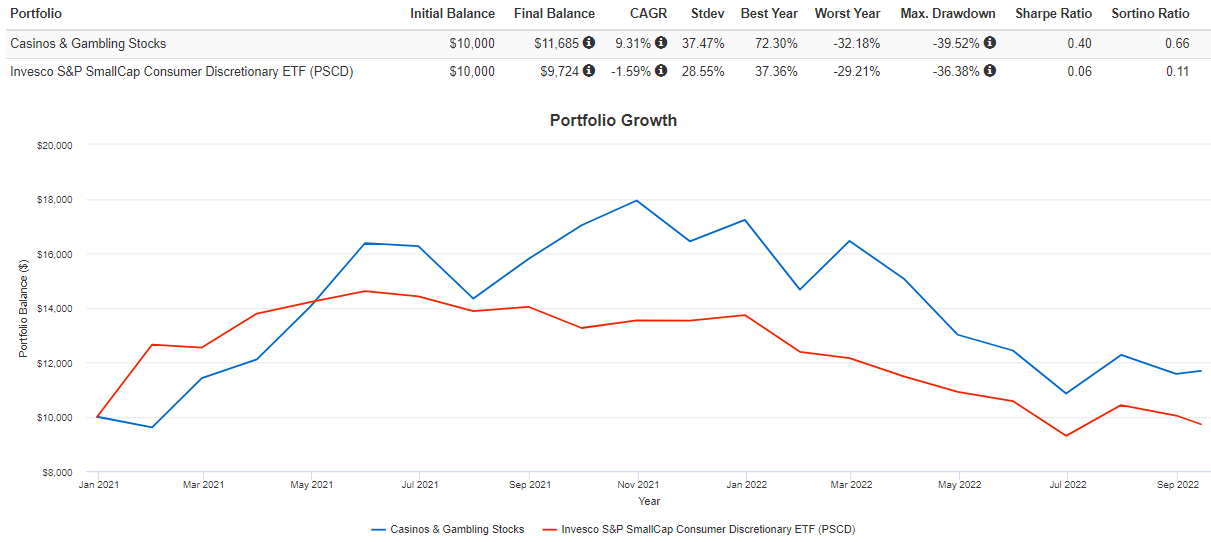
Portfolio Visualizer
Not many ETFs hold these stocks. However, the AdvisorShares Hotel ETF (BEDZ) is an interesting one to follow. I don’t recommend it, primarily because of its 0.99% expense ratio, but its constituents have the best Seeking Alpha Growth Scores out of any Consumer Discretionary ETF I track. It’s also the best performer over the last year through August, losing 8.95% compared to the average 21.82% loss for 15 peers.
Investment Recommendation
I don’t recommend buying IWO today because of its elevated valuation and investors’ overall bearish sentiment. One-third of companies in the Index aren’t profitable over the last year, and I think it just makes more sense to emphasize profitability over the long run. This viewpoint aligns with IWO’s ten-year returns, as they’ve significantly lagged SLYG, a more profitable fund.
However, there may be some calculated risks worth taking via other ETFs. This article identified Oil & Gas E&P, Trading Companies & Distributors, Homebuilding, Building Products, and Casinos & Gaming companies that typically are profitable, have high growth potential, and trade at reasonable valuations. I hope you can use some of the information in this article to your advantage, and if you’d like to learn more about any of the ETFs mentioned in this article, please feel free to comment below.
Be the first to comment