

Pgiam/iStock via Getty Images
Investment Prospects
Several aspects of dealing with this major world health threat provide reminders of how complex treatments may become and how far our understanding has progressed of what healthcare may need in the 21st century of worldwide air travel.
Beside biological technology advances fortunately there have been advances in information technology which lets investors keep up with the pace of evolution surrounding us. Now we need to know why prices are being paid for securities today, in terms of what is being expected in the foreseeable future.
Fortunately securities now are being traded in parallel markets where expectations of coming prices are the primary interest rather than current prices being justified by past corporate activities and market outcomes. Prices yet to come are what is being bet on directly there, rather than simply representing ill-defined hopes of what prices might be seen at some future date.
Those derivatives markets encourage more rational, measurable and justifiable forecast time horizons than do equity markets. While this kind of behavioral analysis allows us to have more reliable future expectations they must be of shorter time periods and have more frequent updating.
Here is today’s look at the most directly involved stocks and how their prices may move over the next 3-5 months. One big plus is that greater frequency of capital commitments allows compounding to build up the outcomes.
Risk-Reward Trade-offs of Covid-19 Healthcare Stocks
Figure 1
blockdeak.com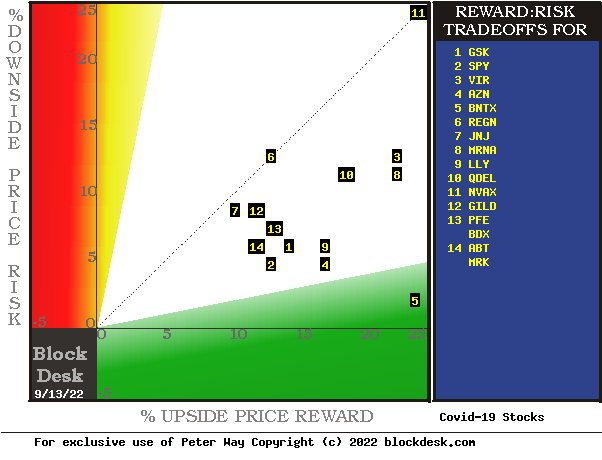
(used with permission)
Expected rewards for these securities are the greatest gains from current closing market prices seen worth protecting short positions. Their measure is on the horizontal green scale.
The risk dimension is of actual price draw-downs at their most extreme point while being held in previous pursuit of upside rewards similar to the ones currently being seen. They are measured on the red vertical scale.
Both scales are of percent change from zero to 25%. Any stock or ETF whose present risk exposure exceeds its reward prospect will be above the dotted diagonal line. Capital-gain attractive to-buy issues are in the directions down and to the right.
Our principal interest is drawn to BioNTech SE (BNTX) at location [5], because of its favorable separation from the rest of the group. Details of the table in Figure 2 will help explain why this is less helpful.
The higher risk exposure of Moderna (NASDAQ:MRNA) at [8] over Eli Lilly (LLY) at [9] shows up more clearly as reward payoff in Figure 2. A “market index” norm of reward~risk tradeoffs is offered by SPY at [2].
Comparing features of Alternative Investments
The current-day forecast tradeoffs in Figure 1 are used as historical samples to create behavior norms of the past representative of today’s situation.
Figure 2
blockdesk.com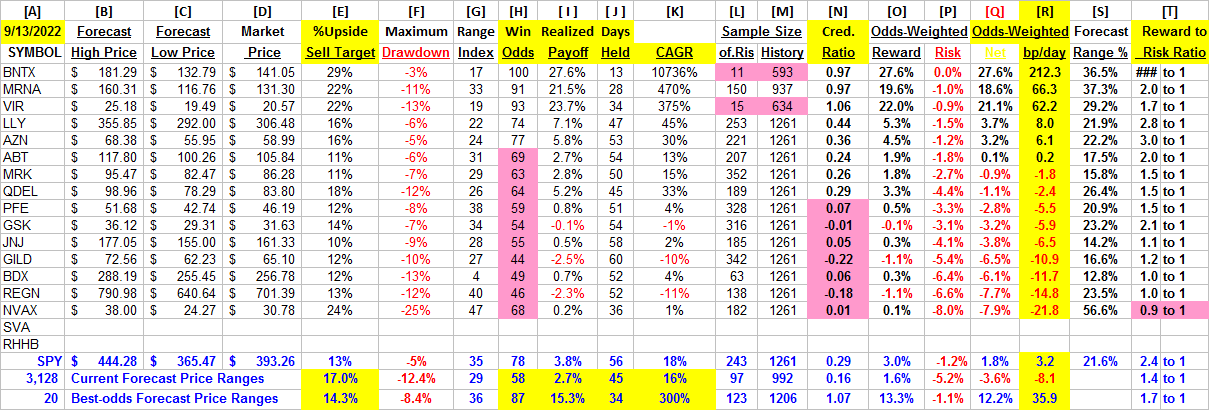
(used with permission)
The price ranges implied by the day’s transactions activity are in columns [B] and [C], typically surrounding the day’s closing price [D]. They produce a measure of risk and reward we label the Range Index [G], the percentage of the B to C forecast range which lays between D and C.
Today’s Gs are used for each stock’s past 5-years of daily forecast history [M] to count and average prior [L] experiences. Fewer than 20 of Gs or a shorter history of Ms are regarded as statistically inadequate.
[H] tells what percentage of the L positions were completed profitably, either at range-top prices or by market close above day after forecast close price entry costs. The Net realization of all Ls is shown in [ I ].
[ I ] fractions get weighted by H and 100-H in [O, P, & Q] appropriately conditioned by [J] to provide investment ranking [R] in CAGR units of basis points per day.
The pink cell highlighting provides fatal investment evaluation conditions for several candidates, occasionally including the market-index ETF SPY. Additional market perspective is provided by the 3,000+ securities for which price range forecasts are available. They currently suggest that while market recovery is under way, it is still far from generally attractive.
On the other hand, R column scores for MRNA and the top 20 forecast population support the primary candidate’s competitive capability and notes the presence of several other demonstrated prospects.
Recent Trends of Price Range Forecasts for MRNA
Figure 3
blockdesk.com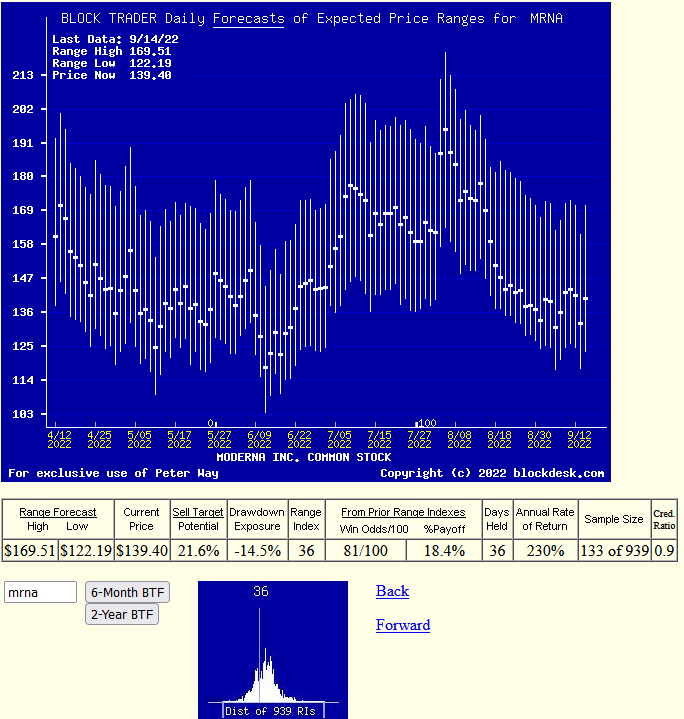
(used with permission)
This is NOT a typical “technical analysis chart” of simple historical (only) observations. Instead it pictures the daily updated Market-Maker price range forecasts implied by live real-capital commitments in real time. Its communicative value is present here by visual comparisons at each forecast date of the proportions of upside and downside price change expectations by the market-making community, as influenced by the actions of an interested and involved big-$ institutional investing community.
Those forecasts are typically resolved in time horizons of less than a half year, and often in two months or shorter. This one states that of the 133 prior forecasts like today’s, most were completed in 36 market-days (7 weeks) profitably at average +18.6% profits, a CAGR rate of +230%. No promises, just fun with history.
Conclusion
Comparison of the performances of near-term Market-Maker forecasts for Moderna, Inc. with similar forecasts of other Covad-19 Involved stocks, it seems clear that this stock can be an attractive investment choice for investors pursuing near-term capital gain strategies.
Be the first to comment