

JLGutierrez
As Wayne Gretzky famously said, “A good hockey player plays where the puck is. A great hockey player plays where the puck is going to be.” A good investor may hold what the mainstream media says are “the best investments to beat inflation.” However, a great investor is investing for the next phase of the cycle.
What the ‘Magazine Cover Indicator’ Is Telling Us Now
The magazine cover indicator is a non-traditional contrarian indicator that says the cover stories in mainstream media often signal economic turning points. Perhaps the most famous example is the 1979 BusinessWeek cover that declared “the death of equities.” However, stocks went on to enter a bull market for most of the following 20 years.
Although the magazine cover indicator isn’t always accurate, the idea that the media generally covers economic conditions that have nearly run their course is accurate. Similarly, by the time the Fed (or NBER) declares a recession, the economic conditions they are reporting have already been priced into investment securities.
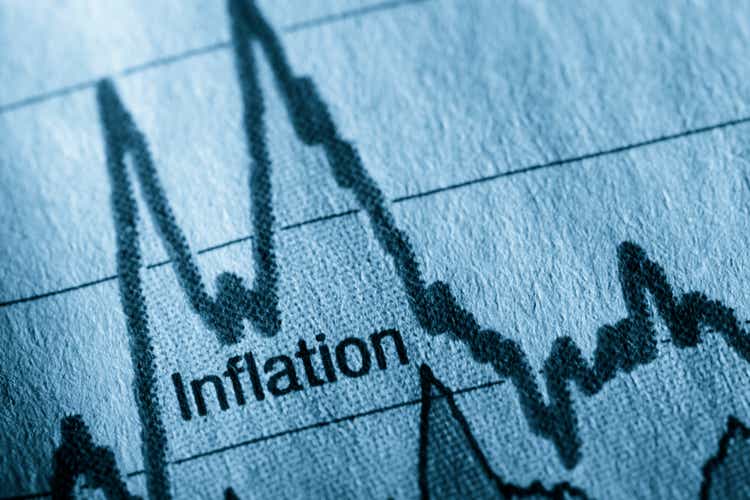
Today, the lead stories for mainstream media are inflation and rising interest rates. Following the Gretzky hockey metaphor, the media are skating where the puck is now, but smart investors are skating where they think the puck will be next. To fit the Fed into this metaphor, they’re reporting on stats from past hockey games.
Inflation Investments vs Major Market Indices
According to mainstream media, the best investments for inflation are TIPS, gold, commodities, real estate, and short-term bonds. The tide has begun to turn against the inflation play for investors and recent performance for market indices provides evidence.
Although these investments have mostly been a smart alternative holding to the S&P 500 year-to-date in 2022, July performance suggests a different story for the second half and into 2023:
| ETF Name | July Return | YTD Return |
| iShares TIPS Bond ETF (TIP) | 4.30% | -5.12% |
| SPDR Gold Shares (GLD) | -2.59% | -4.01% |
| Invesco DB Commodity Index Tracking ETF (DBC) | -1.99% | 25.65% |
| Vanguard Real Estate ETF (VNQ) | 8.62% | -13.69% |
| Vanguard Short-Term Bond ETF (BSV) | 1.01% | -3.56% |
| SPDR S&P 500 ETF (SPY) | 9.21% | -12.62% |
| iShares Core U.S. Aggregate Bond (AGG) | 2.54% | -7.88% |
Key takeaways from the table above are:
- The S&P 500 outperformed every traditional inflation hedge in July.
- Price appreciation for the broad bond market, as measured by AGG, was more than double that of short-term bonds, as measured by BSV.
- Gold and commodities, as measured by GLD and DBC respectively, have been a strong inflation hedge year-to-date but were negative in July. Lower commodities can be interpreted as an indicator of softer demand and relief in inflation pressures.
- Real estate is an outlier with a healthy gain of 8.62% in July, reflecting a strong summer housing market. However, looking ahead, higher rates will decrease property valuations and increase borrowing costs for REITs.
- Treasury inflation-protected securities, or TIPS, outperformed AGG in July. However, this outperformance is mostly supported by the 9.1% inflation reading in mid-July. An investment in TIPS today is a bet that inflation will remain at this level or go higher.
Economic Indicators Point Toward a Slower Economy
The June 2022 CPI reading, which was reported on July 13, was extremely high at 9.1%. The July 2022 reading, which is scheduled for August 10, is likely to reflect falling gas prices, loosening supply bottlenecks, and a cooler housing market. Inflation will still be high in July but will almost certainly be lower than June.
Here’s an updated summary of points made in my recent article, The Case for Bonds Now, that point toward a slowing economy:
- Gas prices: The average price for one gallon of regular gas at the end of July was $4.21, down from its June 14 peak of $5.01.
- Manufacturers’ delivery time shortening: The June Manufacturing PMI was 53%, which was the lowest PMI reading since June 2020.
- Housing: Inventories were rising in June, which marked the largest monthly increase in the data’s history. July data will reflect this shift.
- Yield curve inversion: The 10-2 Treasury yield spread returned to negative in July. Every recession since WWII has been preceded by an inverted yield curve, by 6 to 18 months.
- GDP: Real gross domestic product decreased at an annual rate of 1.6 percent in the first quarter of 2022, followed by another decrease of 0.9% in Q2.
Bottom Line
Have we seen the end of hyperinflation? Probably not. Have we seen the worst of hyperinflation? Recent economic indicators and performance of benchmark ETFs point to a strong maybe. What does this mean? While holding traditional investments for inflation can be wise for a diversified portfolio, the time to buy new shares of these investments has likely passed.
Be the first to comment