

Oselote
Silver has traded at deeply undervalued levels over the past year, pressured by the combination of slowing global growth and tightening monetary conditions. In the past few months, however, the white metal has managed to hold its own despite weakness in the commodity complex and continued increases in real interest rates. It looks increasingly likely that all the bad news is priced in and the outperformance of the silver mining sector is reminiscent of the major lows seen in 2016 and 2020. Any shift to a more dovish monetary policy stance by the Fed could see the metal surge, and such a shift looks likely to come sooner rather than later. I have recently added to my positions in the iShares Silver Trust ETF (NYSEARCA:SLV).
The SLV ETF
The SLV ETF has tracked the spot price with a median 12-month tracking error of just 0.48%, and should continue to offer investors direct exposure to the metal. With an expense fee of 0.50%, this is far lower than the spreads on buying the physical metal. SLV is the largest and most liquid silver ETF, but has a slightly higher expense ratio relative to others such as the Aberdeen Standard Physical Silver Shares ETF (SIVR). Inflows into the SLV have recovered slightly since their September lows, at which point total assets under management were down 30% from the Reddit-driven spike of February 2021.
SLV Price Vs Market Cap (Bloomberg)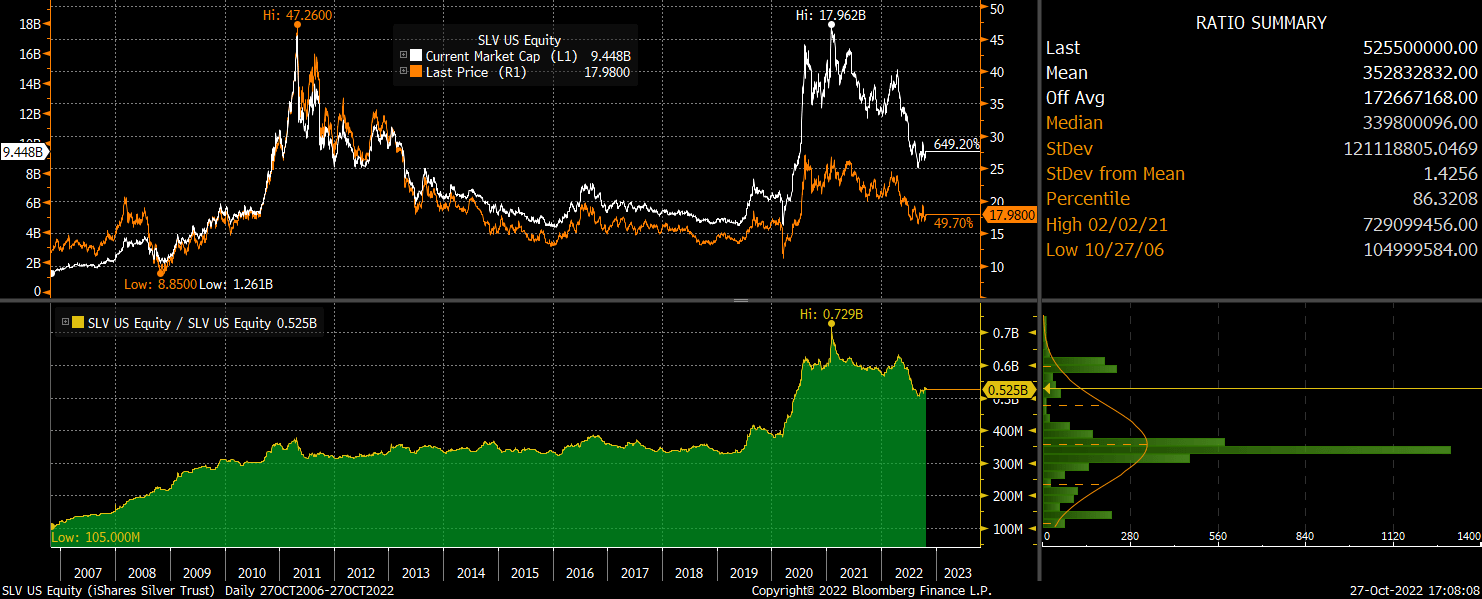
Valuations Remain Incredibly Cheap
Since my last update on the SLV in early September, the combination of falling commodity and gold prices have led to a slight deterioration in silver’s fair value, but it remains significantly higher than current prices. As the chart below shows, over the past 40 years there has been an incredibly strong correlation between the price of silver and a 50:50 basket of gold and the Bloomberg commodity index. To be sure, there has been periods when silver prices have traded far out of line with this fair value measure, but the key point to note is that periods of deep undervaluation have always given way to strong subsequent returns. Current valuations imply double-digit annual returns for silver over the next decade.
Bloomberg, Author’s calculations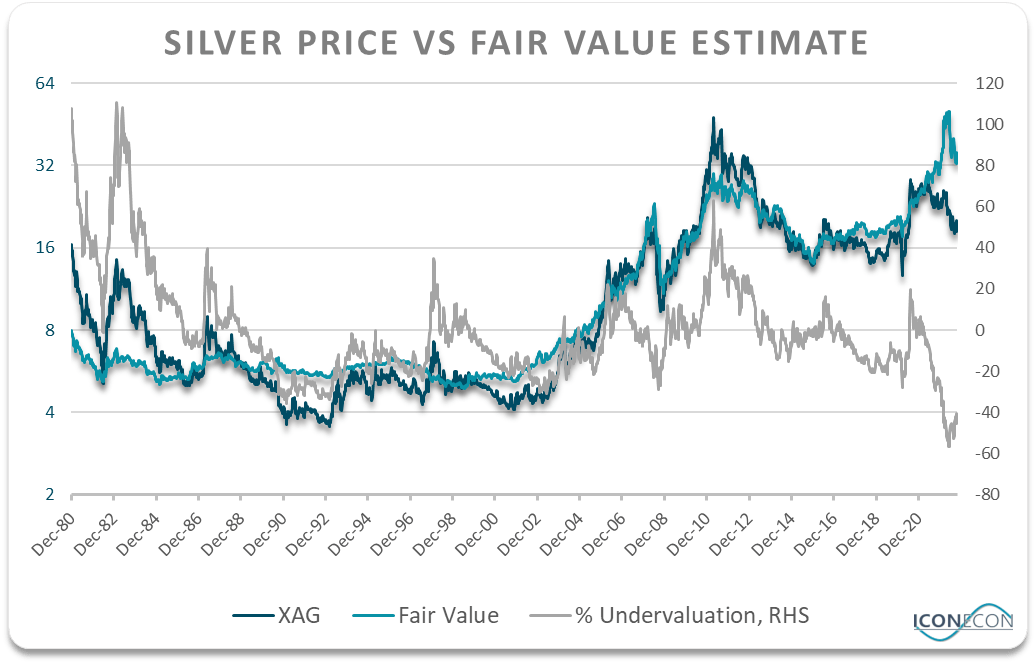
Silver Miners Are Leading The Recovery
It is often said that precious metal mining stocks tend to lead recoveries in the metals themselves, and the strong recovery seen in the Global X Silver Miners ETF (SIL) bodes well for the silver. The ETF is up over 20% since posting fresh post-Covid lows on September 27. Previous periods of outperformance in the SIL relative to the SLV which have occurred following intense underperformance have tended to mark major lows in both ETFs, as was the case in 2016 and 2020 as shown below.
Silver Price Vs Silver Mining Stocks (Bloomberg)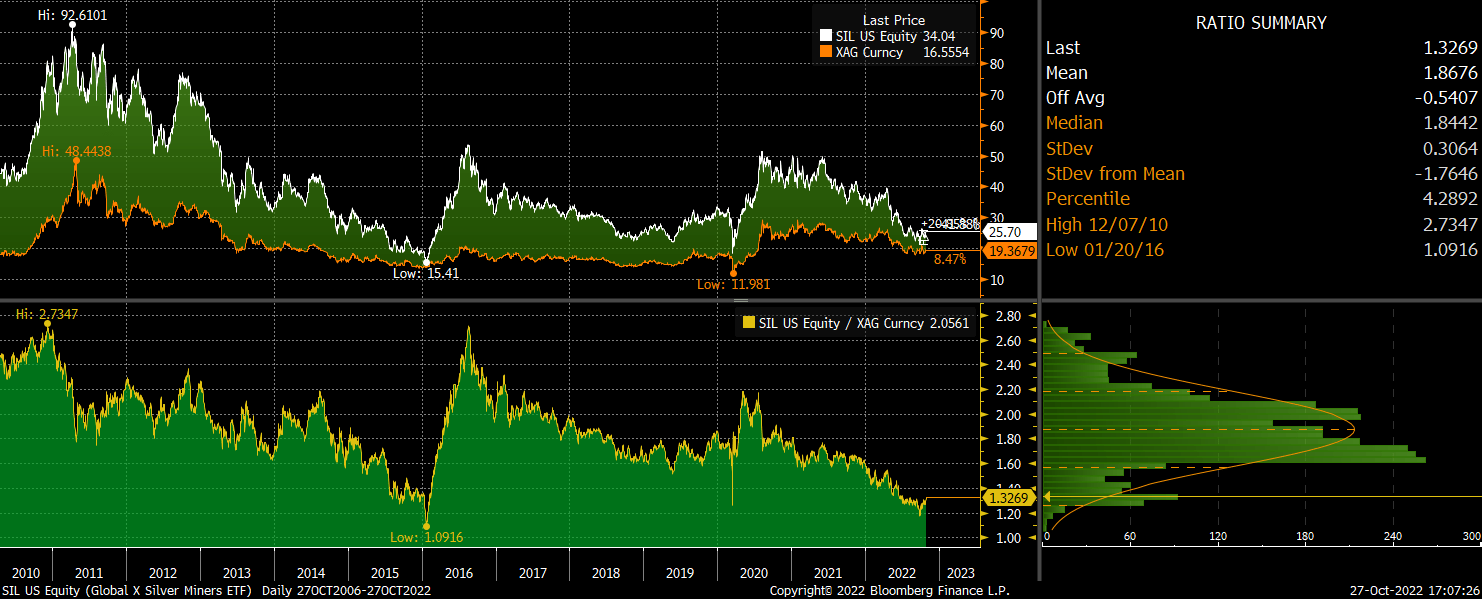
Monetary Conditions Set To Ease Significantly
As I wrote in a recent article earlier this week (see ‘Monetary Policy Is Now Dangerously Tight‘), U.S. monetary conditions are now extremely tight following the surge in yields seen since the start of the year, but it is becoming increasingly clear that the real economy cannot tolerate current high real yields. Real 30-year mortgage rates for instance, based on the Bankrate average national mortgage rate versus 30-year breakeven inflation expectations, are just a few basis points shy of the highs seen in 2008 at the height of the global financial crisis.
US 30-Year Real Mortgage Rates (Bankrate.com, Bloomberg)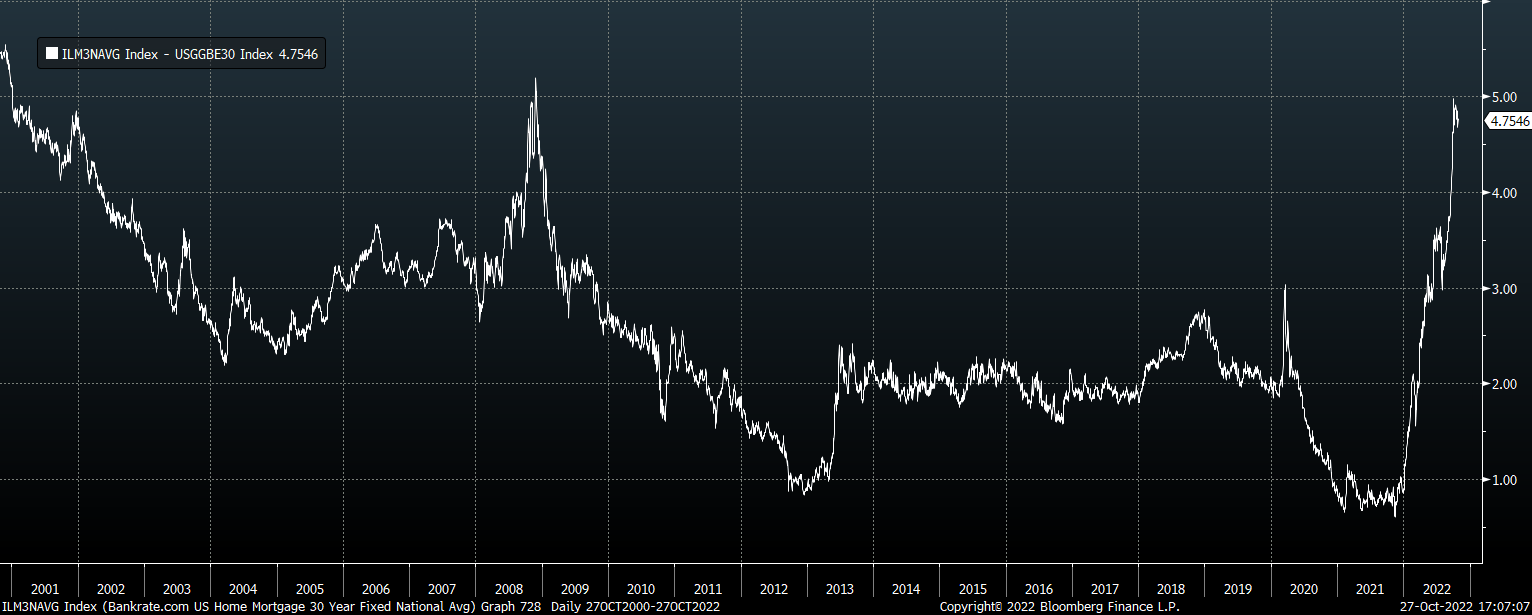
For now, the Fed remains under pressure to bring down headline inflation which has become the main political issue facing U.S. voters, but concerns are likely to shift towards falling property prices and recession. Property prices have already peaked nationally, while the Conference Board’s Leading Economic Indicator is pointing to a deepening U.S. economic contraction. It is only a matter of time before we see the Fed’s priorities shift towards preventing a financial crisis in the same way that the Bank of England capitulated to prevent a pension and mortgage crisis.
US Leading Economic Indicator (Conference Board)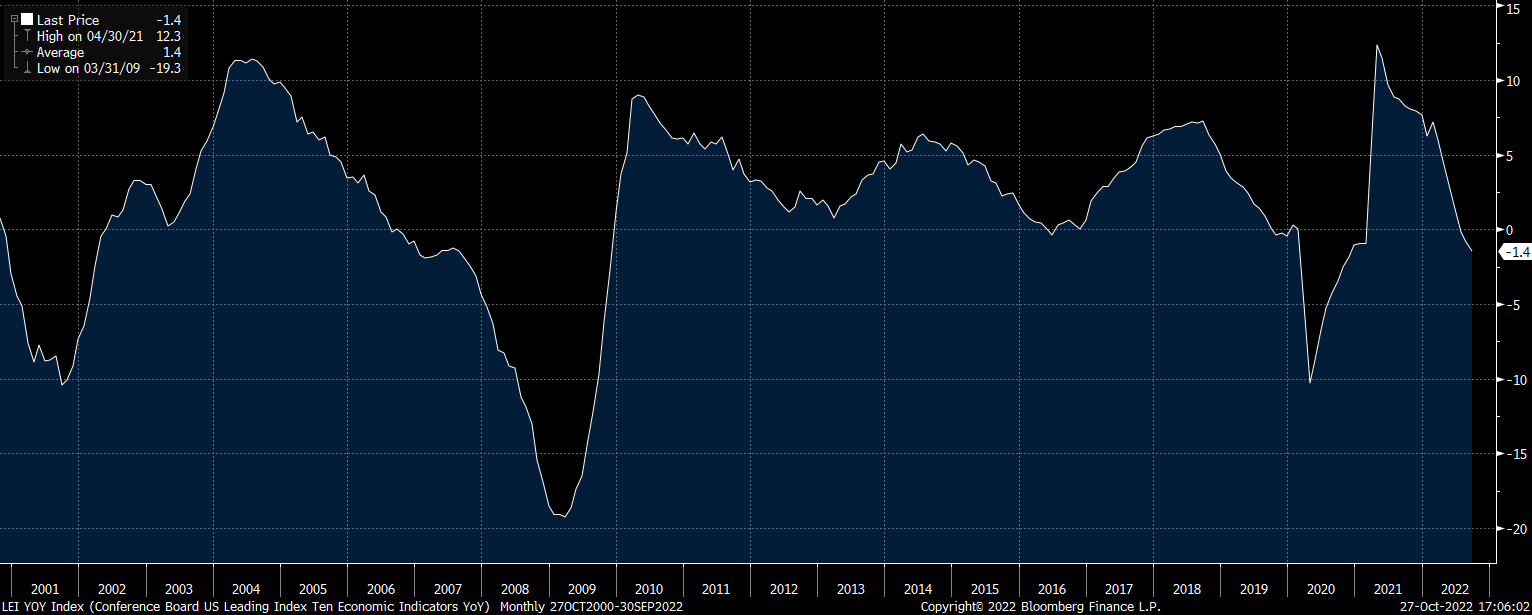
Speculative Interest Remains Negative, Which Is A Bullish Sign
Net non-commercial positioning on silver has recovered marginally since net long positions reached a multi-year low of -6% last month, but they remain historically depressed. As I argued last month, while this is not a perfect contrarian indicator, there is evidence to suggest that bearish speculative positioning tends to lead to strong subsequent returns. Of the 84 occasions when net specs have been negative over the past 30 years, the average 12-month return has been just over 12%. This compares to annual returns of 9% on all occasions. Furthermore, the maximum 12-month gain has been 82% while the maximum 12-month loss has been just 15%. Currently depressed speculative position in the silver market creates potential for a major short covering rally should we see any improvement in the fundamentals, particularly a decline in bond yields.
Net Non-Commercial Futures Positions, % of Open Interest (CFTC, Bloomberg)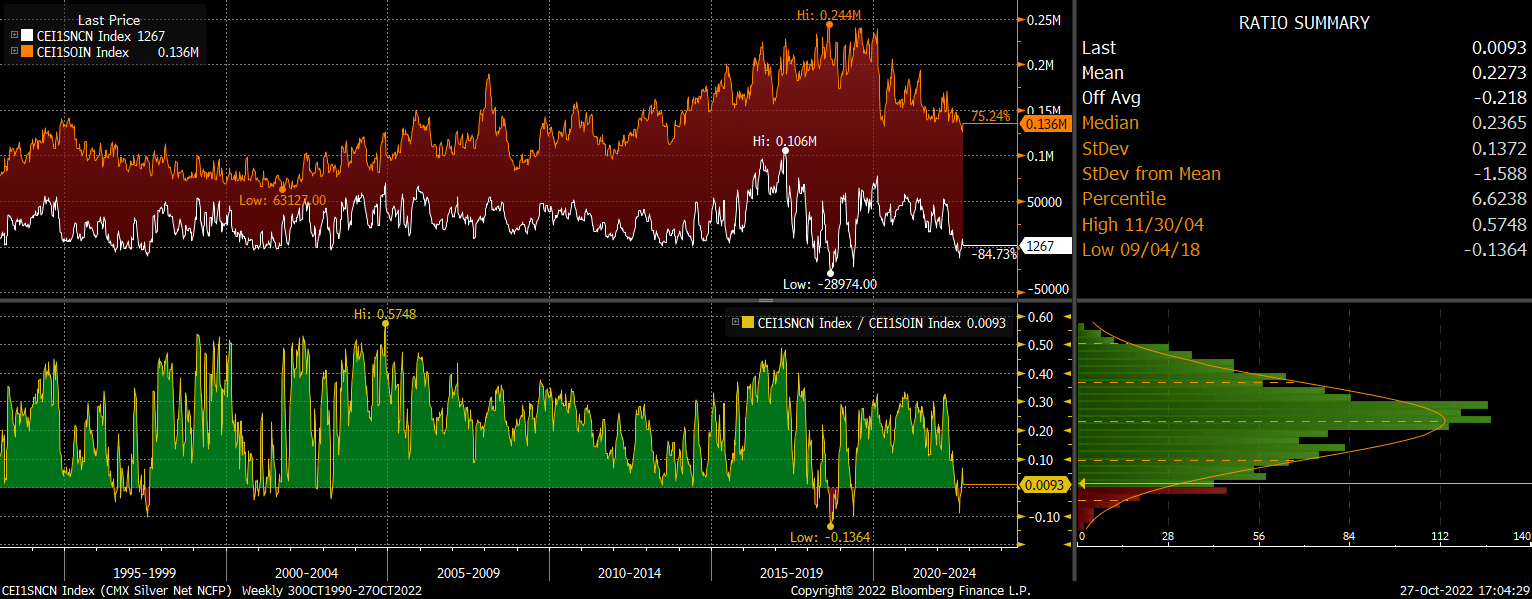
Summary
The SLV has shown some positive price action in recent weeks despite the weakness in gold and the commodity complex, while silver mining equities appear to be breaking out to the upside. In the context of the metal’s deep undervaluation and bearish speculative sentiment, these are very positive signs. Any slight easing of monetary conditions could see silver prices move aggressively higher, which would in turn see the SLV post significant gains.
Be the first to comment