

ake1150sb
Despite outstanding performance from most of the companies in the sector, it has been a tough year for Industrial REIT shares. While the average REIT as measured by the Equity REIT Index has lost (-32.64)% this year, Industrials have done even worse, at (-38.29)%.
Hoya Capital Income Builder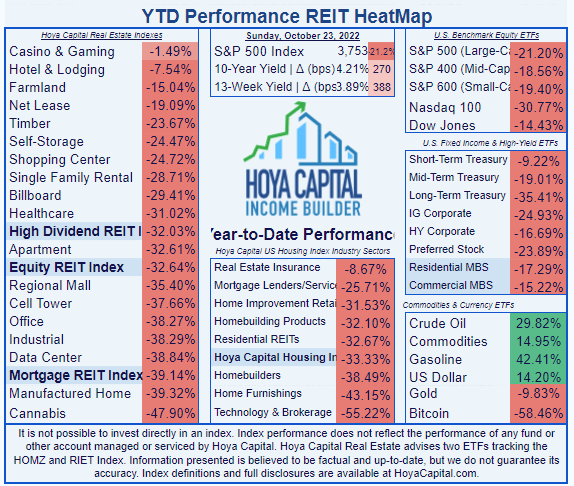
Industrial REITs are enjoying eye-popping sector average rent spreads exceeding 20%, and a record-low vacancy rate of just 2.9%, according to Hoya Capital Income Builder’s recent sector report. Demand for well-located logistics space continues to outstrip supply. The following chart summarizes the favorable supply-and-demand picture for Industrial REITs in a nutshell:
Hoya Capital Income Builder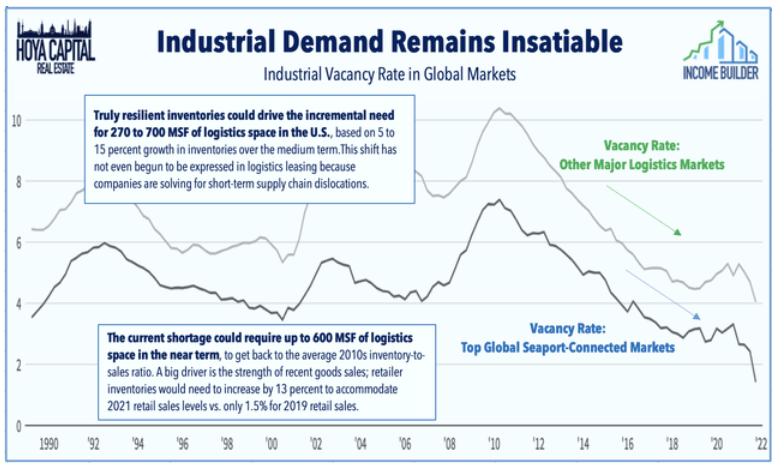
All six industrial REITs that provide NOI guidance raised their full-year growth outlook while five of the eight that provide FFO guidance raised their growth targets when reporting H1 2022 results.
EastGroup Properties (NYSE:EGP) has executed very well on their business model this year, growing FFO/share by double digits. Unappreciated by the market, yet rolling in cash, EastGroup has raised the dividend sharply this year, resulting in a more competitive yield. This industrial REIT, like several others that are usually appealing only to growth investors, has become an interesting proposition for value investors as well.
Meet the company
EastGroup Properties, Inc.
Founded in 1969, and headquartered in Jackson, Mississippi, EastGroup Properties owns and operates multi-tenant, shallow bay warehouse facilities totaling over 50 msf (million square feet), in 25 primary and secondary markets spread across 11 U.S. states. At $6.3 billion, the company sits squarely in the market cap sweet spot, the ideal size for total return.
EastGroup focuses on:
- Multi-tenant distribution properties
- In urban areas
- In major Sunbelt markets
- Infill sites in supply-constrained submarkets
- In choice last-mile e-commerce locations
- Around transportation facilities in high-growth areas.
Over 75% of the company’s square footage is concentrated in three Sunbelt states: Texas (34%), Florida (24%), and California (21%)
Company investor presentation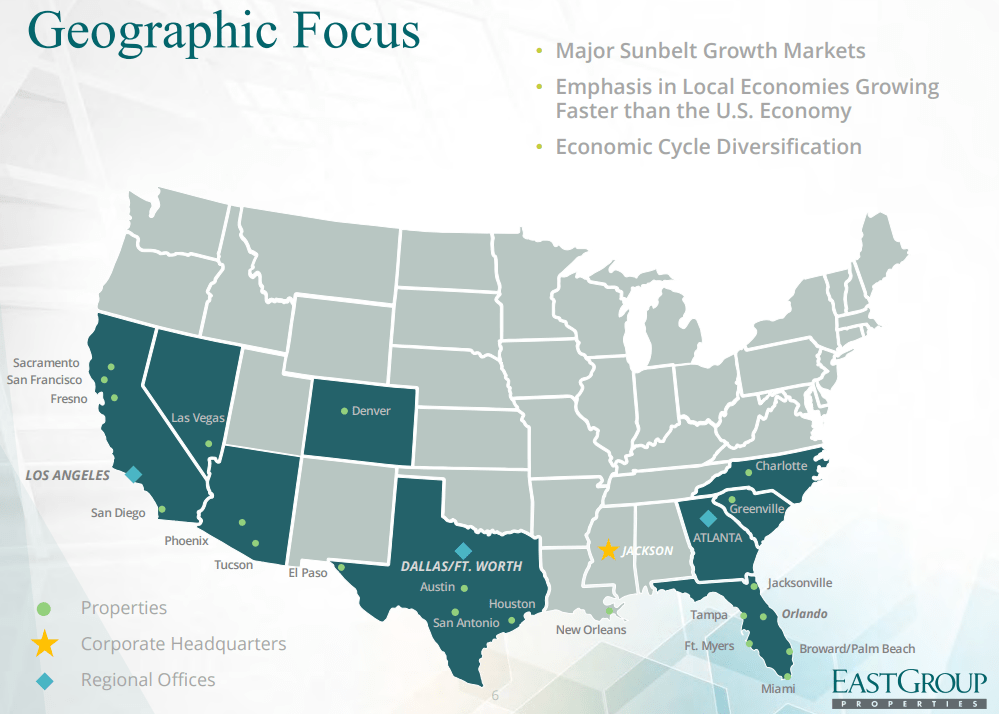
EastGroup seeks customers that need to be in their location, thus competing on location rather than price. Fully 78% of EGP customers rent fewer than 100,000 square feet.
The tenant base is well diversified, with the top 10 customers accounting for only 8.8% of ABR (annual base rent). Amazon, the largest customer, accounts for only 1.6% of total portfolio square footage, and 2.2% of ABR. As of June 30, the portfolio was 99.1% leased and 98.5% occupied.
The company has built 47% of their current portfolio themselves, rather than acquiring. Since 1996, they have developed 244 properties totaling 25.9 msf, at an investment of $2.3 billion.
The company will also do value-add acquisitions in markets where they already have a presence. EGP currently has 28 such projects underway, in 15 different cities, totaling 4.6 msf, for a projected total cost of $558 million.
EastGroup also recycles capital, through the sale of assets with limited upside potential, and reinvests the capital in higher-growth opportunities.
EGP is targeting a company-record $359 million and 1.71 msf of acquisitions this year, concentrated in two cities: Sacramento (0.329 msf) and San Francisco (1.38 msf), and $300 million in new development starts, according to CEO Marshall Loeb.
Looking forward, lease expirations are consistently around 15% for each year from 2023-2027.
EastGroup Properties Q2 2022 earnings presentation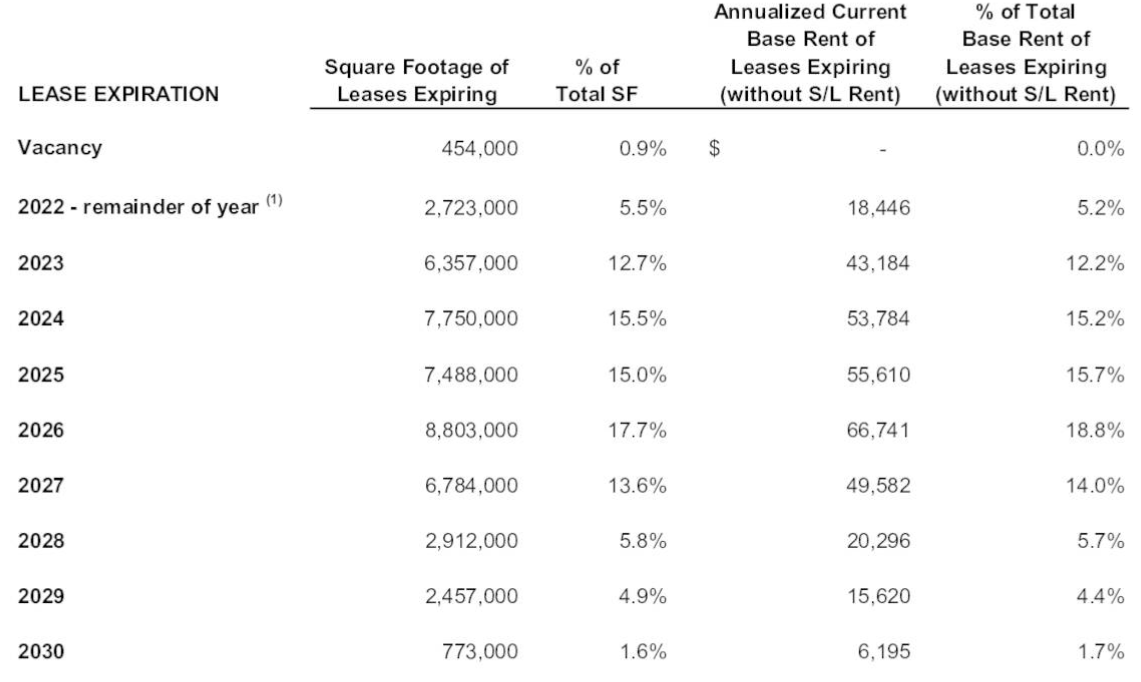
Q2 2022 marked EGP’s 37th consecutive quarter of FFO growth. On eye-popping re-leasing spreads of 35% (GAAP), the company’s NOI (Net Operating Income) of $109.8 million for H1 2022 more than doubled the year-ago figure of $54.9 million, and nearly doubled on a per-share basis also, going from $1.38 in H1 2021 to $2.63 in H1 2022. Net cash from operations was $176.2 million in H1 this year, up from $141.4 million in H1 last year, an increase of 24.6%. The company raised full-year guidance from $6.75 at the midpoint to $6.90.
Growth metrics
Here are the 3-year growth figures for FFO (funds from operations), TCFO (total cash from operations), and market cap.
| Metric | 2019 | 2020 | 2021 | 2022* | 3-year CAGR |
| FFO (millions) | $186.9 | $211.6 | $245.9 | $285.1 | — |
| FFO Growth % | — | 13.2 | 16.2 | 15.9 | 15.1% |
| FFO per share | $4.98 | $5.38 | $6.09 | $6.93 | — |
| FFO per share growth % | — | 8.0 | 13.2 | 13.8 | 11.6% |
| TCFO (millions) | $196 | $196 | $256 | $352 | — |
| TCFO Growth % | — | 0.0 | 30.6 | 37.5 | 21.6% |
*Projected, based on H1 2022 results
Source: TD Ameritrade, CompaniesMarketCap.com, and author calculations.
With a strong balance sheet and double-digit growth in FFO and cash from operations, EGP is a bona fide FROG.
Meanwhile, here is how the stock price has done over the past 3 twelve-month periods, compared to the REIT average as represented by the Vanguard Real Estate ETF (VNQ).
| Metric | 2019 | 2020 | 2021 | 2022 | 3-yr CAGR |
| EGP share price Oct. 21 | $128.82 | $137.72 | $190.32 | $143.47 | — |
| EGP share price Gain % | — | 6.9 | 38.2 | (-24.6) | 3.66% |
| VNQ share price Oct. 21 | $95.25 | $79.89 | $108.53 | $78.15 | — |
| VNQ share price Gain % | — | (-16.1) | 35.8 | (-28.0) | (-6.38)% |
Source: MarketWatch.com and author calculations
EastGroup has outperformed the VNQ over each 12-month period, and investors who bought 3 years ago are still up an average of 3.66% per annum on the share price alone. Over that same span, investors in the VNQ have experienced a loss of (-6.38)% per annum in valuation. So EGP has outperformed VNQ by 1000 basis points, while posting a gain each year, even in the pandemic.
And with a market cap of $6.3 billion, EGP sits right in the market cap sweet spot, where total returns tend to be the best.
Balance sheet metrics
Here are the key balance sheet metrics, and they are solid. In a year when many REITs are taking on debt, EGP’s Liquidity Ratio, Debt Ratio, and Debt/EBITDA are all better than the REIT average. However, Industrial REITs are characterized by strong balance sheets, so these numbers for EGP, though sturdy, are slightly below the sector average.
| Company | Liquidity Ratio | Debt Ratio | Debt/EBITDA | Bond Rating |
| EGP | 1.95 | 14% | 5.4 | — |
Source: Hoya Capital Income Builder, TD Ameritrade, and author calculations
EGP carries $1.628 billion in debt. The vast majority of that ($1.42 billion) is unsecured fixed-rate debt at a weighted average interest rate of 3.01%, with maturities pretty evenly spread out through 2026, and more than half ($900,000) due in 2027 or later. There is also $206 million in variable-rate unsecured credit facilities, at 2.15% interest, all due in 2025. Lastly, there is $2.099 million in secured fixed-rate debt, at 3.85%. Against this debt, the company was holding $5.56 million in cash as of June 30.
Company 10-Q for Q2 2022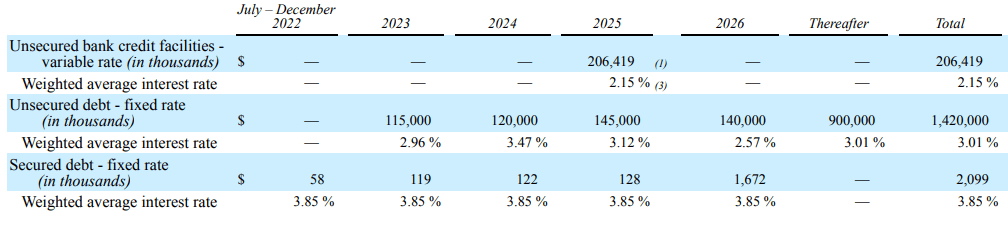
Dividend metrics
Industrial REITs are typically low-yielding securities, but thanks to the brutal 2022 sell-off, the sector Yield has climbed to 3.18%, which doesn’t sound like much. However, Industrial REITs are typically strong when it comes to dividend growth, and EGP stands out, even from that crowd, at 18.6% over the past three years and 52.9% over the past 12 months. With growth like that, 3.49% current Yield is a pretty good entry point.
| Company | Div. Yield | 3-yr Div. Growth | Div. Score | Payout | Div. Safety |
| EGP | 3.49% | 18.6% | 5.82 | 70% | B |
Source: Hoya Capital Income Builder, TD Ameritrade, Seeking Alpha Premium
Dividend Score projects the Yield three years from now, on shares bought today, assuming the Dividend Growth rate remains unchanged. At EGP’s current rate of dividend growth, shares bought today would be handily out-yielding the REIT average within three years. Meanwhile, even with a 70% payout ratio, the dividend earns a sturdy Safety grade of B from Seeking Alpha Premium.
EastGroup has maintained or increased the dividend every year since 1993, even during the pandemic.
Valuation metrics
Industrial REITs trade at a well-justified premium to the REIT average, but EGP’s Price/FFO of 20.7 is the lowest it has been in many years. Meanwhile, EGP is trading at a (-16.6)% discount to NAV, which is a little better than the REIT average. So this company now offers sizzling income growth at a reasonable price.
| Company | Div. Score | Price/FFO ’22 | Premium to NAV |
| EGP | 5.82 | 20.7 | (-16.6)% |
Source: Hoya Capital Income Builder, TD Ameritrade, and author calculations
What could go wrong?
If inflation continues or increases, EGP’s automatic rent escalators may not be enough to offset the difference, adversely affecting operating results. Inflation could also raise the cost of developing the new facilities this company is known for.
Continued increases in interest rates could adversely affect the company’s d ability to raise equity capital on attractive terms.
The company’s concentration in Texas, Florida, and California brings with it a measure of risk, should unforeseen economic downturns occur in any of those states.
While I am not saying a civil war is going to break out in the next year or two, the odds appear to me to be increasing every day, and that looming possibility is something all investors would be wise to take into account. In the event of such a catastrophe, supply chains would likely be disrupted, and warehouse facilities would be prized by both sides, and thus could be subject to destruction or confiscation.
Investor’s bottom line
The secular tailwinds of limited supply and strong demand will probably continue to drive outstanding earnings for EGP, and now is a rare opportunity to buy this bona fide FROG at an unusually low price and high yield. I rate EGP a Buy, both for growth investors and value investors.
Seeking Alpha Premium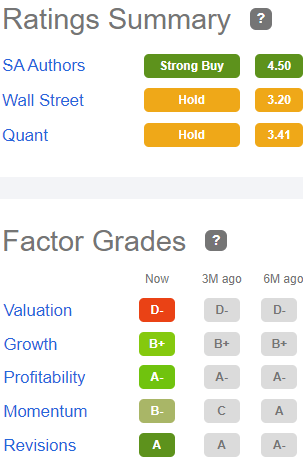
The Seeking Alpha Quant Ratings system ranks EGP as a Hold, as do TipRanks and Zacks, and 11 of the 15 Wall Street analysts covering this firm. Meanwhile, The Street and Ford Equity Research say Buy, as does Hoya Capital Income Builder, and Seeking Alpha contributor Ross Bowler rates it a Strong Buy.
There are even better buys than EGP among the Industrial REITs, and across other REIT sectors. Hoya Capital Income Builder makes those bargains easy to identify, with target Buy prices for every U.S. REIT, and daily updates on the spread between target buy price and current share price.
As always, however, the opinion that matters most is yours.
Be the first to comment