AngiePhotos/E+ via Getty Images
I suppose my dear readers would agree that momentum is а simple and powerful factor that can yield staggering results.
Investing in a stock that has been delivering robust capital gains recently, being propped up either by earnings surprises, a growth story materializing, the market optimism overall, or any other catalysts, anticipating its price to continue climbing higher, does not require tedious models with a string of estimates that must be prepared carefully and scrupulously tested. And a portfolio that is adjusted to account for changes in sentiment (i.e., to oust those that lost momentum and replace them with newly emerged outperformers) can certainly generously reward investors with solid capital gains.
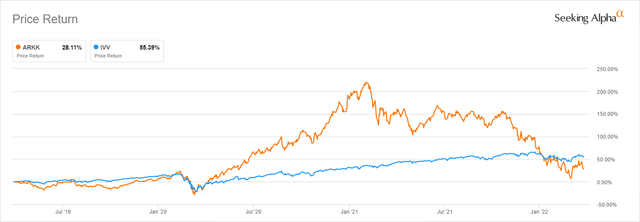
But in fairness, following the tenets of momentum investing also means buying oil stocks in mid-2014 and the ARK Innovation ETF (ARKK) in February 2021. Buying high, selling low, suffering losses. Or buying high and selling even higher?
The performance of the ETF we will be reviewing today, the iShares Edge MSCI USA Momentum Factor ETF (BATS:MTUM), illustrates that betting on outstanding performers certainly bolsters alpha. It has managed to beat the S&P 500 ETF (IVV) since its inception. But is the factor that simple and always that lucrative? Or is it safe?
As I pointed out in my November note on the Virtus Terranova U.S. Quality Momentum ETF (JOET), a momentum strategy is at times a powerful though precarious bet without due quality considerations factored in. That is why combining momentum with profitability, or, ideally, with other parameters like value and growth (which, among other things, can be done with the Quant data using the screener) can help to avoid poor decisions. But MTUM’s large-cap tilt has also secured its large exposure to the quality factor, as I will illustrate below shortly. Seemingly, the key ingredients are in place. Simplicity, a long-term track record, quality. Is it a Buy then? There is still a lot to assess to arrive at a balanced conclusion.
Investment strategy
MTUM’s investment mandate is to track the MSCI USA Momentum SR Variant Index.
The underlying index was changed in December 2020, but the methodology differences are fairly minor, mostly related to the mechanics of rebalancing. That said, I used MTUM’s returns since inception in the performance analysis below in the article.
The summary prospectus offers a glimpse into the benchmark’s methodology. Long story short, the MSCI USA index is the selection pool. A constituent must have a certain score that is based on the 6- and 12-month risk-adjusted price momentum, which is defined as
the excess return over the risk-free rate divided by the annualized standard deviation of weekly returns over the past three years.
A stock’s weight depends on its momentum score and market cap in the parent index and is capped at 5%. The index is reconstituted biannually.
Portfolio analysis
The portfolio as of April 6 features mostly mega- and large-cap names. Those with market values in excess of $100 billion accounted for over 60% of the net assets. We see only two members of the $1 trillion league, namely Tesla (TSLA) and Microsoft (MSFT), which together have ~10.6% weight being MTUM’s largest positions. Apple (AAPL) and Amazon (AMZN) failed to qualify. I have found only two mid-caps, Asana (ASAN) and Upstart (UPST), with a combined weight of only 11 bps.
A tilt towards the most expensive companies (thanks to market cap influencing a constituent’s weight) has somewhat immunized the fund from the quality issues typical for the lower echelons of the stock market, as I discussed in a few articles in the past.
The IT, financials, and healthcare sectors are in the top trio, with weights of close to 33%, 23.5%, and 12.3%, respectively. The tech stocks have suffered badly this year amid the market adapting to higher interest rates, so MTUM’s lackluster return YTD is no coincidence.
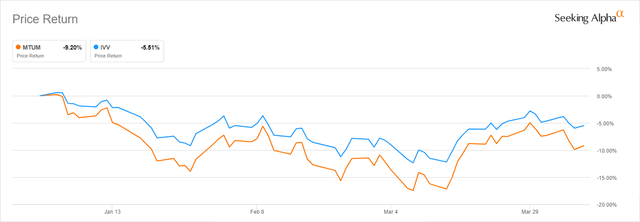
Now, factors. Does the current version of the portfolio feature top momentum names? Mostly so. ~77% of the portfolio have at least B- Quant Momentum grade. Did it have a similar share at the end of 2021? I checked that using a Quant dataset from December 31. And it appeared that 93% of the holdings had at least B- score. For context, the MTUM price has dropped by over 9% since the beginning of the year. IVV has lost ~5.5%. Yes, momentum shines. Until it does not.
There is another issue. MTUM is one of the most overvalued U.S. equity ETFs I have ever seen. The share of stocks trading at insanely inflated levels (D+ grade and lower) has declined a bit since end-2021 but it remains elevated. It was over 87% in December; it fell to ~82% as of April 6. The weight of value stocks has risen from ~1.5% to ~5%.
Meanwhile, growth stocks slightly retreated. Those with at least B- grade accounted for ~43%; they have ~37% now.
Finally, quality. There is little to criticize. A share of stocks with a Quant Profitability grade of at least B- is marginally south of 90%. In December, it was only slightly weaker, ~85%.
A few companies that are cash flow-negative and loss-making are featured in the portfolio, but their weight is minimal.
The scatter plot below covers ~75% of the holdings (ex-financials and REITs). Though not ideal, most are grossly profitable, with the EBITDA and cash flow margins between ~10% and ~40%.
Created by the author using data from the fund and Seeking Alpha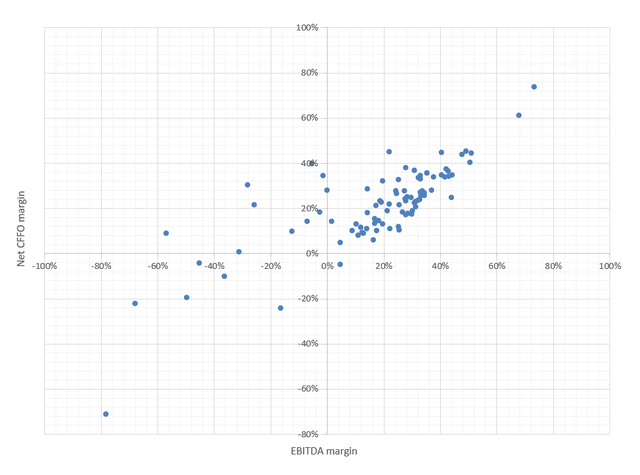
Overall, the profitability characteristics of the portfolio are more than adequate.
Performance analysis: impeccable long-term picture marred by recent softness
As I said above, MTUM’s returns are robust.
Created by the author using data from Portfolio Visualizer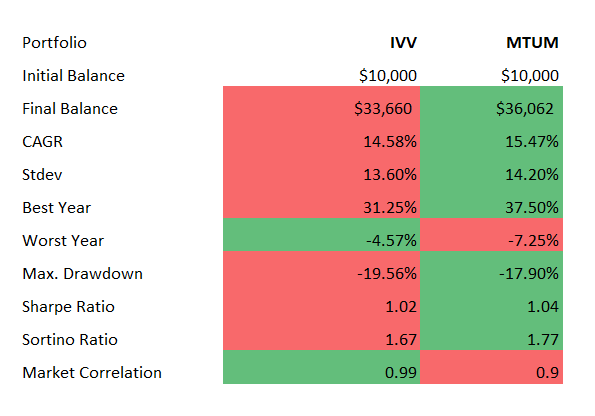
Though with a bit higher volatility (see standard deviation), its CAGR delivered during the period from May 2013 (it was incepted on 16 April 2013) to March 2022 is higher than IVV’s by ~1%.
It is explainable. For example, in 2020, when investors were flocking to the pandemic winners principally from the IT sector, MTUM achieved an almost 30% total return. IVV returned just ~18.4%. 2017 was another grossly successful year when MTUM outperformed the S&P 500 ETF by ~15.7%.
But the factor withered after the record decade.
Probably one of the best illustrations of how lackluster things can become for large-cap momentum investors is the table below.
Created by the author using data from Portfolio Visualizer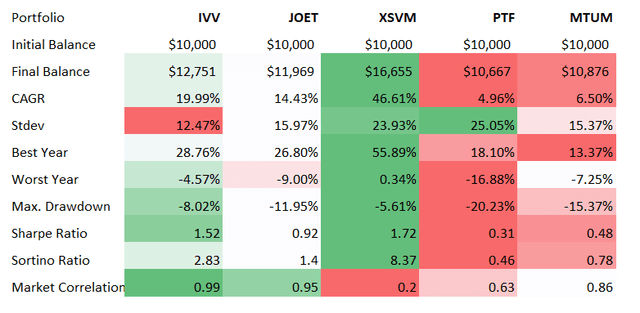
I have compiled data for JOET, Invesco S&P SmallCap Value with Momentum ETF (XSVM), and Invesco DWA Technology Momentum ETF (PTF). The period in focus is from December 2020 to March 2022. It is precisely when the tailwinds of the pandemic that contributed to the growth/tech rally began to dissipate.
Final thoughts
The verdict? It is not a Buy.
The factor is simple, rather potent at times, but it is also vulnerable.
The momentum does not reflect whether a company is priced properly, or whether its valuation adequately reflects the Zeitgeist.
Without a few essential considerations like quality and value, momentum stocks are just those that are approaching bubble territory or have crossed that line only to return back to normalcy after a painful, sometimes prolonged decline.
The track record of the fund speaks for itself. The CAGR mentioned above is impressive. Bellwether funds that are supposed to track the performance of the broad market lagged. But does that mean MTUM is an all-weather outperformer? It does not. Investors who jumped on the momentum train, for instance, in late 2020, expecting the growth echelon to continue appreciating, were seeing the price of their holding declining almost incessantly, with an especially sluggish start to 2022.
That said, though acknowledging MTUM delivered a robust performance in the past (again, depending on a period measured) and once again highlighting its exposure to the high-quality names, I assign it a Hold rating.


Be the first to comment