

Kateryna Onyshchuk
By Gargi Pal Chaudhuri, Head of iShares Investment Strategy Americas at BlackRock
Introduction
We have entered a new regime marked by high volatility, inflation, and uncertainty. The Great Moderation — a period of low inflation and stable economic growth that began in the mid-1980s — has come to an end. The new regime, ushered in by pandemic scars and geopolitical conflict, will have many implications, not least of which is increased demand for more nimble investment tools. ETFs will be key in this transition.
We identify three investment themes that will be paramount for the remainder of 2022:
- Embracing volatility — As central bankers around the globe seek to balance sticky inflation with slowing growth, risk premia is on the rise. We believe defensive positions make most sense as minimizing drawdowns may be the new way to beat a benchmark. We prefer minimum volatility exposures, dividend strategies, and limiting duration.
- Living with sustained inflation — Cyclical drivers of inflation will fade as higher interest rates take their toll, but structural factors mean it will stay higher for longer. That argues for inflation-linked over nominal bonds and getting granular with sub-sectors that exhibit the highest pricing power, such as pharmaceuticals. The emerging trend of “friendshoring” will be a boon for countries that are more geographically and politically aligned with major powers, such as Mexico and Brazil.
- The long-term impacts of shortages — The global economy is grappling with commodity induced volatility that we haven’t seen in decades. From gasoline prices in the U.S. to food inflation globally, it doesn’t take much to see and feel the real economic impact. We believe there are near term opportunities in the energy and agriculture sectors, and longer term solutions in thematic exposures like clean energy and the future of food.
In this investment guide, we pair macroeconomic views and market positioning insights to identify potential investment opportunities using ETFs.
Embracing Volatility
Central banks are reckoning with the tradeoff between tamping down inflation and destroying demand, thereby increasing the risk of recession. Whatever happens, our view is that market risks are set to rise, and investment horizons are likely to shrink. Portfolios will need to be nimbler to adapt to more frequent macro and policy shifts, and to capture investment opportunities across geographies and asset classes. Liquidity considerations will become more important as volatility and portfolio churn increases, adding to the appeal of liquid, transparent, and cost-effective ETFs.
Figure 1. ETFs’ share of total equity trading rises with volatility
Source: iShares Investment Strategy, iShares Markets Coverage, Bloomberg. As of June 22, 2022. ETFs comprised of U.S. listed ETFs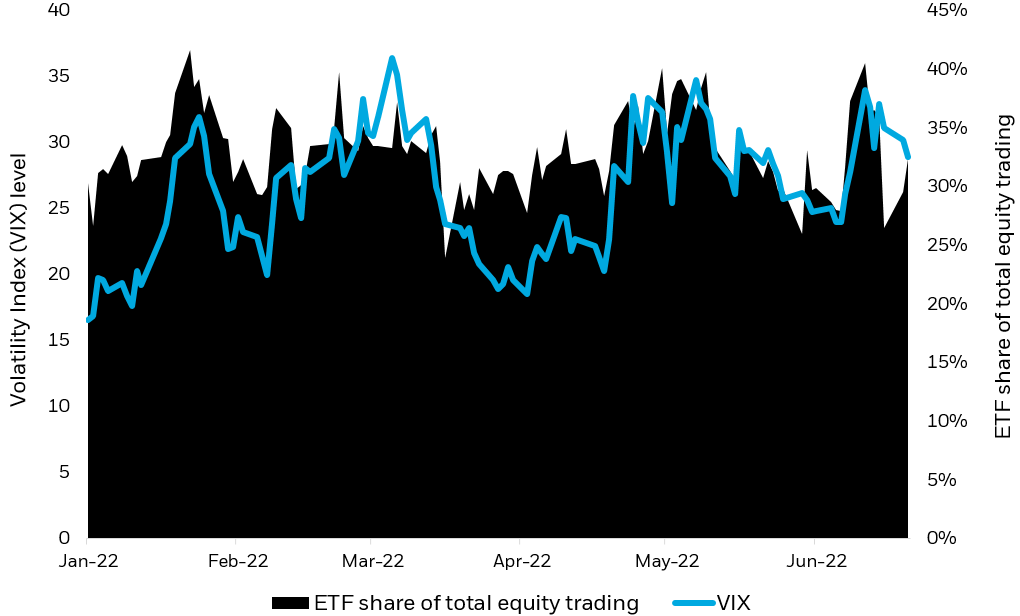
Chart description: Area chart showing the volume of ETFs traded as a percentage of the total equity tape rising concomitantly with the rise of the Chicago Board Options Exchange’s CBOE Volatility Index, which is shown by a line chart (VIX).
For investors, elevated volatility may present opportunities. Staying invested for the long term remains our north star; however, in this uncertain moment, portfolios are best shifted to a defensive stance. In equities, we favor a tilt toward a minimum volatility strategy to reduce overall portfolio risk and to help hedge against significant drawdown. The broad equity market has been down -1% or more in 33 sessions this year, and minimum volatility has outperformed in 30 of those by an average of 64 bps1. In the 12 down days of -2% or more, minimum volatility outperformed in all dozen days by an average of 87 bps.2
Moreover, minimum volatility tilts increase the quality characteristics of a portfolio, beating the broader market on metrics of financial health including gross margin, return on assets, return on common equity, and sales per employee.3 A rotation to less volatile and more defensive segments of the equity market could be reasonably funded out of positions in more expensive, non-profitable, speculative segments of the market that are most sensitive to higher discount rates. ETF flows suggest that investors have been doing exactly that: adding to minimum volatility and defensive sectors like healthcare and infrastructure.
Flows have also gone into dividend ETFs, which we see as a potential source of income, diversification, value, and quality in a portfolio. Compared to stocks whose prices reflect expected profits that extend further into the future, dividend paying stock prices tend to reflect near-term profits. Since rising interest rates can decrease the present value of future cash flows, the over 15% worth of outperformance of high dividend yield stocks versus the broader market suggests an investor preference for near-term cash flows.4 High dividend-paying companies also offer over double the sales per employee compared to companies representing the broader market, a benefit in a tight labor market. They also boast a free cash flow yield — the free cash flow per share divided by the current share price — of 5.9% versus 4.7% for the S&P 500.5
Figure 2: Flows into Min Vol or into defensive sectors/exposures
Source: iShares Investment Strategy, iShares Markets Coverage, Bloomberg. ETF groupings determined by BlackRock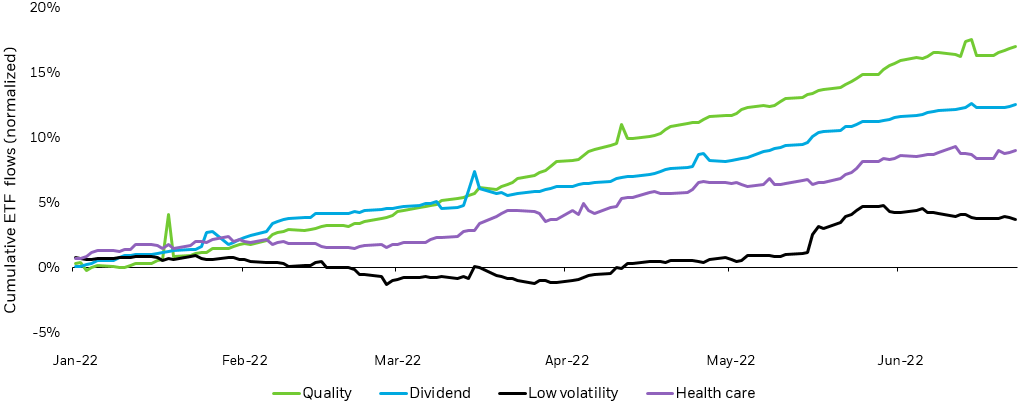
Chart description: Line chart shows flows into minimum volatility factor-focused ETFs and into defensive-oriented ETFs year-to-date. Inflows in all of the categories have stayed positive, with quality gathering the most inflows as % of asset-under-management.
In fixed income, we prefer limiting duration as the Federal Reserve’s hiking cycle and quantitative tightening continues to lift yields, and as a flatter curve offers investors attractive yields in short-dated maturities with lower risk. Our expectation for long-term yields to rise adds conviction to our view to limit portfolio duration. Amid the sharp bond market movements this year, high front-end yields appear more attractive as equity volatility persists; ballast can be sought there in a slowing-growth environment.
Living With Sustained Inflation
2020 marked the end of a 40-year trend toward steadily falling inflation expectations. Recent survey data show longer-term inflation expectations have surged to their highest level in 14 years6. While we still expect cyclical inflation pressures to abate through tighter monetary policy and slower growth, we think inflation will be higher and more persistent than in the past. In short, we think inflation is likely to linger above the 2% pace that was considered most consistent with long-term growth in the recent past.
Why? For one, production constraints in the labor market, supply chains, and commodities are not fading quickly. The New York Fed’s Global Supply Chain Pressure Index has stabilized at relatively high levels. An aging population, a retreat from globalization and justified public health concerns are all longer-term factors which may make labor markets less flexible and contribute to faster inflation.
Figure 1: Supply Chain Bottlenecks
Source: BlackRock, Bloomberg. As of May 2022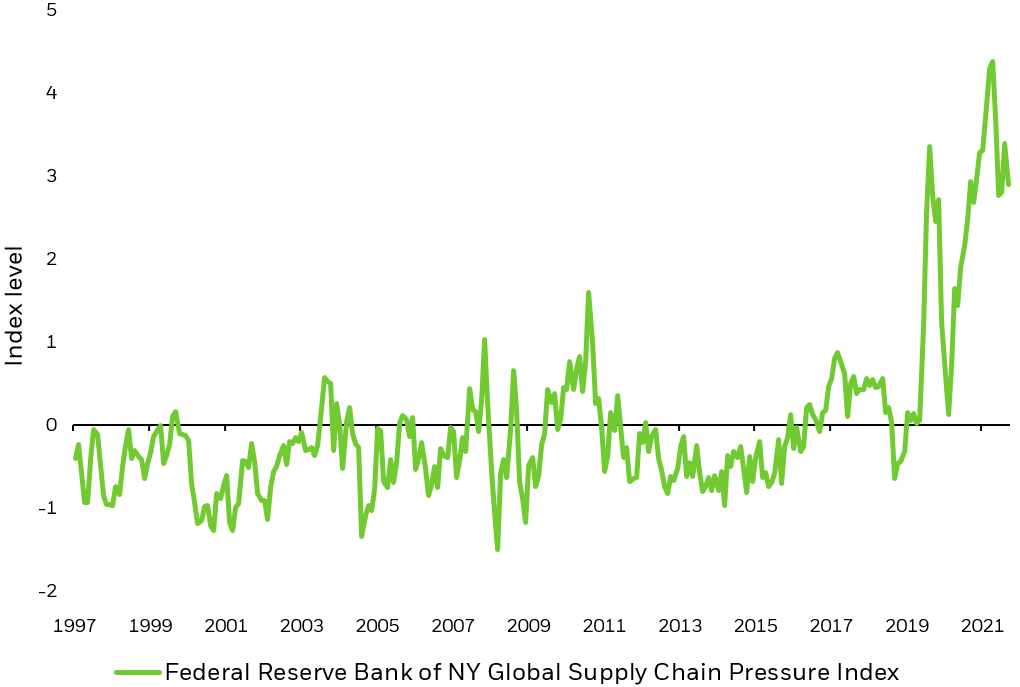
Chart description: The GSCPI integrates global transportation costs, airfreight costs, and data from PMI surveys with the aim of providing a comprehensive summary of potential supply chain disruptions. The line chart shows that the index level has increased meaningfully since the beginning of the Covid pandemic and has remained elevated.
Sustained inflation argues for inflation-linked bonds over nominal bonds. However, in contrast to last year, when the onset of the inflation shock catalyzed $12 billion of inflows to longer-dated Treasury inflation protected securities (TIPS), recession worries may weigh on longer-dated breakeven. Instead, inflation-linked bonds look attractive at the shortest durations, which have gathered $5.9 billion in flows so far this year. We believe that Fed rate hikes are now fully priced into the front end of the yield curve, and higher inflation over the medium term will benefit short-term inflation-linked bonds outright and versus their nominal counterpart. For this reason, we like short-term TIPs exposures.
Figure 2: Inflation fears drive inflows in ’21, recession fears drive outflows in ’22
Source: BlackRock, Bloomberg. As of June 23, 2022. ETF groupings determined by BlackRock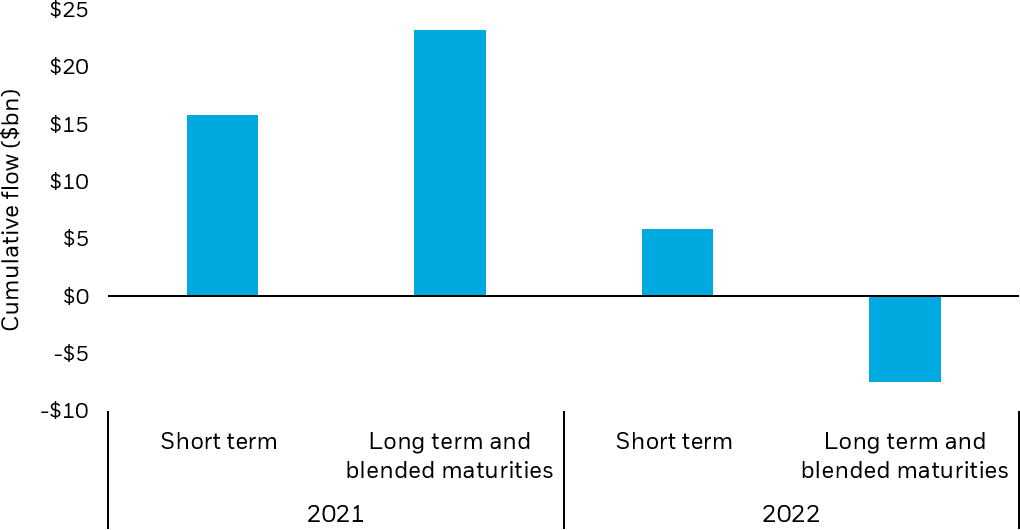
Chart description: Cumulative flows into TIP, end-2020 to June 23, 2022. Short term TIP funds gathered over $15bn of inflows in 2021, and just over $5bn of inflows in 2022 Year-to-date. Long term and blended maturities grew by over $20bn in 2021, but then saw outflows of over $5bn in 2022.
In equities, higher inflation and tighter financial conditions would seem to naturally support a weighting towards defensive sectors like healthcare, staples, and utilities. However, in practice, sector classifications are broad enough to include a wide variety of companies with a range of fundamental characteristics. We prefer focusing on industries within these broad sectors that include more quality companies with pricing power and strong balance sheets. For example, within healthcare, we like pharmaceuticals and healthcare providers.
COVID and geopolitical tensions exposed the fragility of just-in-time inventory management with a sprawling global supply chain. Manufacturers have learned that they cannot dependably source inputs exclusively from distant, politically risky producers. Rather, they need to build redundancies and relocate the production of vital inputs to closer, less antagonistic countries (friendshoring). This trend could benefit modestly higher cost producers that are close politically and geographically to the U.S. Many emerging markets and EM currencies appear poised to benefit from 1) Peak Fed expectations (recession fear reducing Fed hike expectations; 2) Major EMs front-loaded hikes in 2021 on expectations of extended Fed campaign, so already running tight policy; and 3) Emerging Market valuations vs Developed Market, in our view, look attractive, particularly if we are in a world starved of real growth. iShares J.P. Morgan EM Local Currency Bond ETF (LEMB) can provide exposure to countries impacted by friendshoring.
The Long-Term Implications Of Shortages
There is little in the macroeconomic picture that suggests an easing of commodity shortages, either. Recessionary fears amid slowing growth and higher interest rates only work to stymie necessary capital expenditures (both private and public) that would work to solve underlying frictions. However, we don’t believe outright commodity exposures effectively captures this trend. Although a broad commodity allocation has outperformed the S&P 500 by 75% since the beginning of 2022, we believe the pace of commodity price increases will only slow from here.7 Instead, we prefer to own companies that can translate structurally higher commodity prices into profitability. We see two sub-sectors within the commodity complex that are poised to benefit from this backdrop: energy and agriculture.
The energy sector has had a historic run since the depths of the COVID pandemic. Oil prices have risen to over $100/barrel, well-past their five-year average of $53/barrel prior to the pandemic.8 Although prices have moderated as slowing global growth looks to weigh on demand, we still see reason to have exposure to the energy space. After over a decade of easy monetary policy pushed investors towards less capital-intensive sectors, energy companies have learned to emphasize capital discipline amid underinvestment (Figure 1). Coupled with a relatively long capex cycle that ensures capacity constraints won’t be lifted immediately, we expect margins within the energy sector to remain robust, while valuations are also below historical averages.9
Figure 1. Free cash flow yield and EBITDA of energy sector
Source: BlackRock, Bloomberg, chart by iShares Investment Strategy. Reference index is the S&P 500 Energy Sector GICS Level 1 Index. Free cash flow yield is the trailing 12-month free cash flow per share divided by share price. EBITDA is the earnings before interest, taxes, depreciation, and amortization. As of June 24, 2022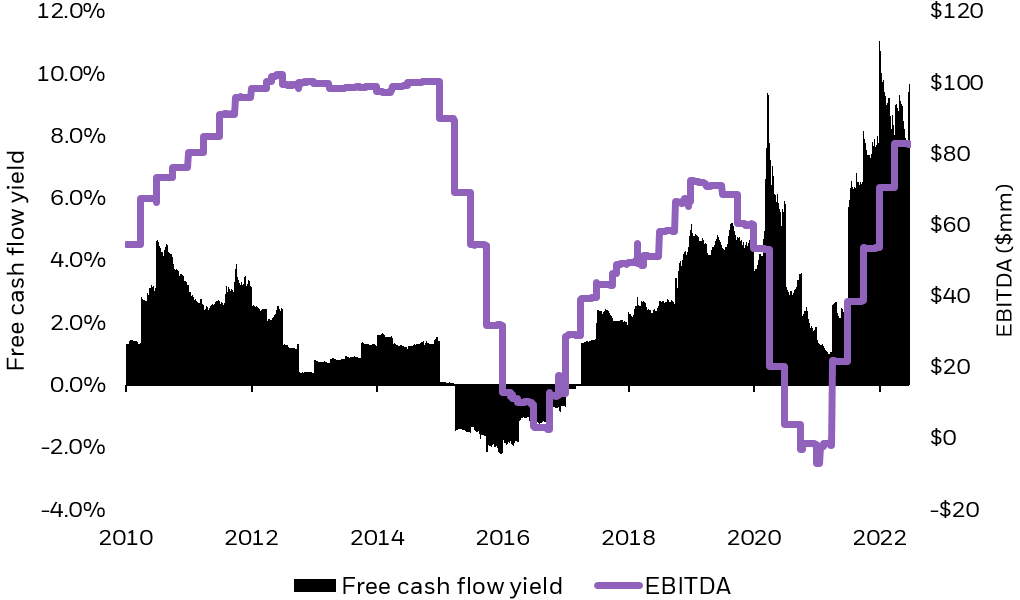
Chart description: Line chart showing the EBITDA rise since 2021 to around $80bn. Area chart showing the free cashflow yield rise to around 8% this year.
Furthermore, the Russia-Ukraine conflict has reemphasized the necessary role energy companies play during the transition to net-zero emissions. The long-term trend away from carbon fuels dissuade substantial investment in new oil and gas projects, helping to keep energy prices higher for longer. However, this also makes green energy alternatives more cost competitive, encouraging investment in the net-zero transition. Transition essentials like wind turbine farms and electric vehicles also require staggering amounts of iron ore, copper, lithium and other metals to match fossil fuel generated power sources’ outputs.
Although not as readily transparent, global food inflation has proven to be just as important as rising oil prices (Figure 2). Disruptions to this season’s growing cycle — due to export restrictions, higher fertilizer costs, and climate change effects — look to only continue. To combat the uncertainty, we believe countries and their farmers will refocus on generating sustainable crop yields through technological investment. Capital expenditures in U.S. farms during much of the past decade have been below depreciation values, pointing to structural underinvestment and aging machinery.10 The next generation of farm technology will look to enable farms to operate more efficiently in face of these needs.
Despite agriculture making up 4% of global GDP (and more than 25% in many emerging markets), many investors remain under-allocated to this part of the real economy.11 Valuations within the agriculture producer space are attractive relative to the broader S&P 500 (12.2 versus 19.6 P/E ratio), while earnings growth has accelerated (three-month EPS percent change: 19%, S&P 500: 1.1%).12 With these attractive valuations and growth in expected earnings, we see the agriculture commodity sector as ripe for investment.
While we see near term opportunities in energy and agriculture, investors with a longer-term focus may also want to consider structural solutions captured in thematic exposures like clean energy and the future of food.
Figure 2. Commodities on the rise
Source: BlackRock, Bloomberg, chart by iShares Investment Strategy. Reference indices are the generic futures contract for WTI Oil, Corn, Wheat, and Soybeans. Rebased at 100 on January 01, 2018. As of June 24, 2022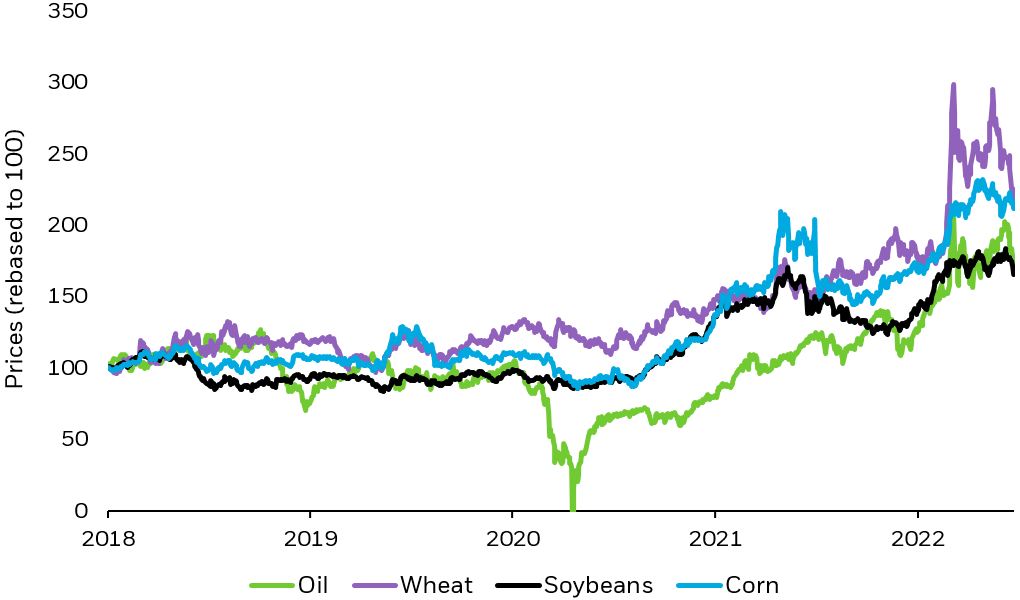
Chart description: Line charts showing prices, rebased to 100 as of January 01, 2018 for oil, wheat, soybeans, and corn. Prices have for all of these commodities have risen consistently since 2021 and are remaining at elevated levels.
© 2022 BlackRock, Inc. All rights reserved.
1 A basis point (bps) is one hundredth of one percent. Example: one basis point = 0.01%.
2 Morningstar data as of June 14, 2022. The broad market is represented by the S&P 500 index while minimum volatility is defined by the MSCI USA Minimum Volatility Index. Indexes are unmanaged and one cannot invest directly in an index. Past performance does not guarantee future results.
3 MSCI USA Minimum Volatility Index (MXUSMVOL Index) versus S&P 500 Index (SPX Index) via Bloomberg as of June 23, 2022: current gross margin on June 23rd of 40.17 for MXUSMVOL Index and 35.09 for SPX Index; return on assets on June 23rd of 6.46 for MXUSMVOL Index and 4.11 for SPX Index; return on equity on June 23rd of 21.82 for MXUSMVOL Index and 20.38 for SPX Index; and sales per employee in 12 months ending on December 31, 2021 of 1,270,023.38 for MXUSMVOL Index and 1,076,270,88 for SPX Index.
4 Source: S&P 500 High Dividend Total Return Index relative to S&P 500 Index data via Bloomberg, as of June 24, 2022. Indexes are unmanaged and one cannot invest directly in an index. Past performance does not guarantee future results.
5 Source: S&P 500 High Dividend Total Return Index relative to S&P 500 Index data via Bloomberg, as of May 24, 2022.
6 University of Michigan 5-10 year inflation expectations
7 BlackRock, Bloomberg. Reference indices include the S&P GSCI Commodity Index and the S&P 500 index. Performance calculated from January 01, 2021, through June 24, 2022. As of June 24, 2022. Indexes are unmanaged and one cannot invest directly in an index. Past performance does not guarantee future results.
8 BlackRock, Bloomberg. Reference index is the WTI Generical Crude Oil contract. Pre-pandemic five-year average calculated as the period between January 01, 2015, through December 31, 2019. As of June 24, 2022.
9 BlackRock, Bloomberg. Reference index is the S&P 500 Energy Sector Index, using price to earnings ratio.
10 Federal Reserve Bank of Kansas City, United States Department of Agriculture. As measured by the ratio of farm capital expenditures and farm capital consumption. As of June 24, 2022.
11 The World Bank, Agriculture and Food. As of June 24, 2022.
Carefully consider the Funds’ investment objectives, risk factors, and charges and expenses before investing. This and other information can be found in the Funds’ prospectuses or, if available, the summary prospectuses, which may be obtained by visiting the iShares Fund and BlackRock Fund prospectus pages. Read the prospectus carefully before investing.
Investing involves risk, including possible loss of principal.
Funds that concentrate investments in specific industries, sectors, markets or asset classes may underperform or be more volatile than other industries, sectors, markets or asset classes and than the general securities market.
The iShares Minimum Volatility Funds may experience more than minimum volatility as there is no guarantee that the underlying index’s strategy of seeking to lower volatility will be successful.
TIPS can provide investors a hedge against inflation, as the inflation adjustment feature helps preserve the purchasing power of the investment. Because of this inflation adjustment feature, inflation protected bonds typically have lower yields than conventional fixed rate bonds and will likely decline in price during periods of deflation, which could result in losses. Government backing applies only to government issued securities, and does not apply to the funds.
International investing involves risks, including risks related to foreign currency, limited liquidity, less government regulation and the possibility of substantial volatility due to adverse political, economic or other developments. These risks often are heightened for investments in emerging/ developing markets or in concentrations of single countries.
This material represents an assessment of the market environment as of the date indicated; is subject to change; and is not intended to be a forecast of future events or a guarantee of future results. This information should not be relied upon by the reader as research or investment advice regarding the funds or any issuer or security in particular.
The strategies discussed are strictly for illustrative and educational purposes and are not a recommendation, offer or solicitation to buy or sell any securities or to adopt any investment strategy. There is no guarantee that any strategies discussed will be effective.
The information presented does not take into consideration commissions, tax implications, or other transactions costs, which may significantly affect the economic consequences of a given strategy or investment decision.
Diversification and asset allocation may not protect against market risk or loss of principal.
This material contains general information only and does not take into account an individual’s financial circumstances. This information should not be relied upon as a primary basis for an investment decision. Rather, an assessment should be made as to whether the information is appropriate in individual circumstances and consideration should be given to talking to a financial professional before making an investment decision.
There is no guarantee that dividends will be paid.
No proprietary technology or asset allocation model is a guarantee against loss of principal. There can be no assurance that an investment strategy based on the tools will be successful.
The information provided is not intended to be tax advice. Investors should be urged to consult their tax professionals or financial professionals for more information regarding their specific tax situations.
The Funds are distributed by BlackRock Investments, LLC (together with its affiliates, “BlackRock”).
The iShares Funds are not sponsored, endorsed, issued, sold or promoted by Bloomberg, BlackRock Index Services, LLC, Cohen & Steers, European Public Real Estate Association (“EPRA®”), FTSE International Limited (“FTSE”), ICE Data Indices, LLC, NSE Indices Ltd, JPMorgan, JPX Group, London Stock Exchange Group (“LSEG”), MSCI Inc., Markit Indices Limited, Morningstar, Inc., Nasdaq, Inc., National Association of Real Estate Investment Trusts (“NAREIT”), Nikkei, Inc., Russell or S&P Dow Jones Indices LLC or STOXX Ltd. None of these companies make any representation regarding the advisability of investing in the Funds. With the exception of BlackRock Index Services, LLC, which is an affiliate, BlackRock Investments, LLC is not affiliated with the companies listed above.
Neither FTSE, LSEG, nor NAREIT makes any warranty regarding the FTSE Nareit Equity REITS Index, FTSE Nareit All Residential Capped Index or FTSE Nareit All Mortgage Capped Index. Neither FTSE, EPRA, LSEG, nor NAREIT makes any warranty regarding the FTSE EPRA Nareit Developed ex-U.S. Index or FTSE EPRA Nareit Global REITs Index. “FTSE®” is a trademark of London Stock Exchange Group companies and is used by FTSE under license.
© 2022 BlackRock, Inc. All rights reserved. BLACKROCK, BLACKROCK SOLUTIONS, BUILD ON BLACKROCK, ALADDIN, iSHARES, iBONDS, FACTORSELECT, iTHINKING, iSHARES CONNECT, FUND FRENZY, LIFEPATH, SO WHAT DO I DO WITH MY MONEY, INVESTING FOR A NEW WORLD, BUILT FOR THESE TIMES, the iShares Core Graphic, CoRI and the CoRI logo are trademarks of BlackRock, Inc., or its subsidiaries in the United States and elsewhere. All other marks are the property of their respective owners.
This post originally appeared on the iShares Market Insights.
Editor’s Note: The summary bullets for this article were chosen by Seeking Alpha editors.
Be the first to comment