


It’s a duel and the loser is clear!
Aksonov/E+ via Getty Images
Get ready for charts, images, and tables because they are better than words. The ratings and outlooks we highlight here come after Scott Kennedy’s weekly updates in the REIT Forum. Your continued feedback is greatly appreciated, so please leave a comment with suggestions.
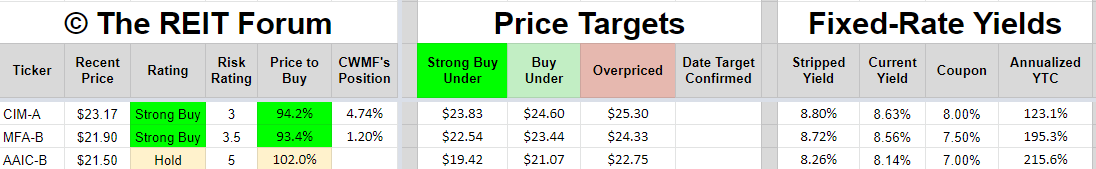
Want to see some absurdity in evaluating risks? Compare these three shares:
All three shares carry fixed-rate dividends, but two are much better than the other:
The REIT Forum
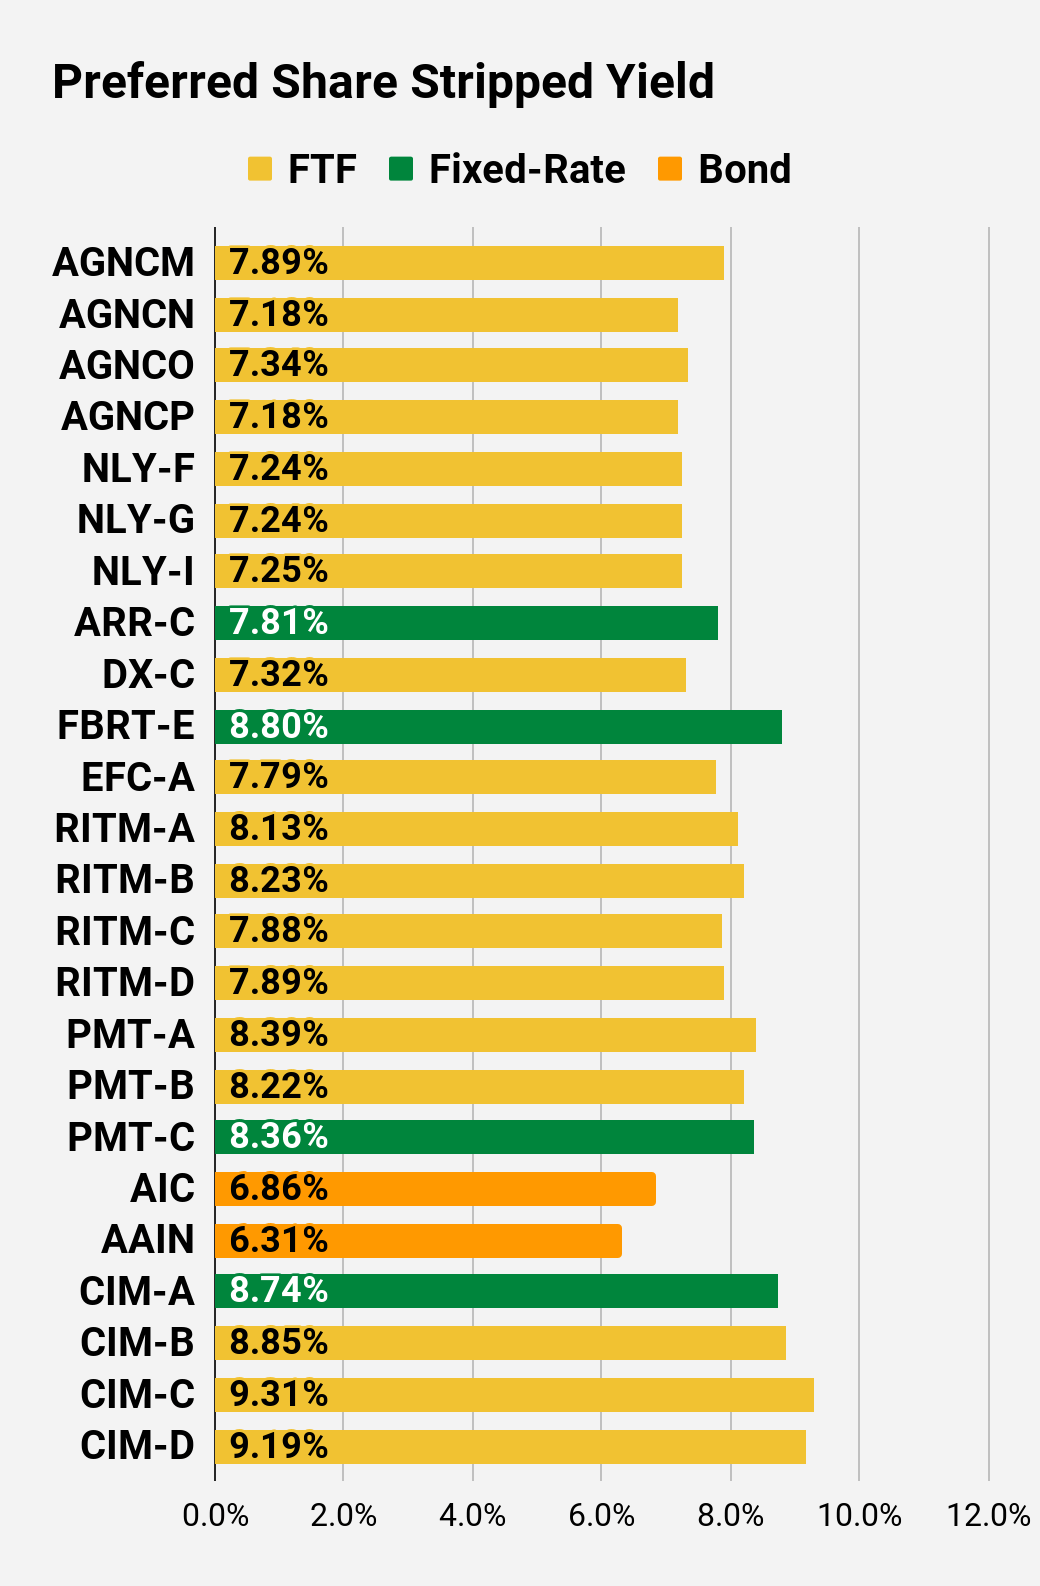
CIM-A offers the highest yield at 8.8% despite the lowest risk rating.
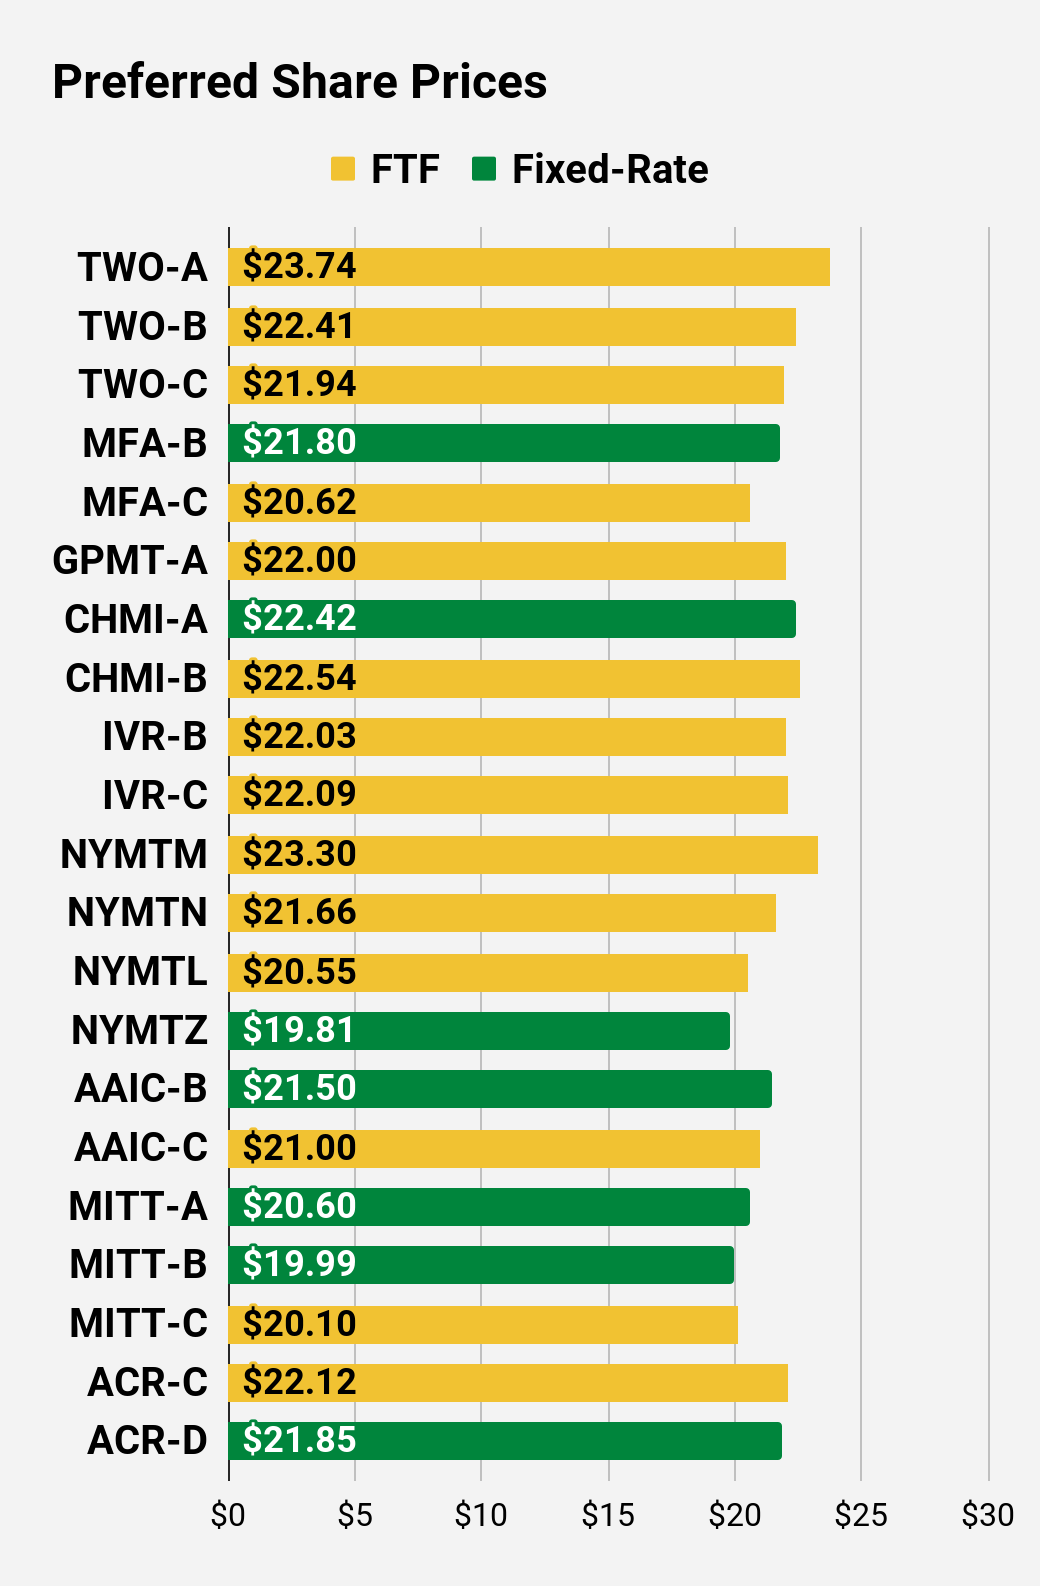
MFA-B has a slightly lower yield, but the share price being lower by $1.27 gives investors quite a bit of additional upside to call value. That’s a pretty even comparison.
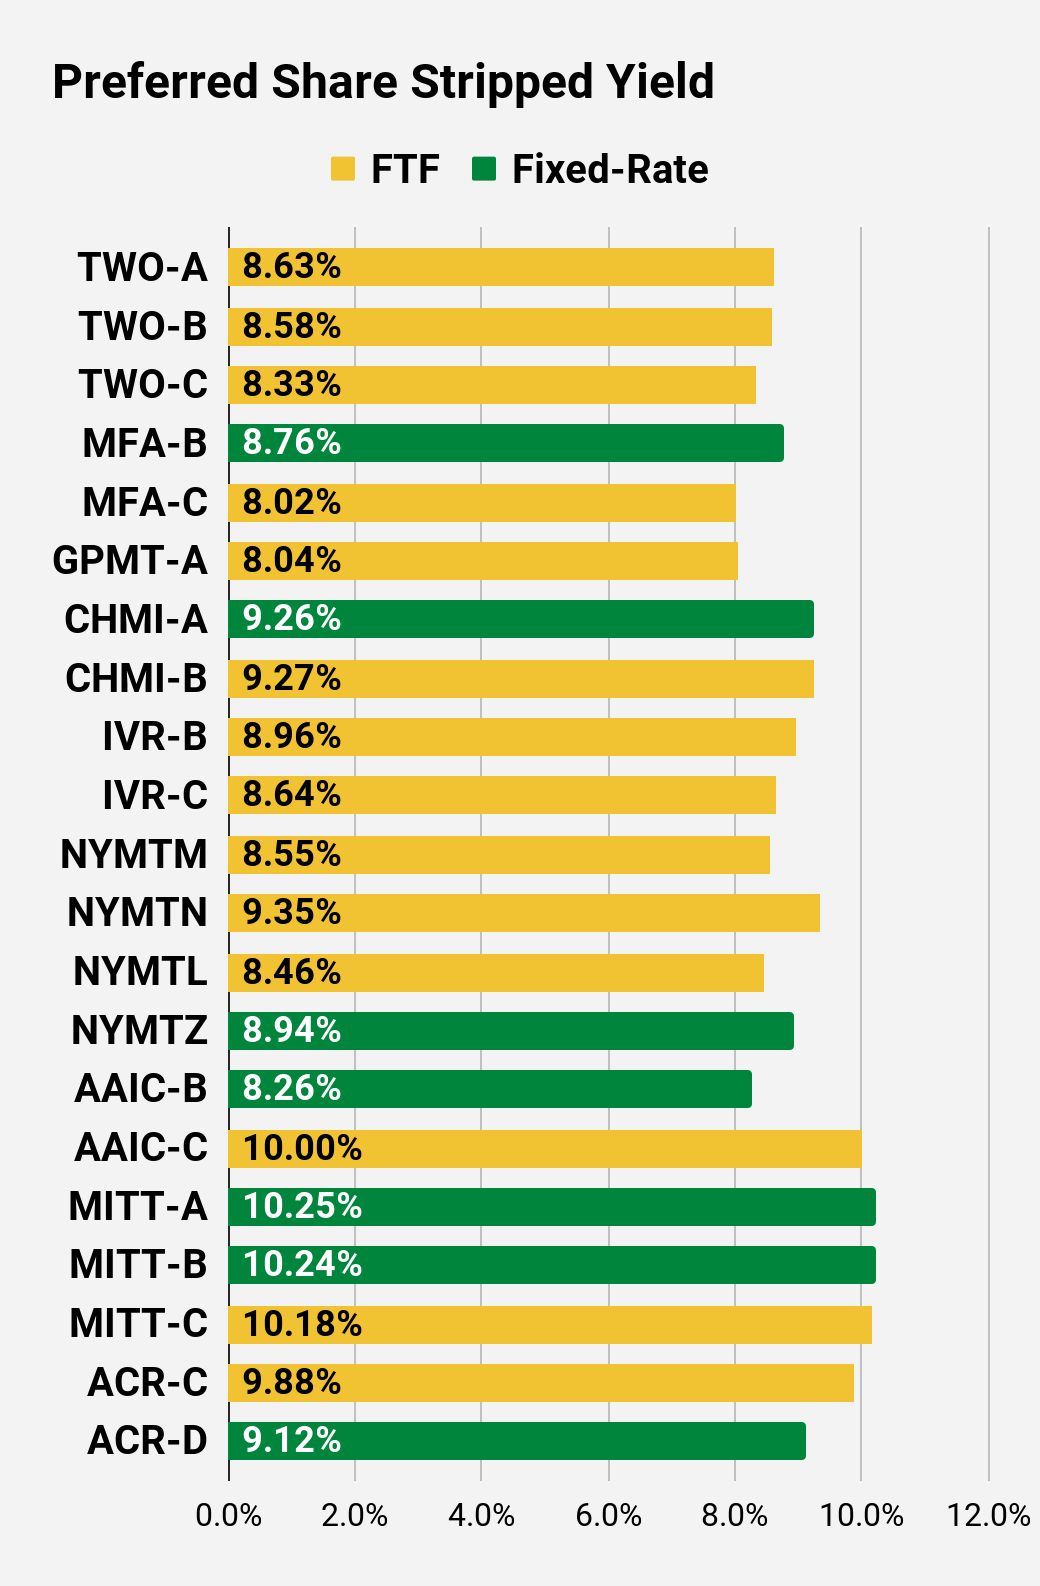
Then we get to AAIC-B. AAIC-B has only slightly more upside than MFA-B, but the stripped yield is materially lower at 8.26% compared to 8.72% on MFA-B. Is the extra $.40 upside to call value enough to justify that difference in yield? No. It was a rhetorical question. The answer is no.
Now you might argue that I’m just wrong in evaluating the risk levels. Let’s consider the common shares.
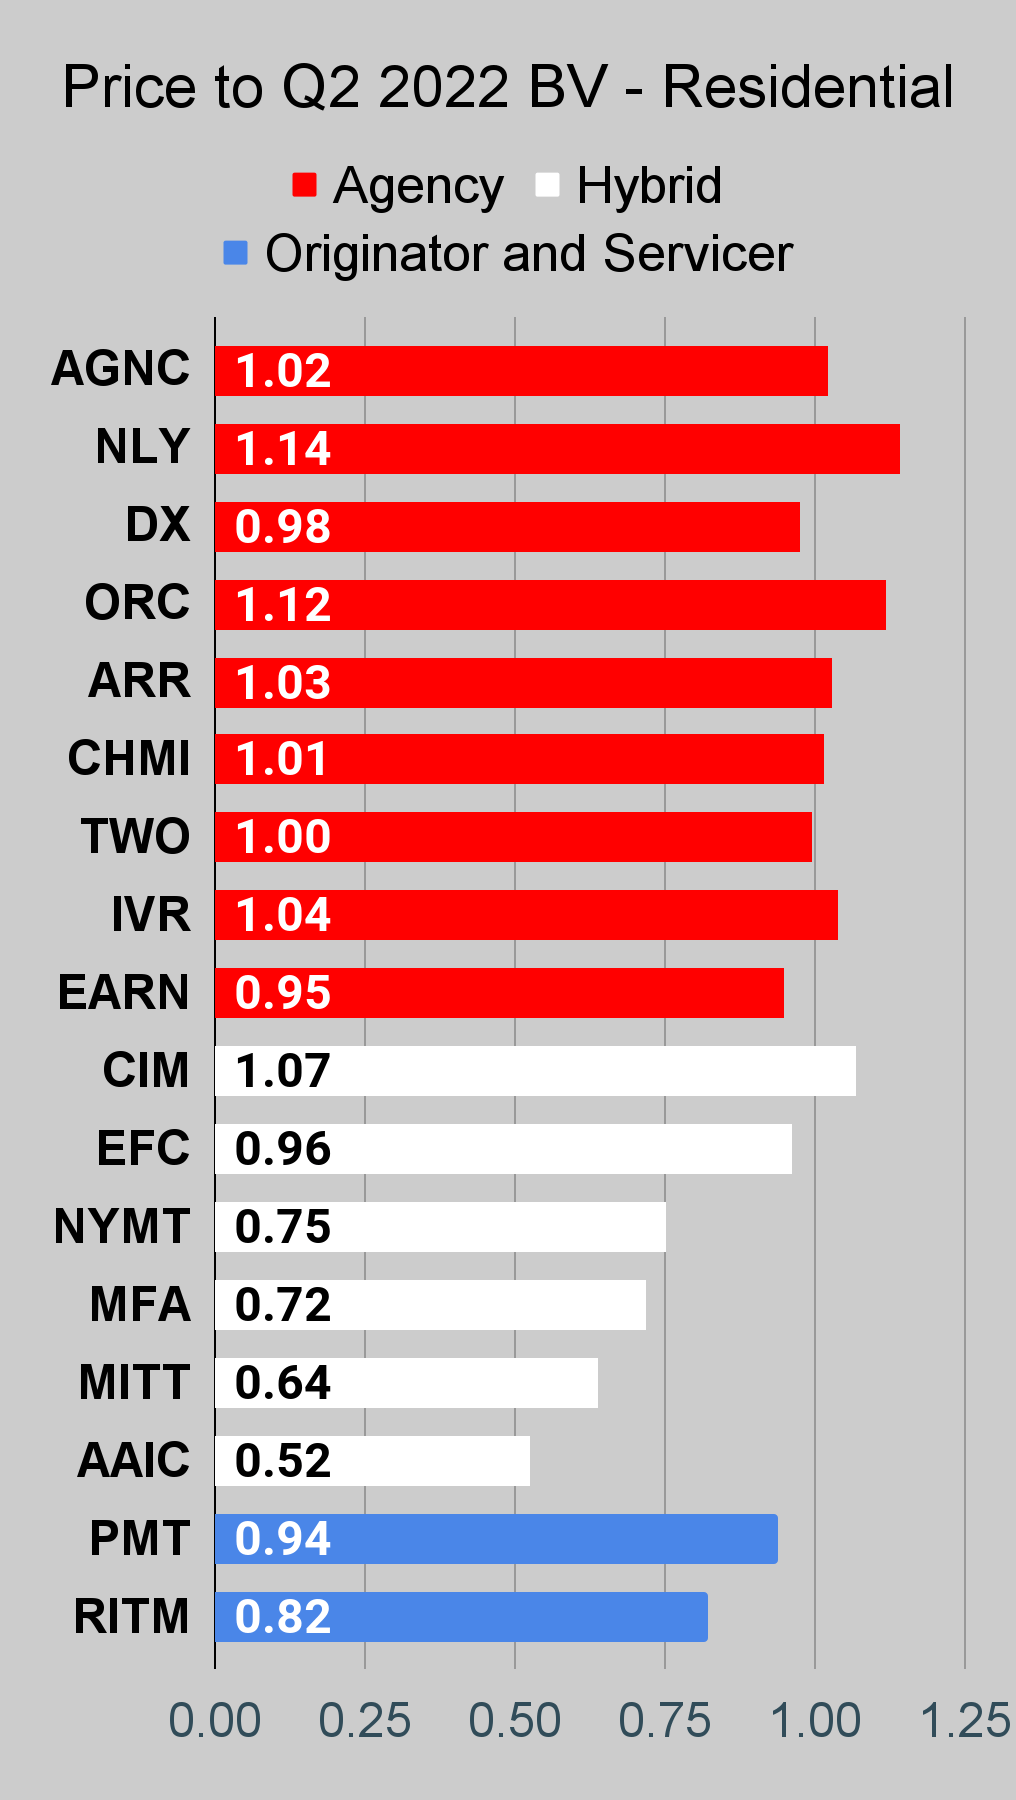
- CIM trades at a 7% premium to trailing book value.
- MFA trades at a 28% discount to trailing book value.
- AAIC trades at a 48% discount to trailing book value.
Investors in the common shares clearly agree with the idea that CIM is offering less risk while AAIC offers the most risk. That additional risk in AAIC is also reflected in AAIC not even having a dividend on the common shares.
Still don’t think there’s a problem in the risk/reward profiles? Don’t blame it on one series of shares not being callable. Any of them could be called on 30 days’ notice, so you can toss that idea out.
Maybe you just think AAIC is secretly dramatically less risky? Tell that to investors in AAIC-C (AAIC.PC)! AAIC-C trading $.24 cheaper than AAIC-B. AAIC-C switches over to a floating rate when call protection runs out. Until then, the stripped yield is 9.87% (much better than 8.26%). If short-term rates remain at the current levels, the floating rate would turn into a 10.32% yield on the current stripped price.
So unless you’re thinking AAIC-B is about to be called (which would be stupid, even by lower standards for AAIC), that disparity between AAIC-B and AAIC-C doesn’t make sense. In fact, the only way you can get it to make sense is to assume that short-term rates are going to fall about 0% within the next year or two. That assumption is necessary to believe AAIC-C should trade for less than AAIC-B. Well, sometimes people believe things without ever thinking about them at all. That’s possible also, but I wouldn’t recommend it.
The rest of the preferred shares show a tendency to prefer shares that switch over to a floating rate. That makes sense, since given current rates it would generally mean a material increase in the dividend rate. I still like to mix floating-rate and fixed-rate shares. However, there’s no way I’d be buying AAIC-B when there are vastly better options on the market.
Should you short AAIC-B? No. Good luck with that. Shorting a preferred share is absurdly expensive (cost to borrow, not just the dividend) and the terrible liquidity puts investors at extra risk. Should investors sell their shares and reallocate the capital to a better share? Absolutely. I’ve given you two superior options here. I’m not going to suggest AAIC-C. It’s a better deal, but if investors want a fixed-to-floating share, they should be looking elsewhere.
In short, if investors want a fixed-rate, they can do better than AAIC-B. If they want a fixed-to-floating share, they can do better than AAIC-C. Between the two, AAIC-B is less appealing than AAIC-C.
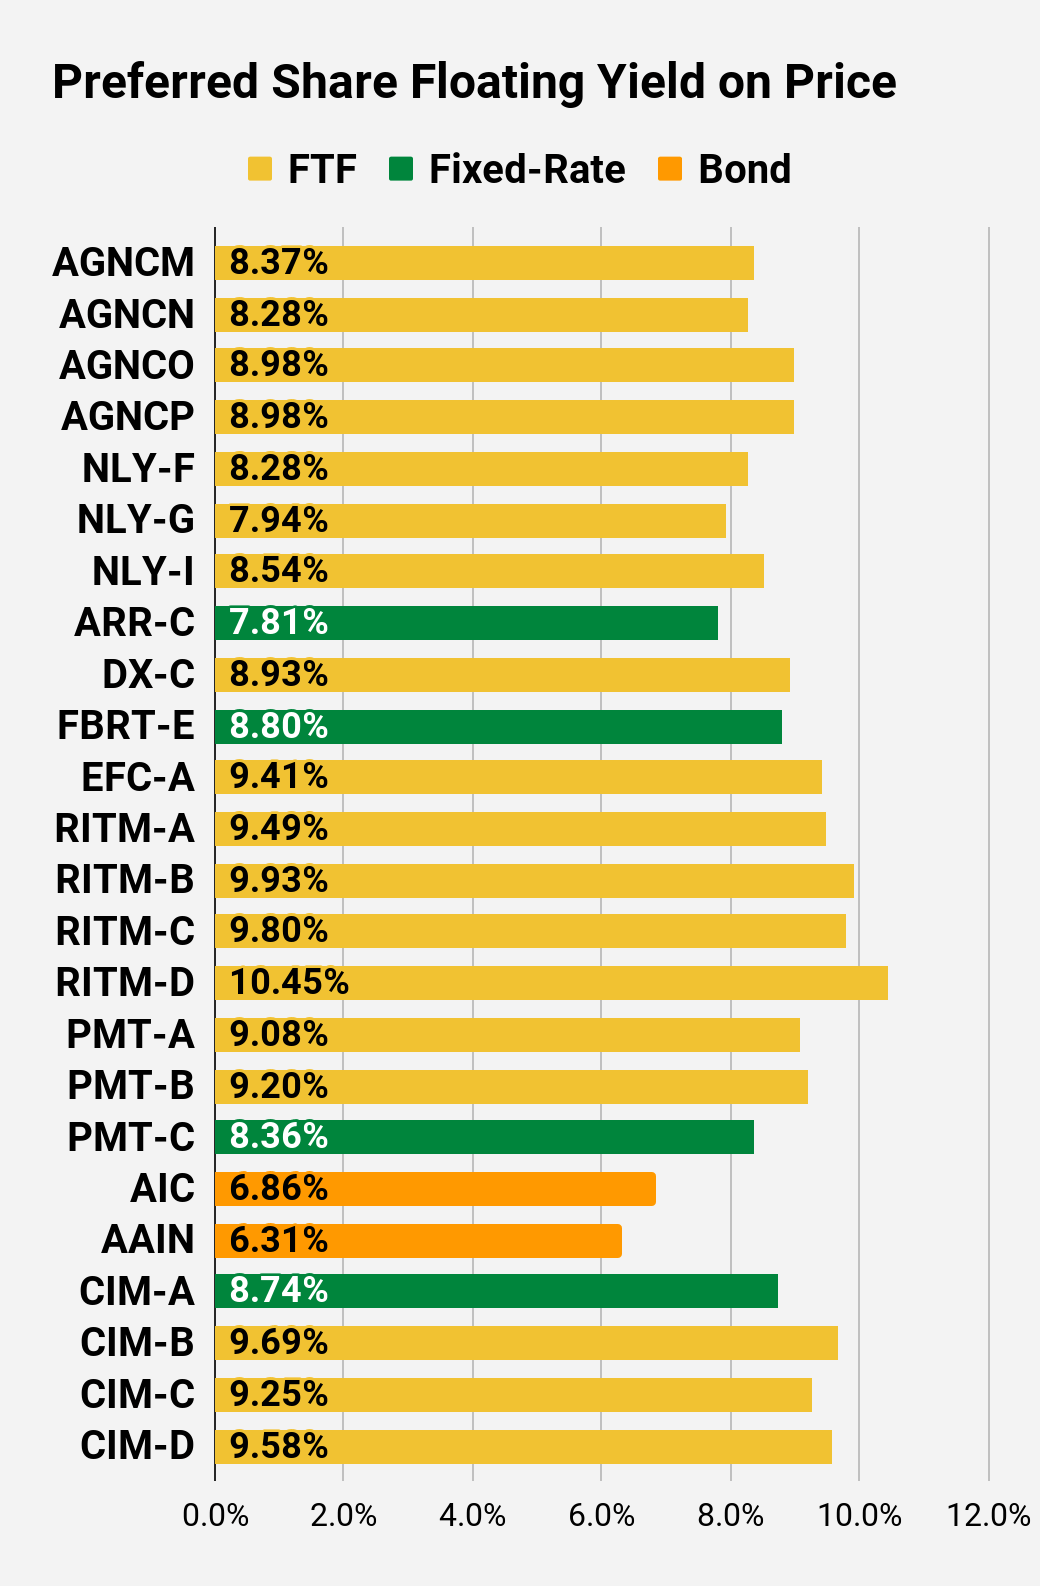
The rest of the charts in this article may be self-explanatory to some investors. However, if you’d like to know more about them, you’re encouraged to see our notes for the series.
Stock Table
We will close out the rest of the article with the tables and charts we provide for readers to help them track the sector for both common shares and preferred shares.
We’re including a quick table for the common shares that will be shown in our tables:
Let the images begin!
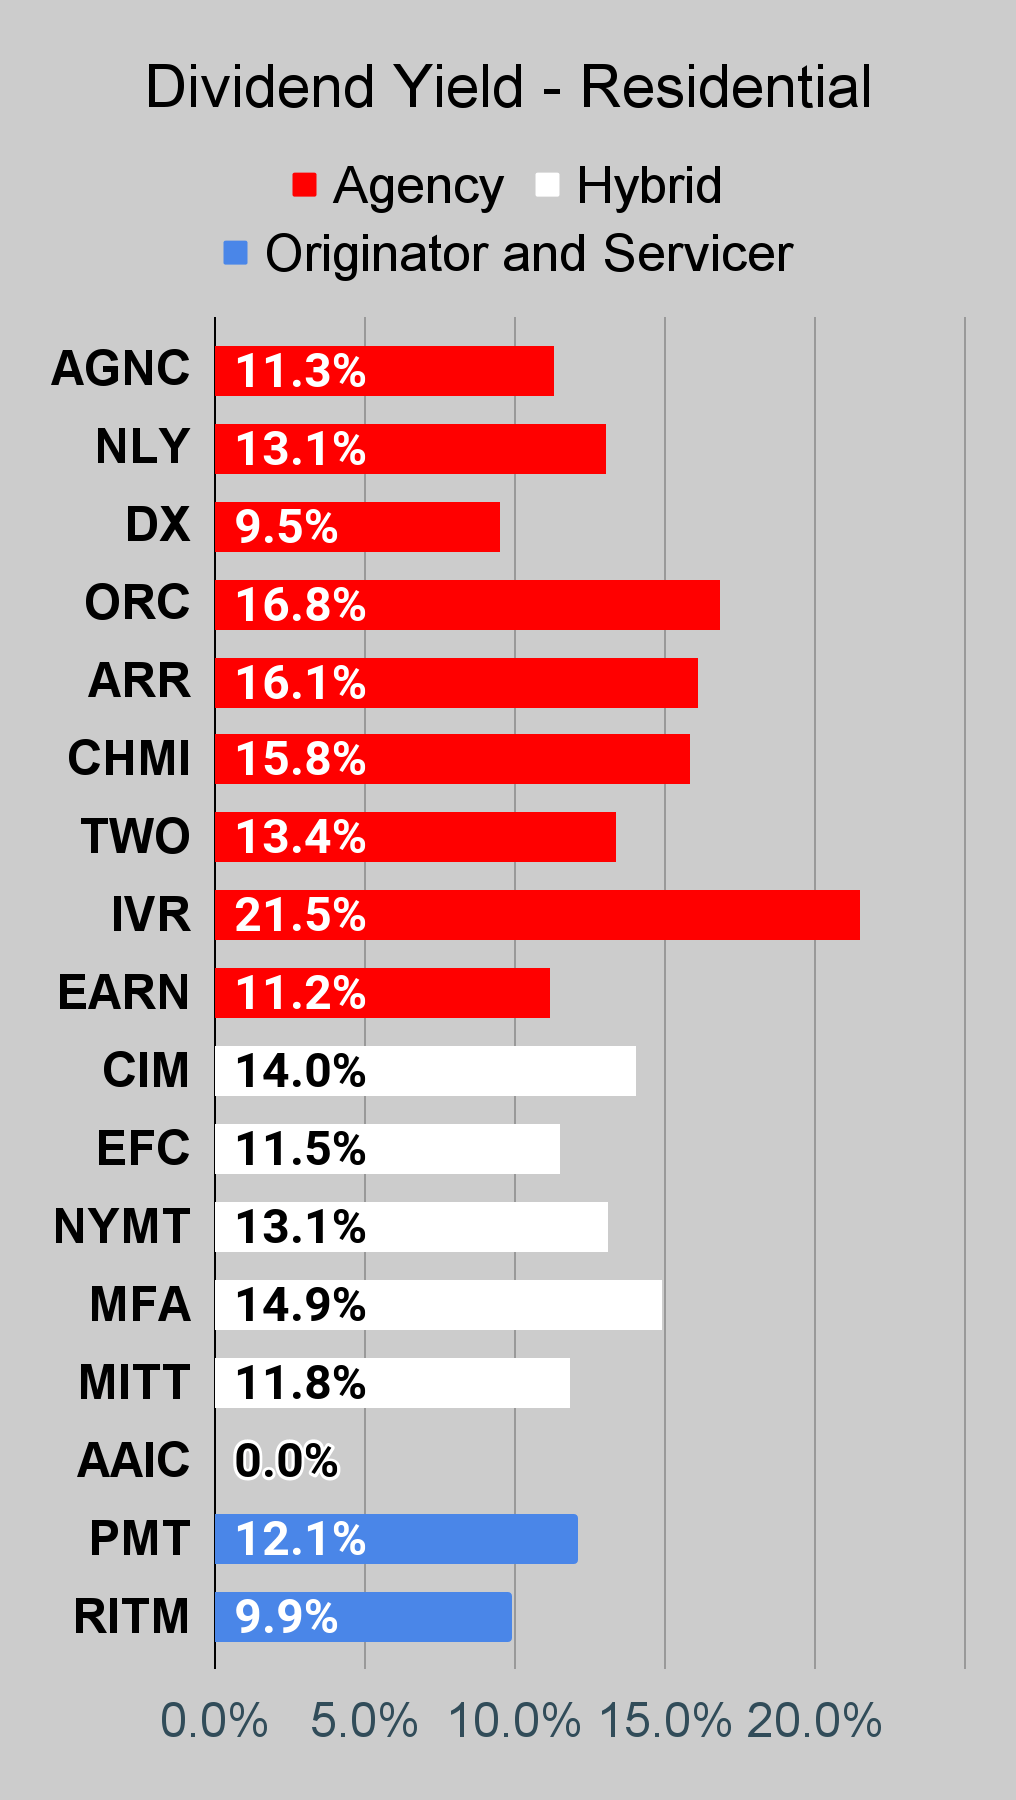
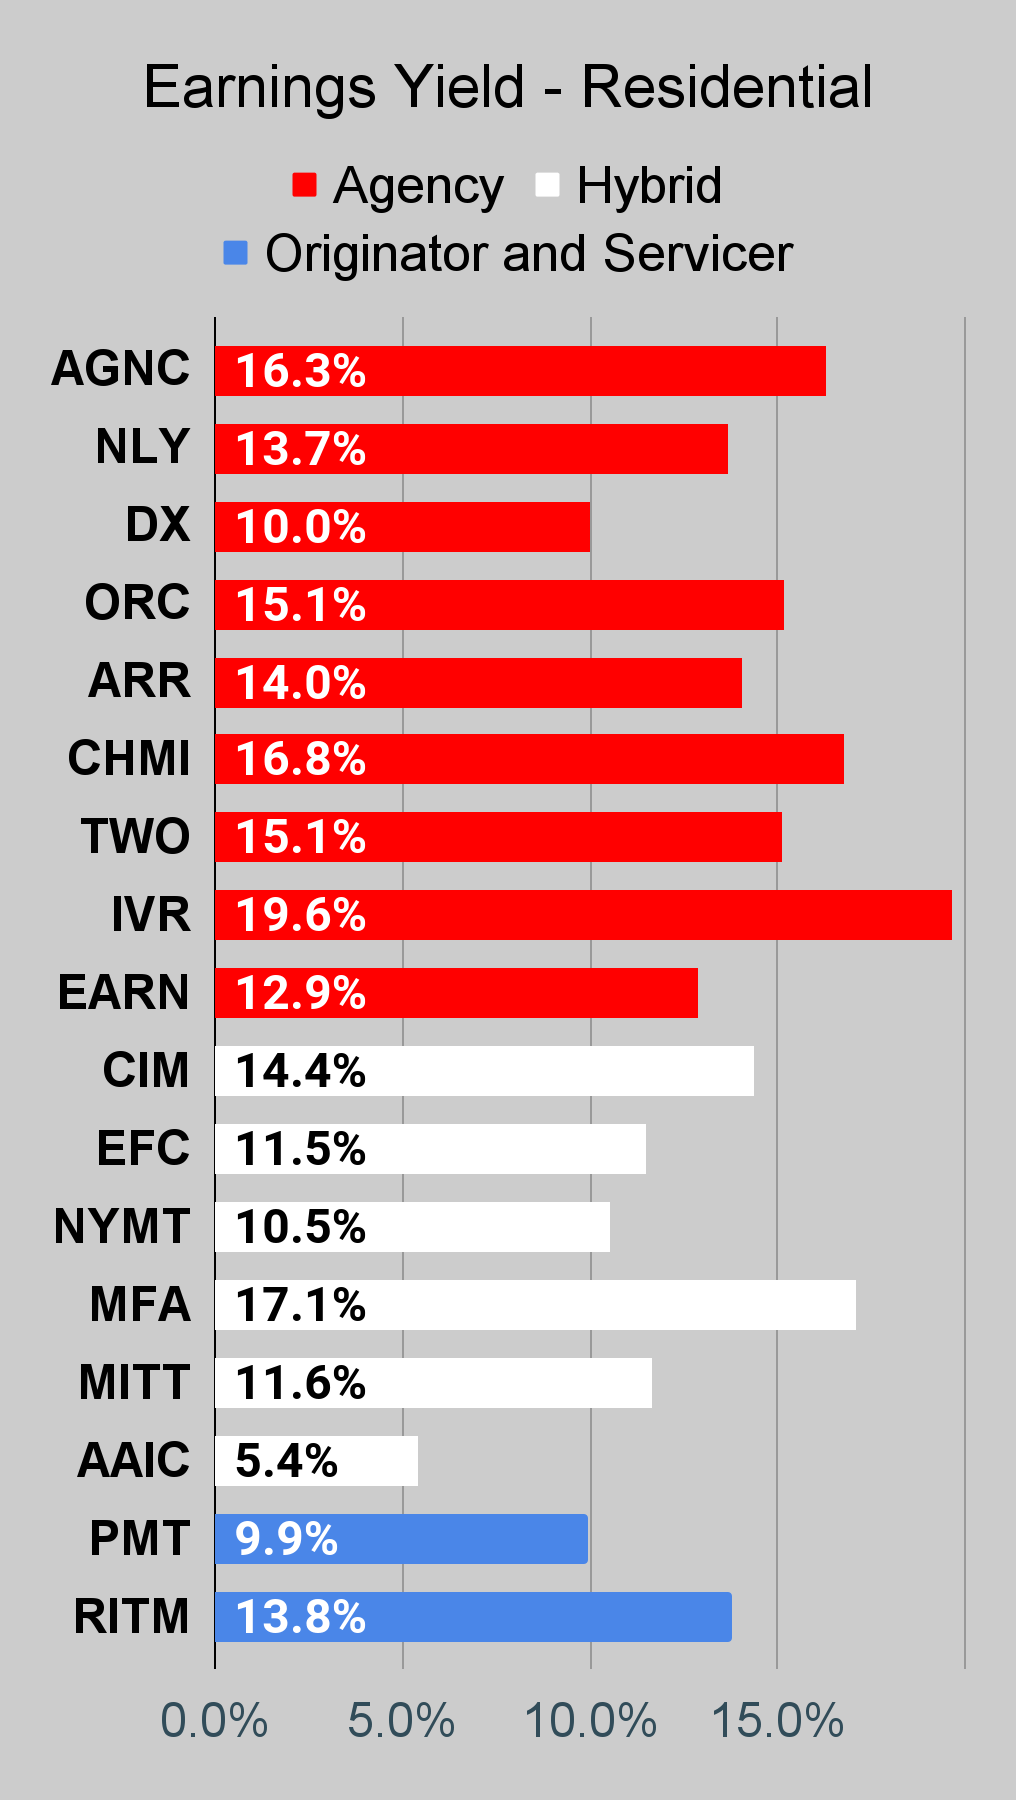
Residential Mortgage REIT Charts
Note: The chart for our public articles uses the book value per share from the latest earnings release. Current estimated book value per share is used in reaching our targets and trading decisions. It is available in our service, but those estimates are not included in the charts below.
 The REIT Forum |
 The REIT Forum |
 The REIT Forum |
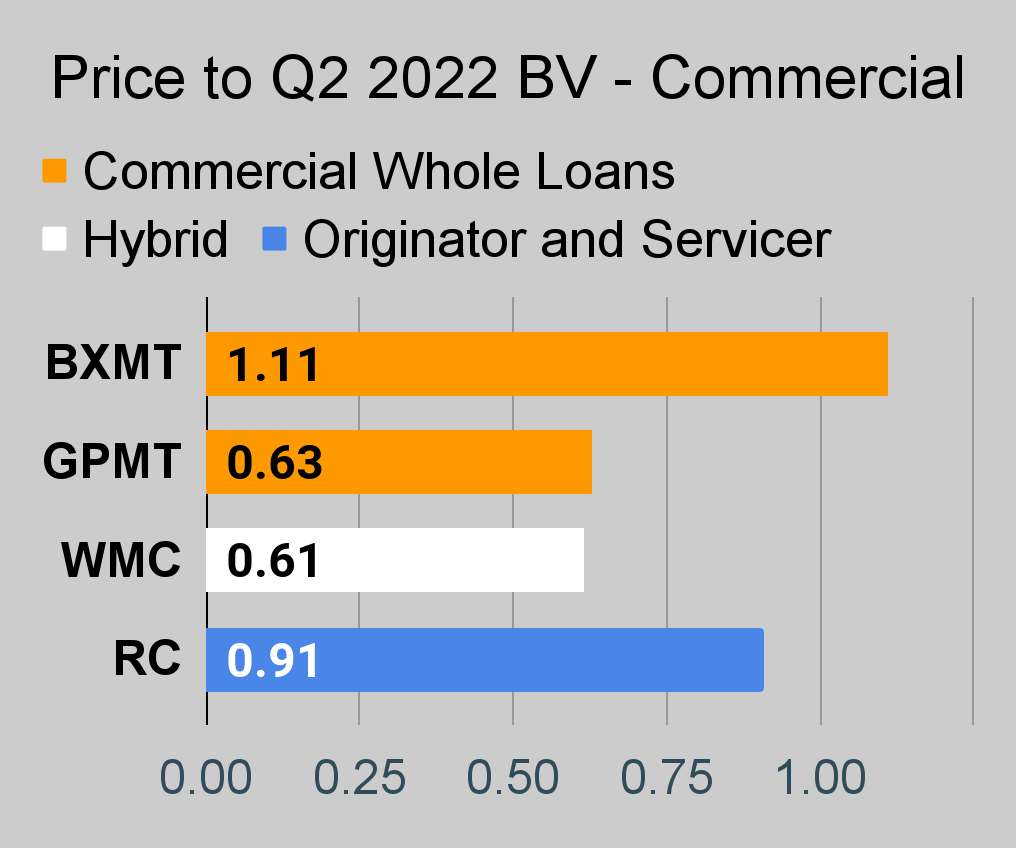
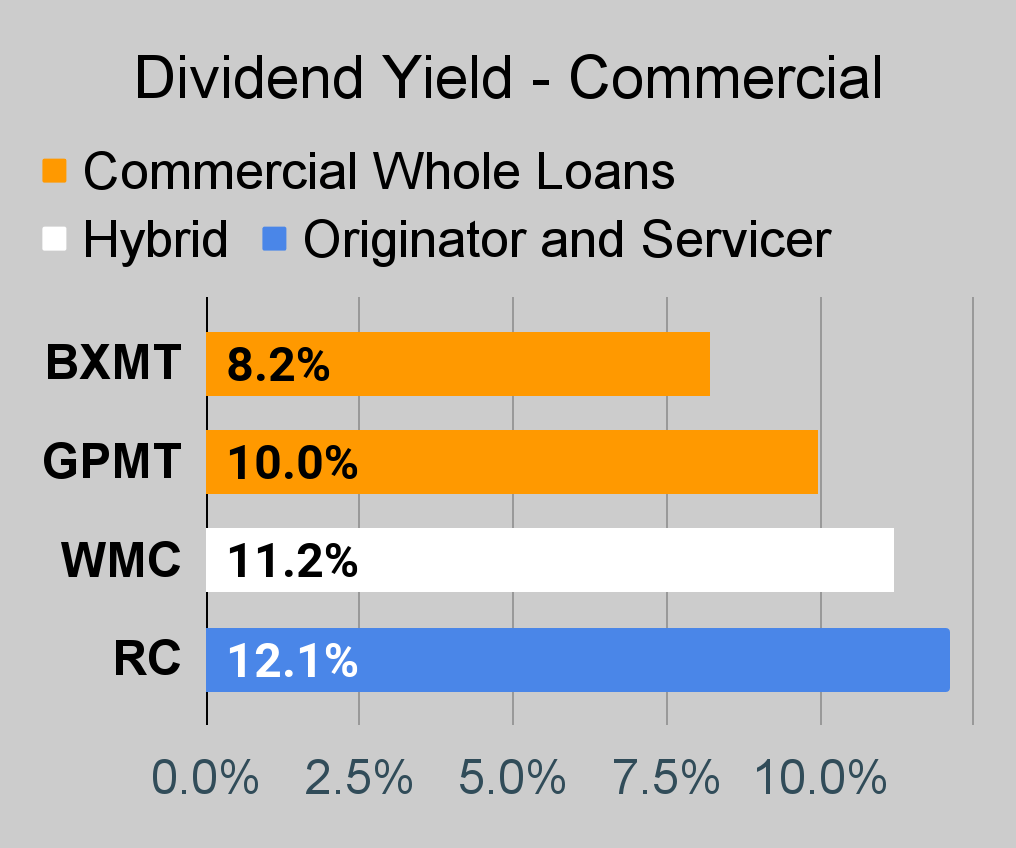
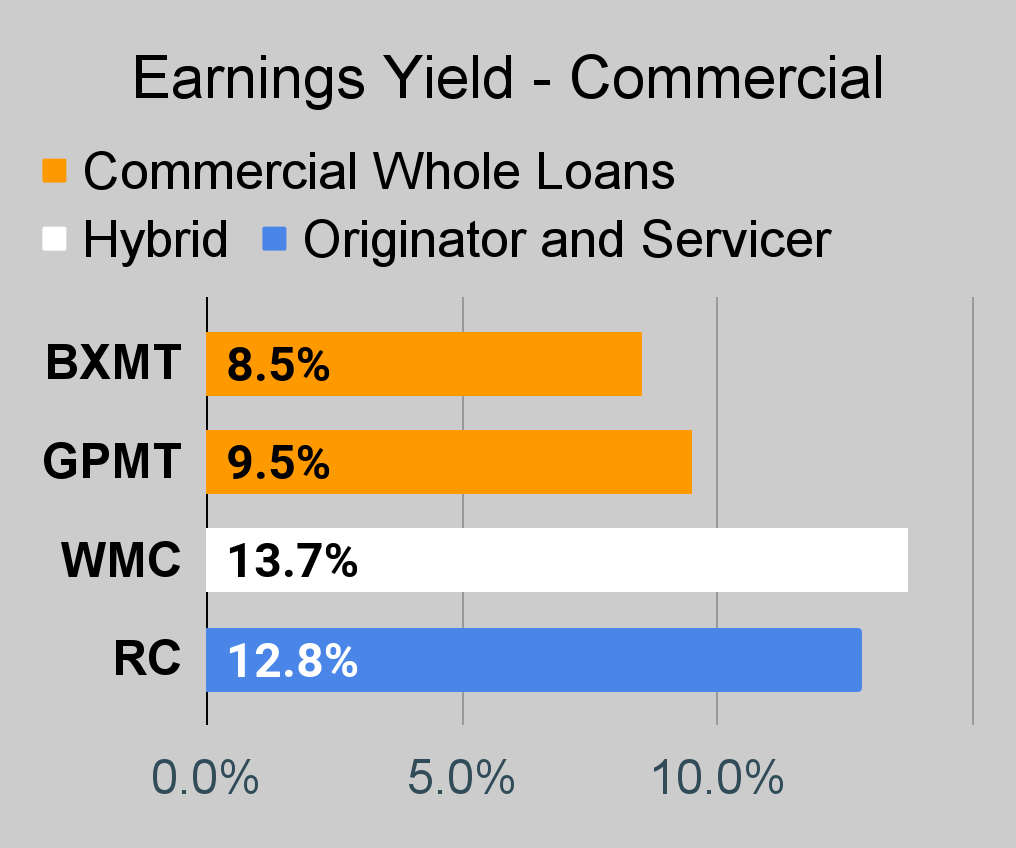
Commercial Mortgage REIT Charts
 The REIT Forum |
 The REIT Forum |
 The REIT Forum |
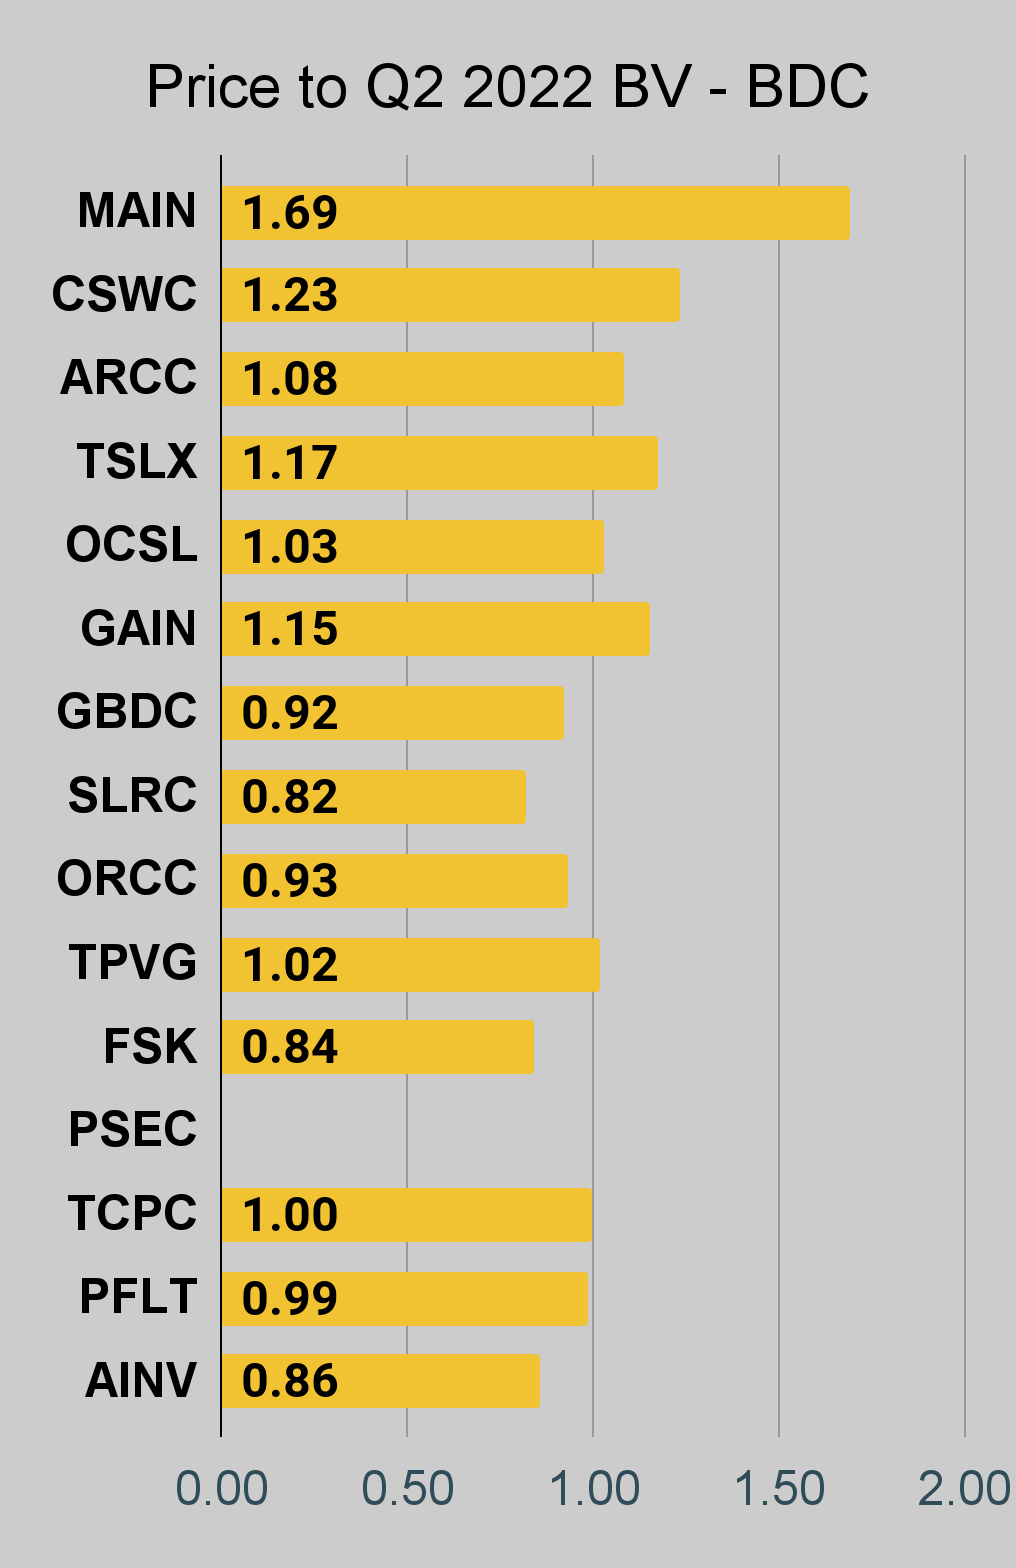
BDC Charts
 The REIT Forum |
 The REIT Forum |
 The REIT Forum |
Preferred Share Charts
 The REIT Forum |
 The REIT Forum |
 The REIT Forum |
 The REIT Forum |
 The REIT Forum |
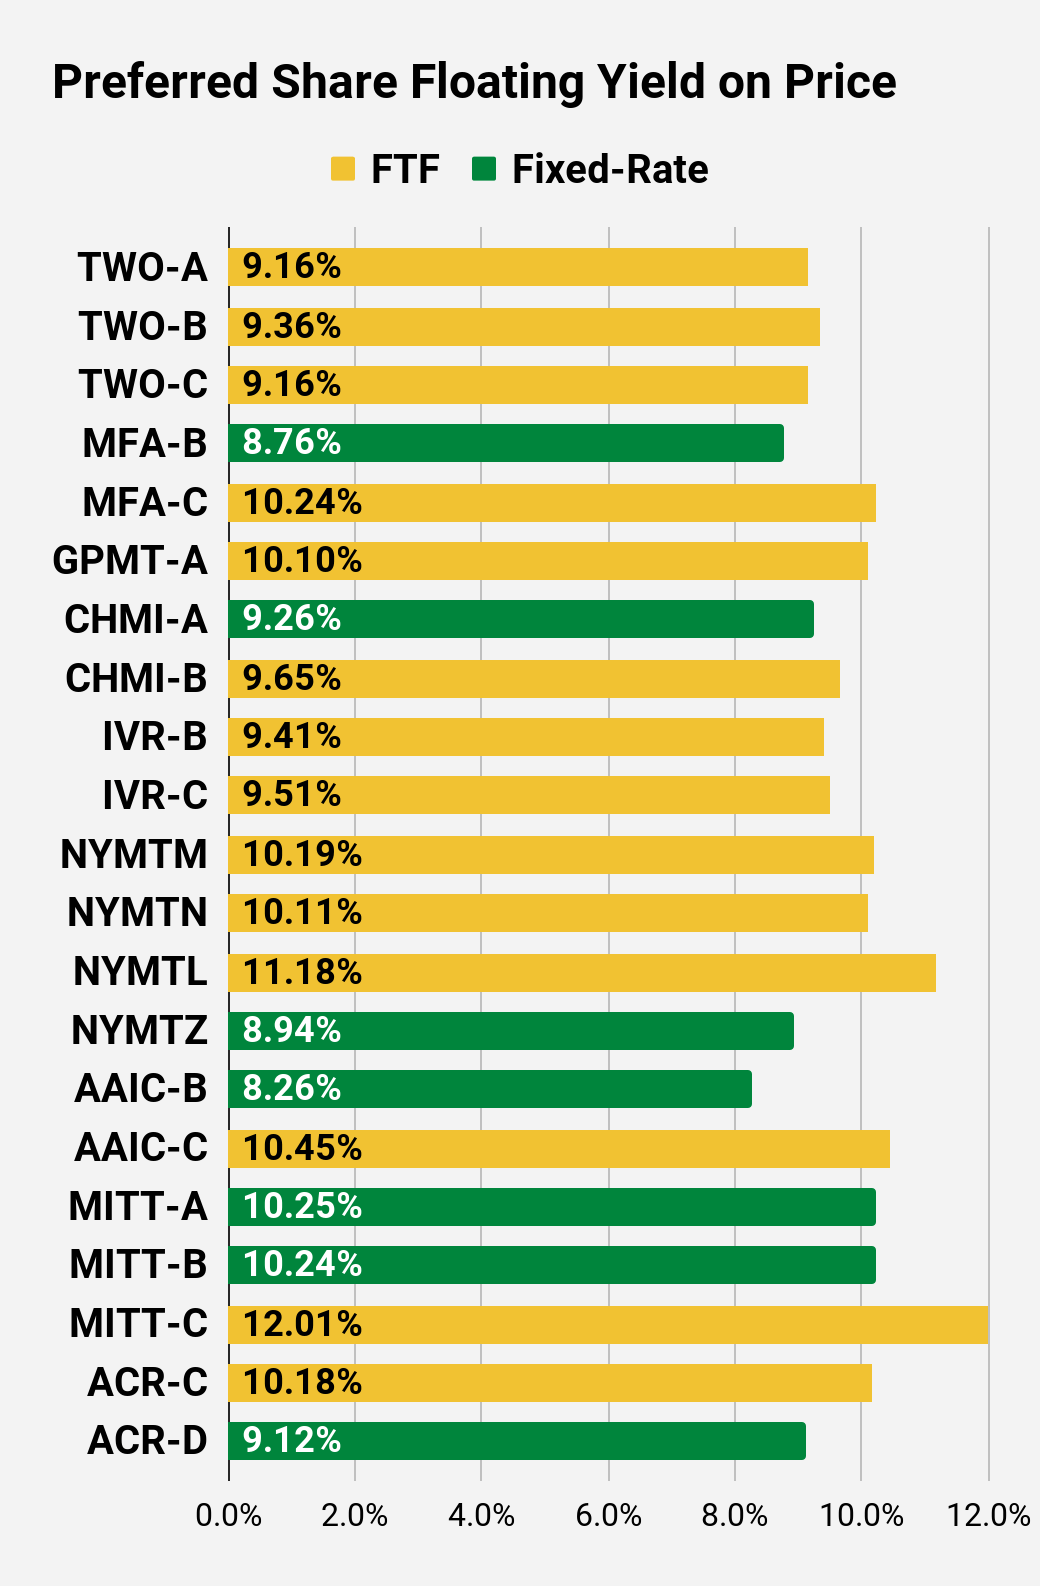 The REIT Forum |
Preferred Share Data
Beyond the charts, we’re also providing our readers with access to several other metrics for the preferred shares.
After testing out a series on preferred shares, we decided to try merging it into the series on common shares. After all, we are still talking about positions in mortgage REITs. We don’t have any desire to cover preferred shares without cumulative dividends, so any preferred shares you see in our column will have cumulative dividends. You can verify that by using Quantum Online. We’ve included the links in the table below.
To better organize the table, we needed to abbreviate column names as follows:
- Price = Recent Share Price – Shown in Charts
- BoF = Bond or FTF (Fixed-to-Floating)
- S-Yield = Stripped Yield – Shown in Charts
- Coupon = Initial Fixed-Rate Coupon
- FYoP = Floating Yield on Price – Shown in Charts
- NCD = Next Call Date (the soonest shares could be called)
- Note: For all FTF issues, the floating rate would start on NCD.
- WCC = Worst Cash to Call (lowest net cash return possible from a call)
- QO Link = Link to Quantum Online Page
Second Batch:
Strategy
Our goal is to maximize total returns. We achieve those most effectively by including “trading” strategies. We regularly trade positions in the mortgage REIT common shares and BDCs because:
- Prices are inefficient.
- Long-term, share prices generally revolve around book value.
- Short-term, price-to-book ratios can deviate materially.
- Book value isn’t the only step in analysis, but it is the cornerstone.
We also allocate to preferred shares and equity REITs. We encourage buy-and-hold investors to consider using more preferred shares and equity REITs.
Performance
We compare our performance against 4 ETFs that investors might use for exposure to our sectors:
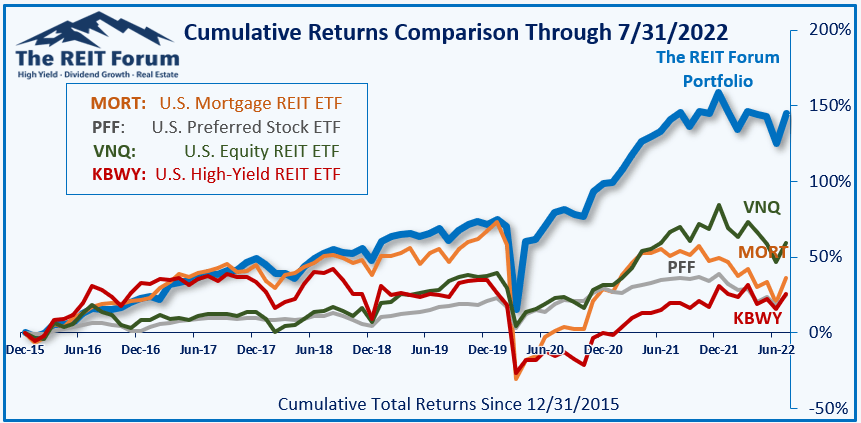
The REIT Forum
The 4 ETFs we use for comparison are:
|
Ticker |
Exposure |
|
One of the largest mortgage REIT ETFs |
|
|
One of the largest preferred share ETFs |
|
|
Largest equity REIT ETF |
|
|
The high-yield equity REIT ETF. Yes, it has been dreadful. |
When investors think it isn’t possible to earn solid returns in preferred shares or mortgage REITs, we politely disagree. The sector has plenty of opportunities, but investors still need to be wary of the risks. We can’t simply reach for yield and hope for the best. When it comes to common shares, we need to be even more vigilant to protect our principal by regularly watching prices and updating estimates for book value and price targets.
Ratings:
- Bullish on preferred shares: CIM-A and MFA-B
- Neutral on preferred share: AAIC-C. However, you can do much better. Shorting these shares for a pair trade simply isn’t viable due to liquidity and costs to borrow.
Be the first to comment