


AlxeyPnferov
The EAFE index (NYSEARCA:NYSEARCA:EFA) is composed of stocks of companies in non-U.S. developed countries. The majority of the holdings are in U.K.- or Europe-based firms (62.9%), with an additional 22% allocated to Japanese companies. The EAFE index has substantially lagged the S&P 500 (SPY) for many years, raising the question of the purported benefits of international diversification. Efficient market theory (EMT) suggests that international diversification should increase the risk-adjusted returns of portfolios. In a truly efficient market, the optimal allocation should be based on a global market-cap weighted allocation. This allocation, tracked by the Vanguard Total World Stock ETF (VT), has returned a total of 8.85% per year over the past decade, as compared to 13.04% per year for the S&P 500 (SPY). VT currently has a 39.6% allocation to non-U.S. equities.
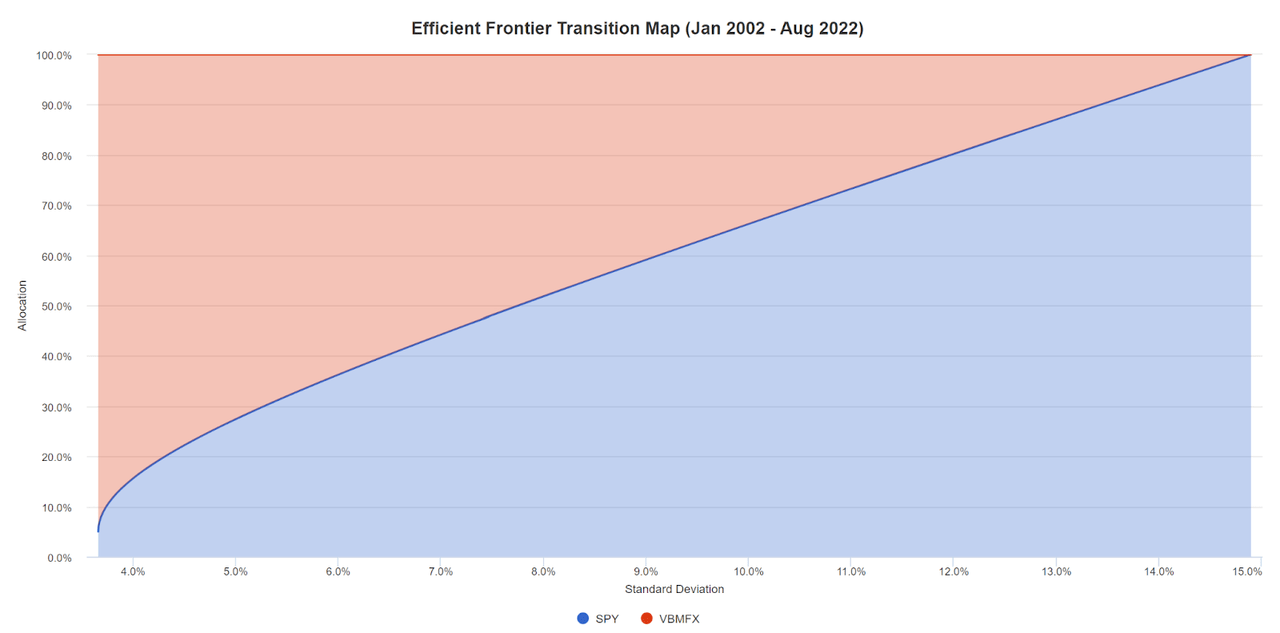
The historical efficient frontier over the last 20 years, including EFA, SPY, and a bond fund, VBMFX, has no allocation to EFA at any risk level. I chose to use VBMFX, the Vanguard Total Bond Market Index fund, for the bond allocation rather than the iShares Core U.S. Aggregate Bond Index ETF (AGG) because the former has a longer history. It is fairly remarkable that excluding the EAFE index from the equity universe is the best choice over a 20+ year period and across risk levels.
Portfolio Visualizer
Three fund efficient frontier using EFA, SPY, and VBMFX above.
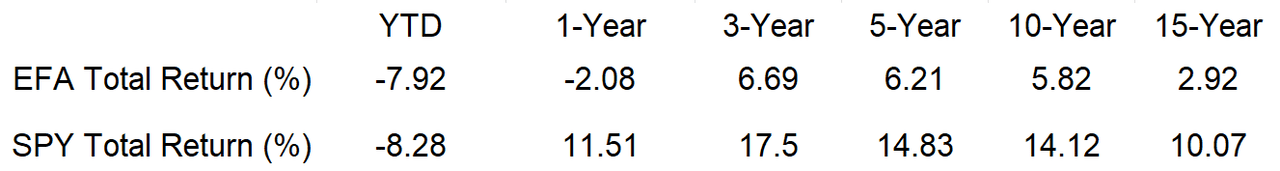
As I noted in an article on EFA from March, the recent years’ performance is dramatically below that of the S&P 500. In the 6 months since this post, the 1-year spread in total return has gotten slightly smaller (13.6% in March vs. 11.8% today), although EFA has underperformed SPY. The total return for EFA from the market close on March 17th is -11.4% vs. -6.2% for SPY (calculated using dividend-adjusted closing prices from Yahoo! Finance).
Morningstar
Trailing total returns for EFA vs. SPY above.
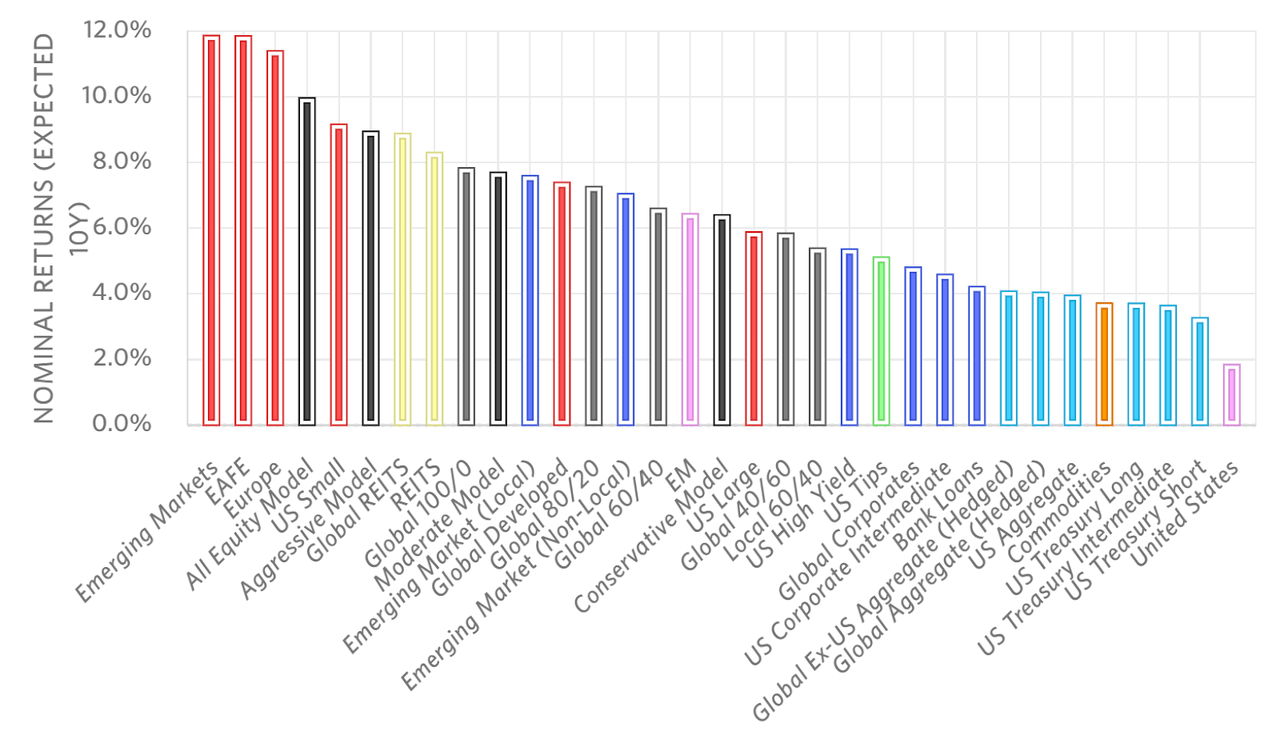
The question of how much to allocate to EFA or a similar international equity index is one of the more important asset allocation decisions. Theory would suggest that, at some point, EFA will be cheap enough that the expected returns will justify an allocation. Fundamental models, such as Research Affiliates’ Asset Allocation Interactive, continue to predict that the EAFE index will substantially outperform the S&P 500 and a wide array of other asset classes in the next 10 years.
Research Affiliates
Research Affiliates valuation-based expected returns for major asset classes above.
The valuation-based argument has supported elevated allocations to international equities for years, however, and the opportunity cost from betting on a reversion to the mean in valuations has been substantial.
Looking ahead, the question of international allocation is a considerable challenge. The soaring energy prices in Europe, along with high overall inflation, pose a considerable threat to British and EU companies. I last wrote about EFA about 6 months ago, on March 17, 2022. At that time, the scale of the economic threat from constrained energy supplies and related dislocations was not yet clear. EFA is substantially overweight industrial stocks as compared to the U.S. and industrials are likely to be disproportionately hurt by high energy prices. On the other hand, the high valuations of many tech stocks, which have a much higher allocation in the S&P 500 than in EAFE and are more sensitive to rising interest rates, has the potential to drive losses in tech relative to other sectors.
Market-Implied Outlook for EFA
One source of guidance for index ETFs is options prices. For SPY, EFA, and a range of other widely-traded ETFs, there are active markets in call and put options. The price of an option on an ETF is largely determined by the market’s consensus estimate of the probability that the ETF’s price will rise above (call option) or fall below (put option) a specific level (the option strike price) between now and when the option expires. By analyzing the prices of call and put options at a range of strike prices, all with the same expiration date, it is possible to calculate a probabilistic price forecast that reconciles the options prices. This is the market-implied outlook. For a deeper explanation and background, I recommend this monograph published by the CFA Institute.
In mid-March, the market-implied outlook for EFA to January of 2023 was generally favorable, although the outlook for SPY was better, on an absolute and risk-adjusted basis. With six months since my analysis, I have updated the market-implied outlook for EFA and SPY and I have compared these, as in my previous analysis.
I have calculated the market-implied outlooks for the 4.3-month period from now until January 20, 2023 and for the 9.1-month period from now until June 16, 2023 for both SPY and EFA, using the prices of call and put options on SPY and EFA that expire on each of these dates.
The standard presentation of the market-implied outlook is a probability distribution of price return, with probability on the vertical axis and return on the horizontal. The dividend yield has been prorated for the period of the outlook and added to the return. The annual dividend yields for EFA and SPY are 4.8% and 1.5%, respectively.

Geoff Considine
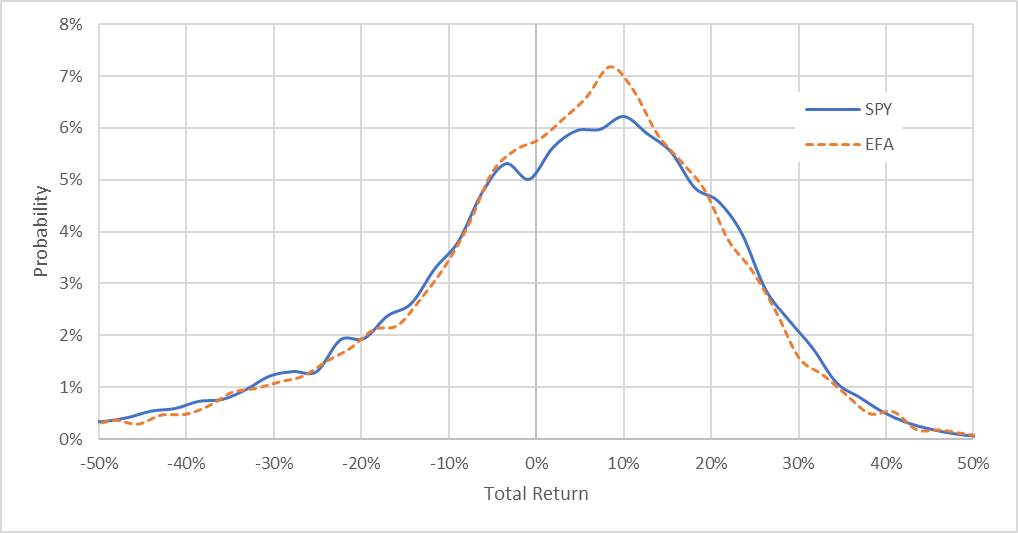
Market-implied total return probabilities for SPY and EFA for the 4.3-month period from now until January 20, 2023 above.
For the outlook to January 20, 2023, the market-implied outlooks for total return are very close to one another, indicating that the options market outlook is for EFA and SPY to have very similar risk and return properties to early 2023. The maximum probability outcome (the mode of the distribution) for EFA is a total return of 7.3% over this period vs. 8.4% for SPY. The expected volatility for EFA for this period is 13.3% vs. 14.0% for SPY. These results are quite different from the market-implied outlooks calculated in mid-March using the same options (expiring in January of 2023). In the March results, the outlook for SPY was significantly more favorable than for EFA.
As a rule of thumb for interpreting the market-implied outlook, I calculate the ratio of the maximum probability return to the volatility. For EFA, this ratio is 55% vs. 60% for SPY. These are favorable results for both EFA and SPY. SPY still has the edge, but the results are closer than they were in March, when the ratio was 45% for EFA and 56% for SPY.
The market-implied outlooks for the 9.1-month period to June 16, 2023 are consistent with those to January of 2023. The maximum-probability total returns for EFA and for SPY over this period are 8.5% and 10.0%, respectively. The volatilities for EFA and SPY are 19.8% and 20.6% (not annualized), respectively. The ratios of the mode return and volatility for EFA and SPY are 43% and 49%, respectively. These are bullish outlooks for both ETFs but SPY still looks slightly more favorable in terms of return and the ratio of return to volatility.
Geoff Considine
Market-implied total return probabilities for SPY and EFA for the 9.1-month period from now until June 16, 2023 above.
Over the years that I have been running the market-implied outlooks for SPY and for EFA, SPY has consistently looked more attractive. The current results continue to indicate that this is the case.
Summary
The updated market-implied outlooks for EFA are favorable to early 2023 and to the middle of 2023. It is surprising that the outlook for EFA continues to look solid, albeit less than SPY, given the surging inflation in the EU and Britain, particularly in energy commodities, and the risk that supply constraints due to Russia’s massive reduction in gas sales could drive the region into a recession. On the other hand, the growing spread in valuations between the S&P 500 and EAFE supports the expectation for higher returns from EAFE. Research Affiliates’ valuation-based model projects that EAFE will return an average of almost 6% per year more than large-cap U.S. equities over the next 10 years. After years of underperformance, the options market is indicating that the odds may be starting to shift in EFA’s favor.
Be the first to comment