

Torsten Asmus/iStock via Getty Images
Thesis
As top-down investors, we first monitor the overall conditions of different asset classes (mainly cash, bonds, commodities, equity, and REITs). Once we identify an attractive asset class or sector, we then dig in and look for specific opportunities. The specific tools we use are a few simple dashboards as detailed in our earlier articles, and these dashboards (coded as Google sheets) are available for downloads via this link: Market Sector Dashboard.
Our key observation this month is that the current risk-free interest rates have pushed the yield spread (“YS”) relative between equity and bonds to the negative territory across all equity sectors as you can see from the following screenshot of our dashboard. To wit, with 10-year treasury bond yielding hovering around 4% (3.77% As of this writing), all major market sectors now feature a negative YS Z-score as seen. Even the most attractive sector, the energy sector, features a YS Z-score of -0.58 against the 10-year treasury bond rates. And moreover, conventional “safe haven” sectors such as communication services and utilities now are the most unsafe sector in terms of their most negative YS Z-score.
As such, we see bond price corrections approaching an end and the relative risk premium of bonds relative to equity at an attractive level now. The remainder of this article will elaborate on our thinking using two bond ETFs: the iShares Core U.S. Aggregate Bond ETF (NYSEARCA:AGG) and iShares 20+ Year Treasury Bond ETF (NASDAQ:TLT).
Source: Author based on Seeking Alpha data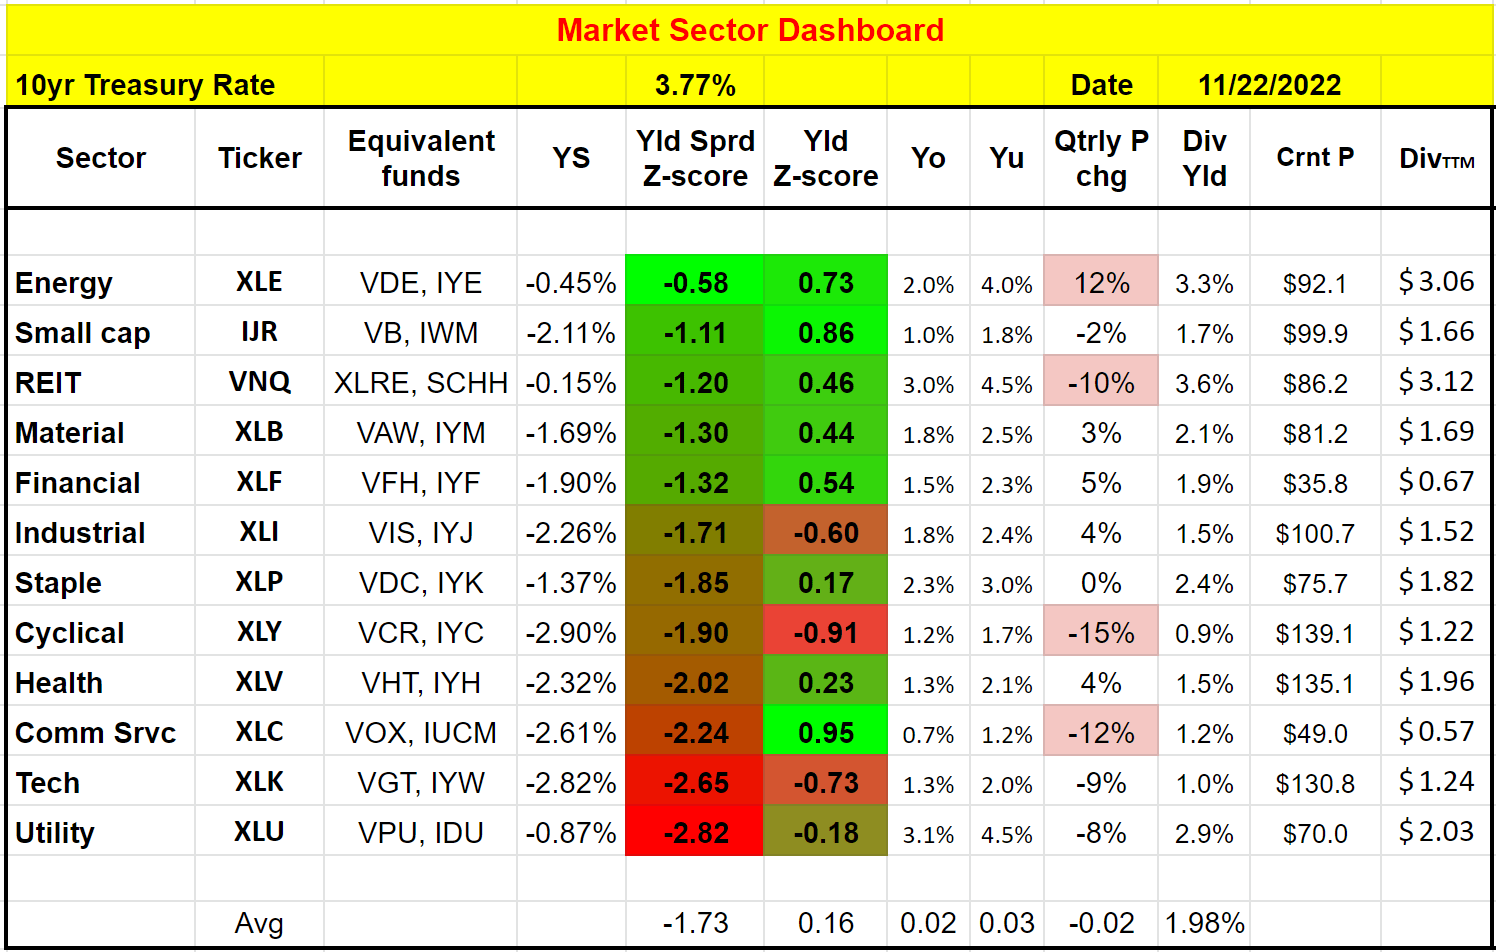
Bonds dashboard
As aforementioned, we have a few simple dashboards and the next one is the one we use to monitor the various bonds. Details of this dashboard are provided in our blog article and it is available for download at the same link also. A few highlights:
- All the yield spreads are benchmarked against the 10-year Treasury bond yield.
- The larger the yield spread Z-score (i.e., the greener the color), the more undervalued a bond is relative to the 10-year treasury bonds according to their long-term historical records, and vice versa.
As seen, intermediate treasury bonds (represented by VGIT) are the most attractive category now in terms of the YS. They provide the most positive YS Z-score of 1.34 currently. Hope this is intuitive and straightforward. If we get about the yield (all a bit below 4.0% under current conditions) for lending money out for 20 years, or 10 years, or 5 years, I will surely prefer a shorter lending period. And this is why our portfolio holds a good amount of VGIT as to be detailed later.
But let me not get ahead of myself too much. And let me first discuss the implication of these results on AGG and TLT first.
Source: Author based on Seeking Alpha data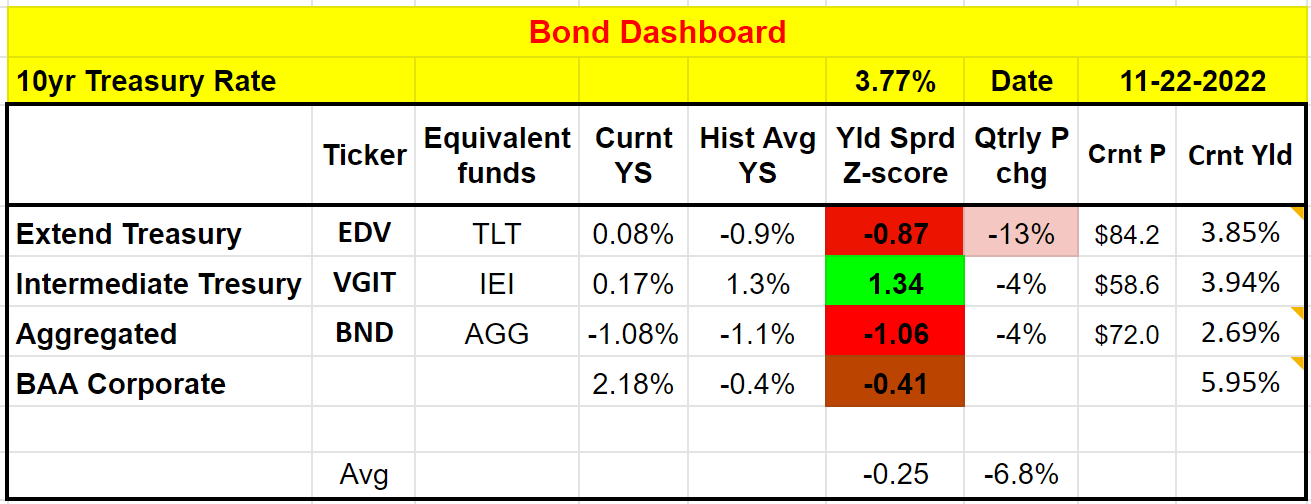
AGG and TLT: basic information
Both AGG and TLT are popular funds from the iShares family, especially in the bond space. AGG boasts an AUM of $76B as seen in the chart below provided by Seeking Alpha. It charges a rock-bottom low fee of 0.03%. In contrast, TLT is much small in relative terms, but still a sizable fund with an AUM of $24B in absolute terms. Although TLT has a 0.15% expense ratio, 5x higher than AGG. The more fundamental differences are in their exposure and duration, as to be discussed next.
Source: Seeking Alpha data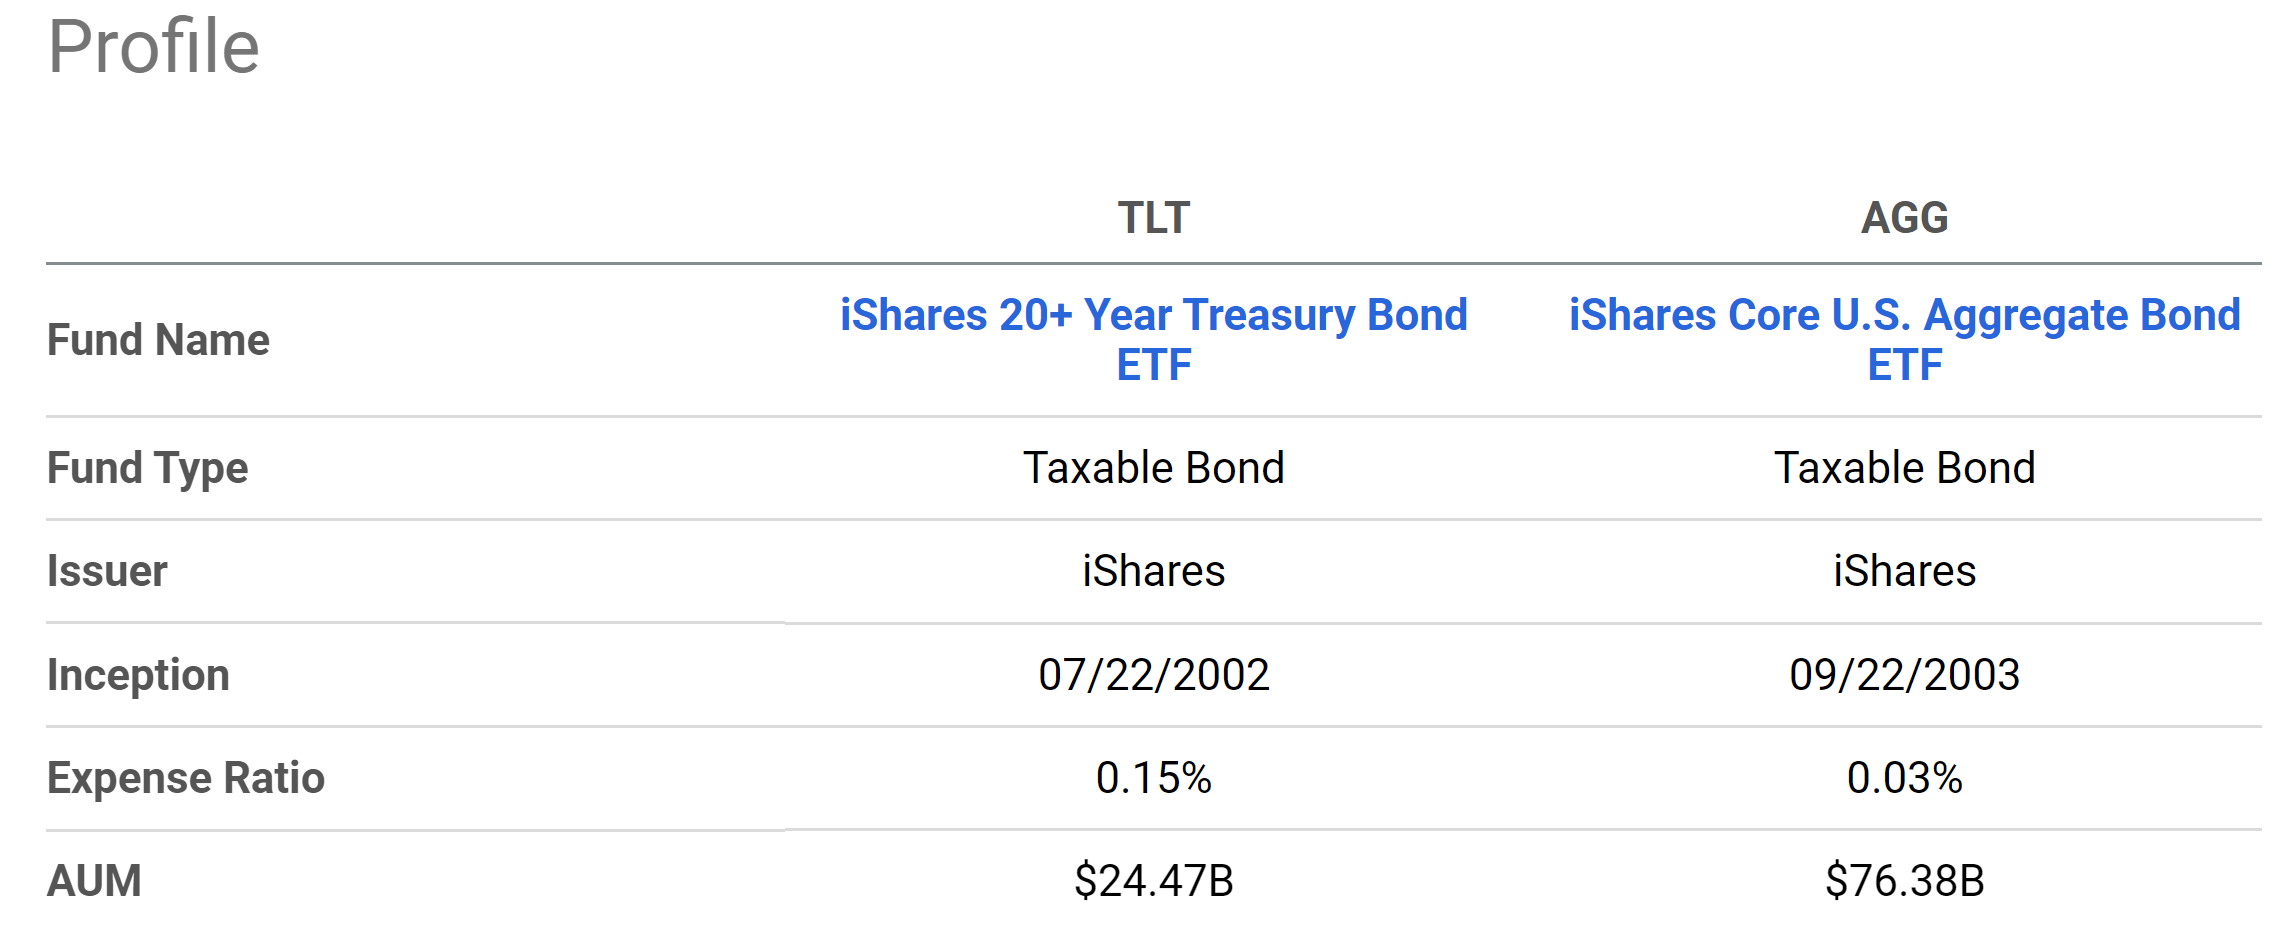
TLT and AGG: credit exposure
According to the fund descriptions (slightly edited with the emphases added by me):
- The iShares 20+ Year Treasury Bond ETF (TLT) seeks to track the investment results of an index composed of U.S. Treasury bonds with remaining maturities greater than twenty years.
- The iShares Core U.S. Aggregate Bond ETF (AGG) seeks to track the investment results of an index composed of the total U.S. investment-grade bond market.
As a result, AGG holds a large number of bonds (more than 10k as of this writing). Because it invests in ALL the investment-grade bonds, encompassing both corporate and treasury bonds. Its large number of holdings is needed to represent the credit risk in the entire bond space, ranging from AAA (about 71.7% of its holdings) all the way to BBB (about 14% of its holdings). In comparison, TLT invests only in treasury bonds (99.7% of its assets). And as a result, it only needs a small sample of the funds – mostly to reach the target duration. TLT only has 34 holdings as of this writing, simply because the credit risk in one treasury bond is the same as all treasury bonds.
Source: iShares data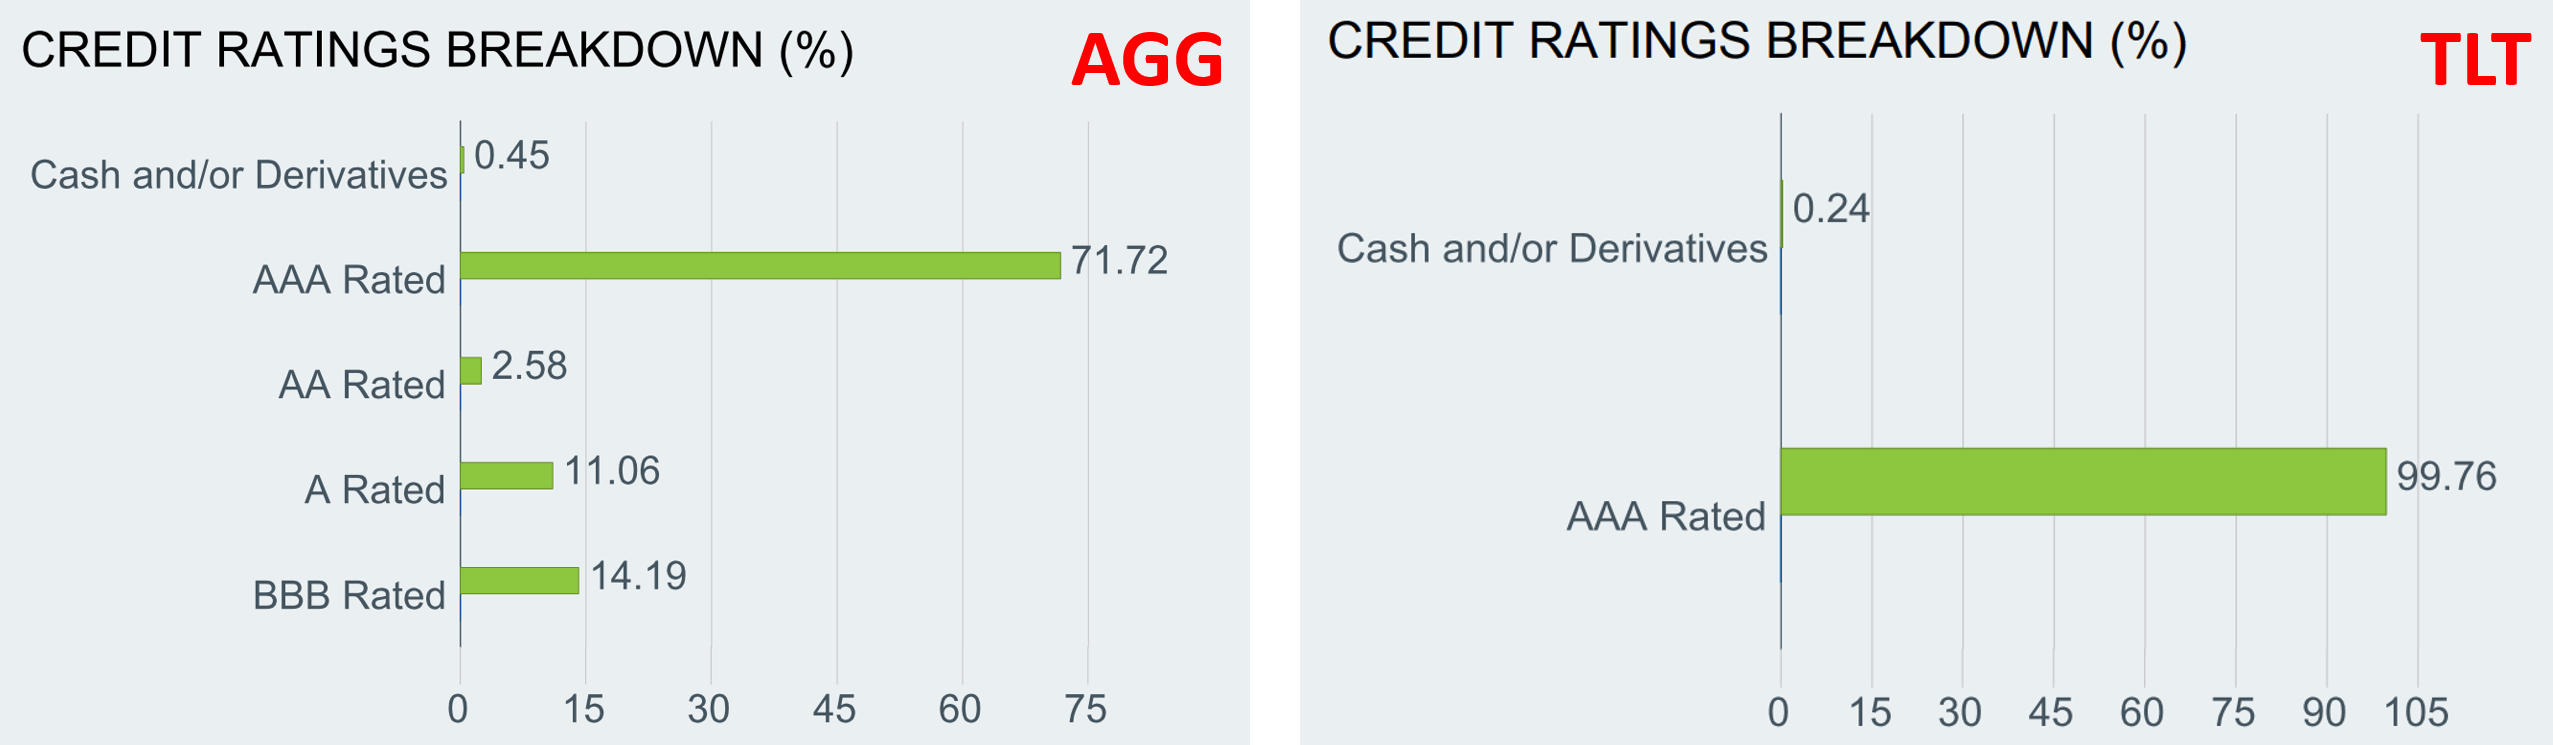
AGG and TLT: duration and interest rate sensitivity
The next crucial difference lies in the effective durations and interest rate sensitivity. A bit of bond 101 and more details are in our blog article:
The price of a bond changes more sensitively as a function of yield when its maturity is longer (with everything else being equal such as coupon rates). Also, the Fed controls the interest rates in the short-term (like 2 months to about 2 years), but not long-term bond yields. The market dynamics decide the yields for bonds with longer durations. The interest rates can drive changes in bond rates but are not identical to bond yields, a key point we will revisit later.
And for a bond ETF, the Effective Duration is the key variable that determines its effective maturity. As seen from the chart below, AGG holds a collection of bonds with different maturities, ranging from cash (0 duration) to 20+ years. Once all these holdings are averaged, the effective duration for AGG is about 6.32 years currently, and hence it is an intermediate bond ETF. In comparison, TLT only holds bonds with 20+ plus years of maturity (with a bit of cash). And its effective duration is 17.32 years as of this writing. And that’s it is considered a long-term (or extended term) bond ETF.
Source: iShares data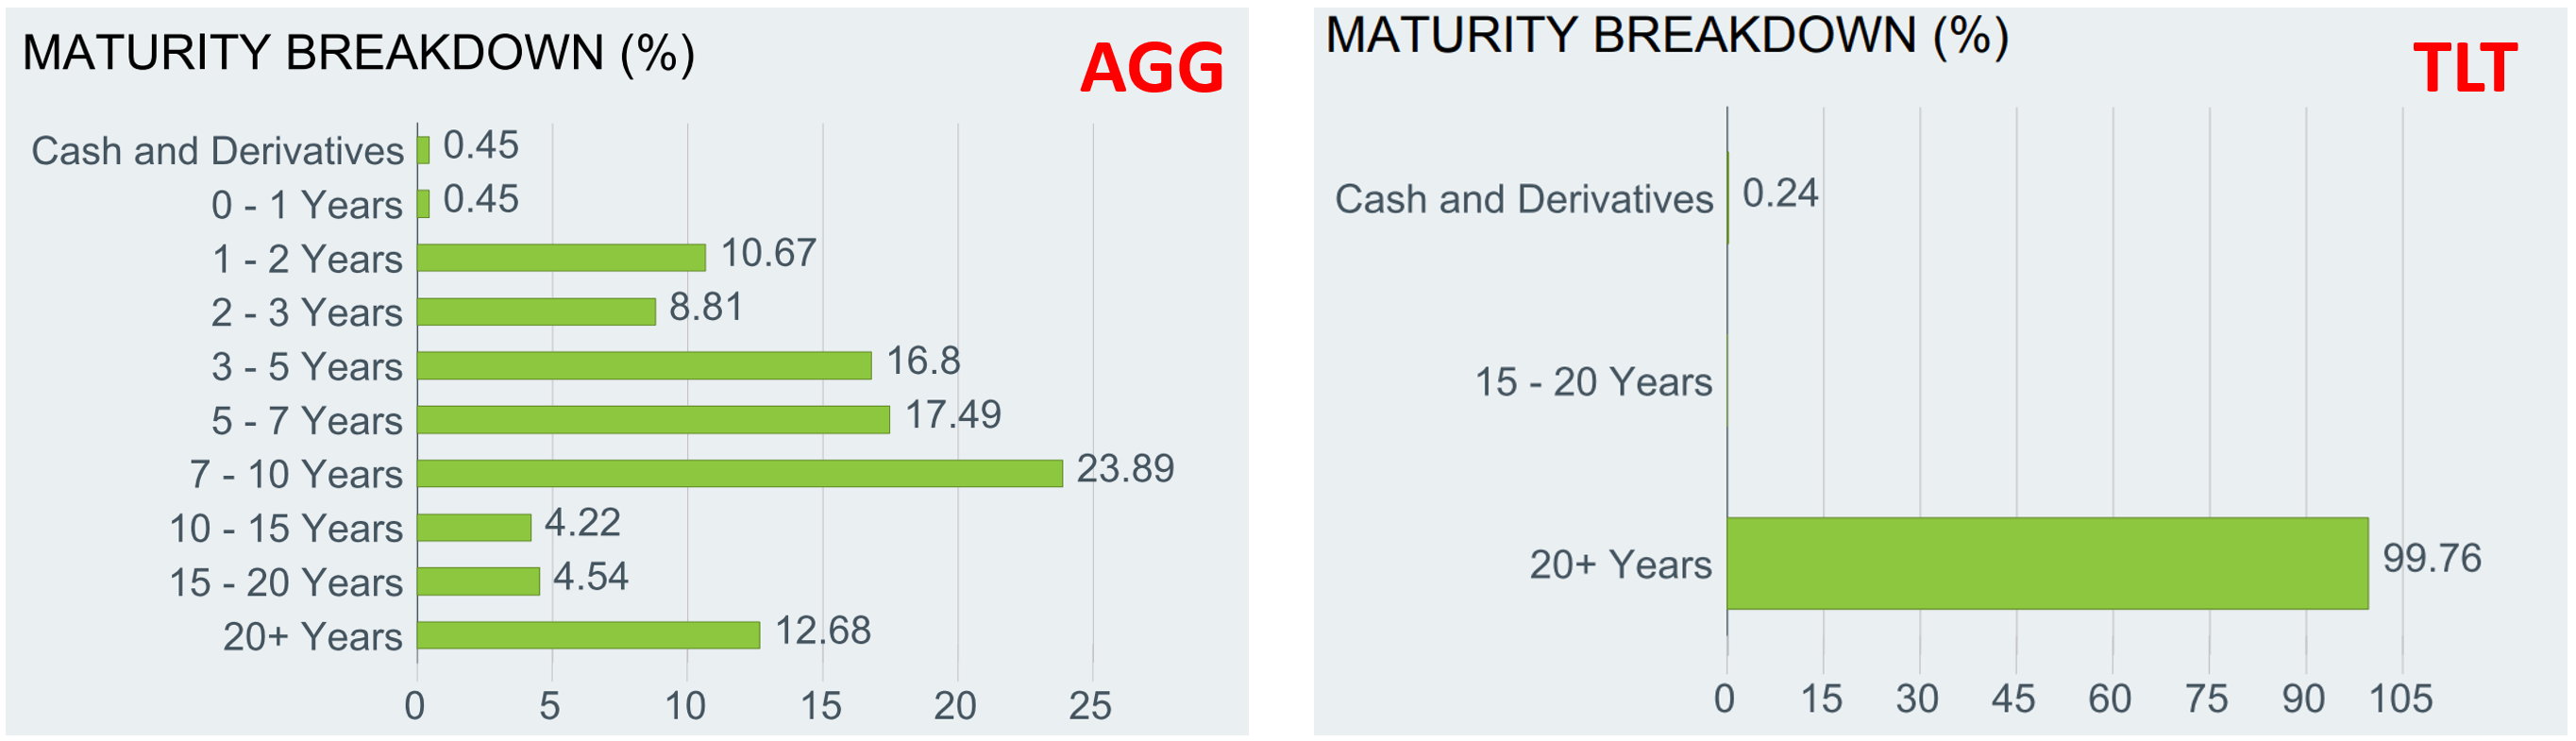
The next two charts show the price sensitivity of AGG and TLT, illustrating their responses to interest rate changes. The first chart was made for AGG, using its effective duration quoted above and its weighted average coupon rates of 2.66% taken from the iShares website. As you can see, its price will decline if yield increases and vice versa. To be specific, as highlighted in the green box, if the yields further climb to 5.0% from the current level, AGG would suffer a price decline of about 1.8%. And AGG would provide 2.66% of coupon payments per year to either partially or completely offset this price decline (depending on how quickly the yields go up). On the other hand, if the yield decrease to 3.5%, AGG investor would enjoy a 9.8% price appreciation plus the 2.66% coupons per year.
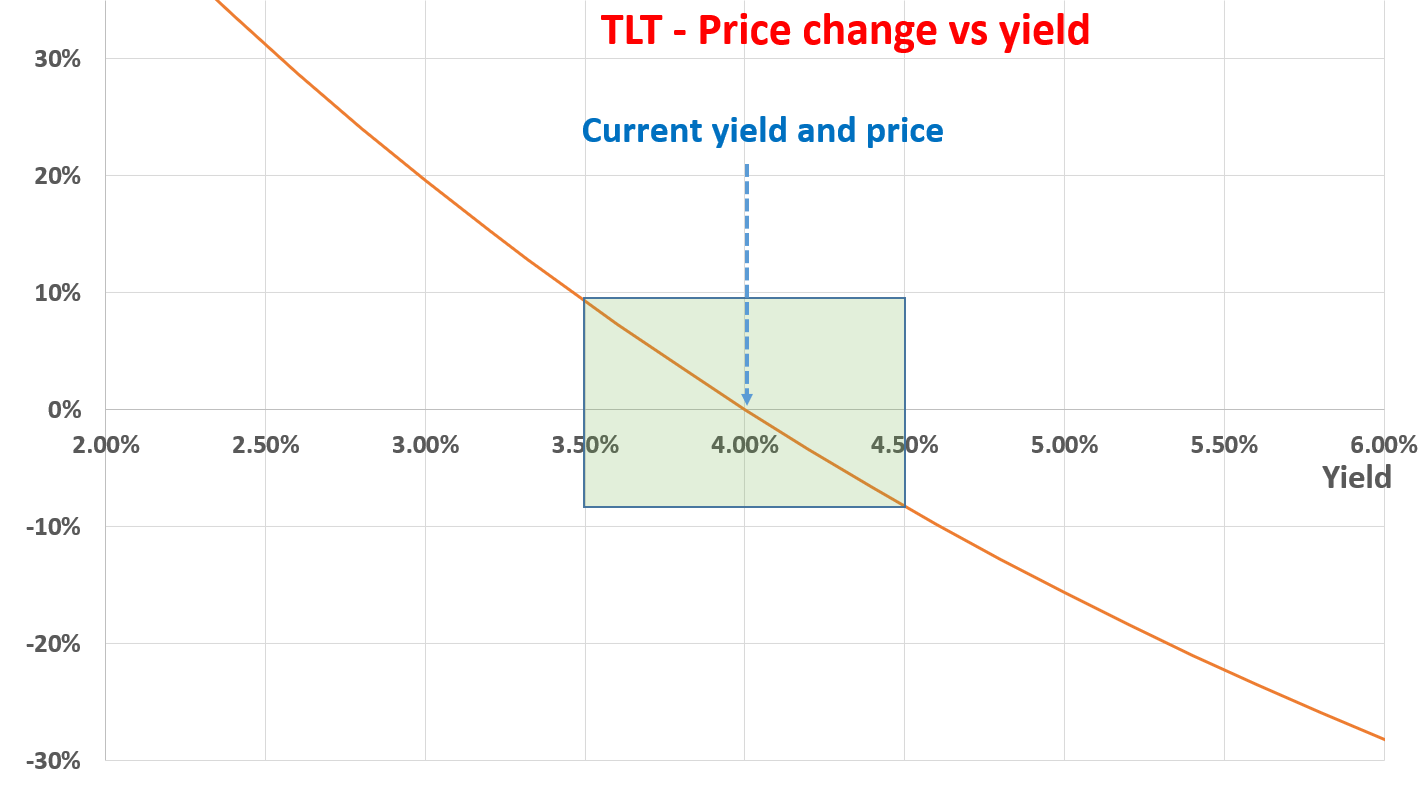
The 2nd chart displays the price response of TLT with respect to yield changes. The trend is similar, but the responses are much more sensitive now because TLT has a much longer effective maturity. As highlighted in the green box again, if the yield climbs slightly to 4.5% from the current 4% level, TLT would suffer a price decline of ~8.2%. Part of the decline will be compensated by the coupon (2.41% per year as of this writing). On the other hand, if its yield retreats back to 3.5%, TLT would enjoy a price appreciation of ~10% (plus the 2.41% coupons per year).
And in both cases, the green boxes represent my anticipated bond rates for AGG (or intermediate aggregated bonds in general) and TLT (or long-term bonds in general). As argued in our earlier article:
At a very fundamental level, in the long term, treasury bond rates cannot rise above long-term inflation or GDP growth. Our government has been relying on inflation and GDP expansion to inflate away and outgrowth its debt obligations for decades in the past. And it will (it will have to) continue doing so.
As a result, I view the current ~4% yields close to the long-term target rates already. And I see the future return/risk profile as asymmetric as visually displayed in the green boxes on both charts.
Source: Author based on Seeking Alpha data Source: Author based on Seeking Alpha data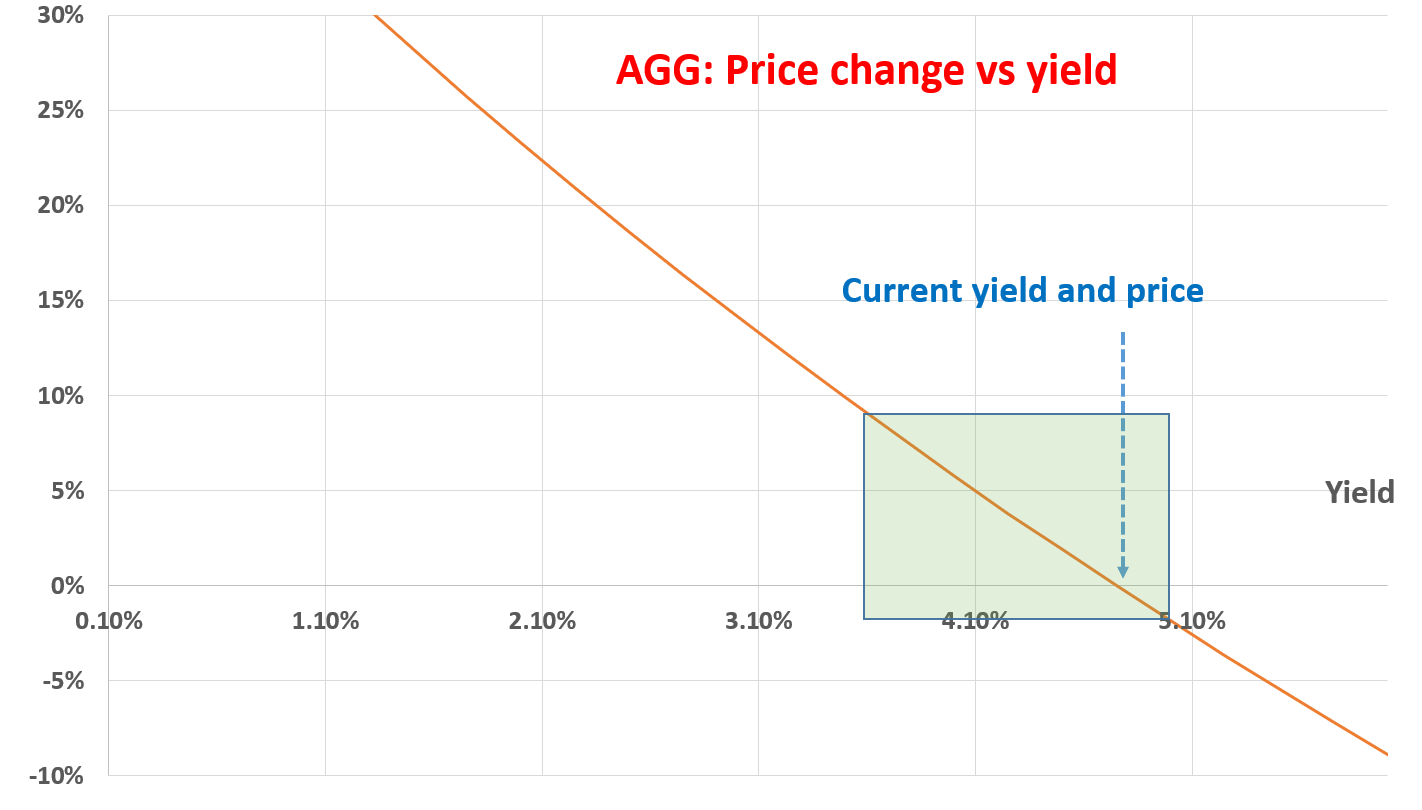
Risks and final thoughts
Finally, risks. For TLT, the risks are mostly interest rates because it holds only treasury bonds. The interest rates could hike higher (for example, if new inflation data turn out to be hotter than expected) and further drive down TLT prices. For AGG, the risks include both interest rates and credit risks as mentioned above. Also note that Bond ETFs are different from bonds. As detailed in our blog article:
Bond ETFs are NOT fixed-income instruments because there is no guarantee that you will receive the principal back at maturity. Or to put it in another way, bonds ETFs do not ever mature. Thus, depending on your financial goals, you should choose either bonds or bond ETFs correspondingly.
To conclude, we view the yield spread against risk-free rates as a simple, yet timeless, concept to decide the allocation of different asset classes. Such allocation decisions include both the allocation between different asset classes (such as bond vs equity) and also with a given asset class (such as long-term vs intermediate-term, corporate vs treasury). Under current conditions, we see treasury bonds provide attractive return/risk profiles now as the risk-free rates hover around 4%. We especially like the intermediate treasury bonds (represented by VGIT) due to the YS discussed above. AGG is attractive too, but I like a pure treasury bond ETF now for two reasons. First, treasury bonds offer better diversification relative to other asset classes. And second, I do not see cooperate bonds as attractive enough yet. If you recall from the bond dashboard earlier, aggregated bonds currently feature the most negative YS Z-score (-1.06).
And our actual holdings are shown in the chart below. We hold EDV as our extended-durations treasury bonds instead of TLT because of EDV’s lower expense ratios. We adjust our holding monthly at the mid of each month. And as of our November 15 adjustment, we are currently allocating 11.1% of our portfolio to VGIT and 15.2% to EDV. We will keep monitoring the bond yields and equity valuation and provide another update when we see a large change in the fundamental dynamics.
Source: Author based on Seeking Alpha data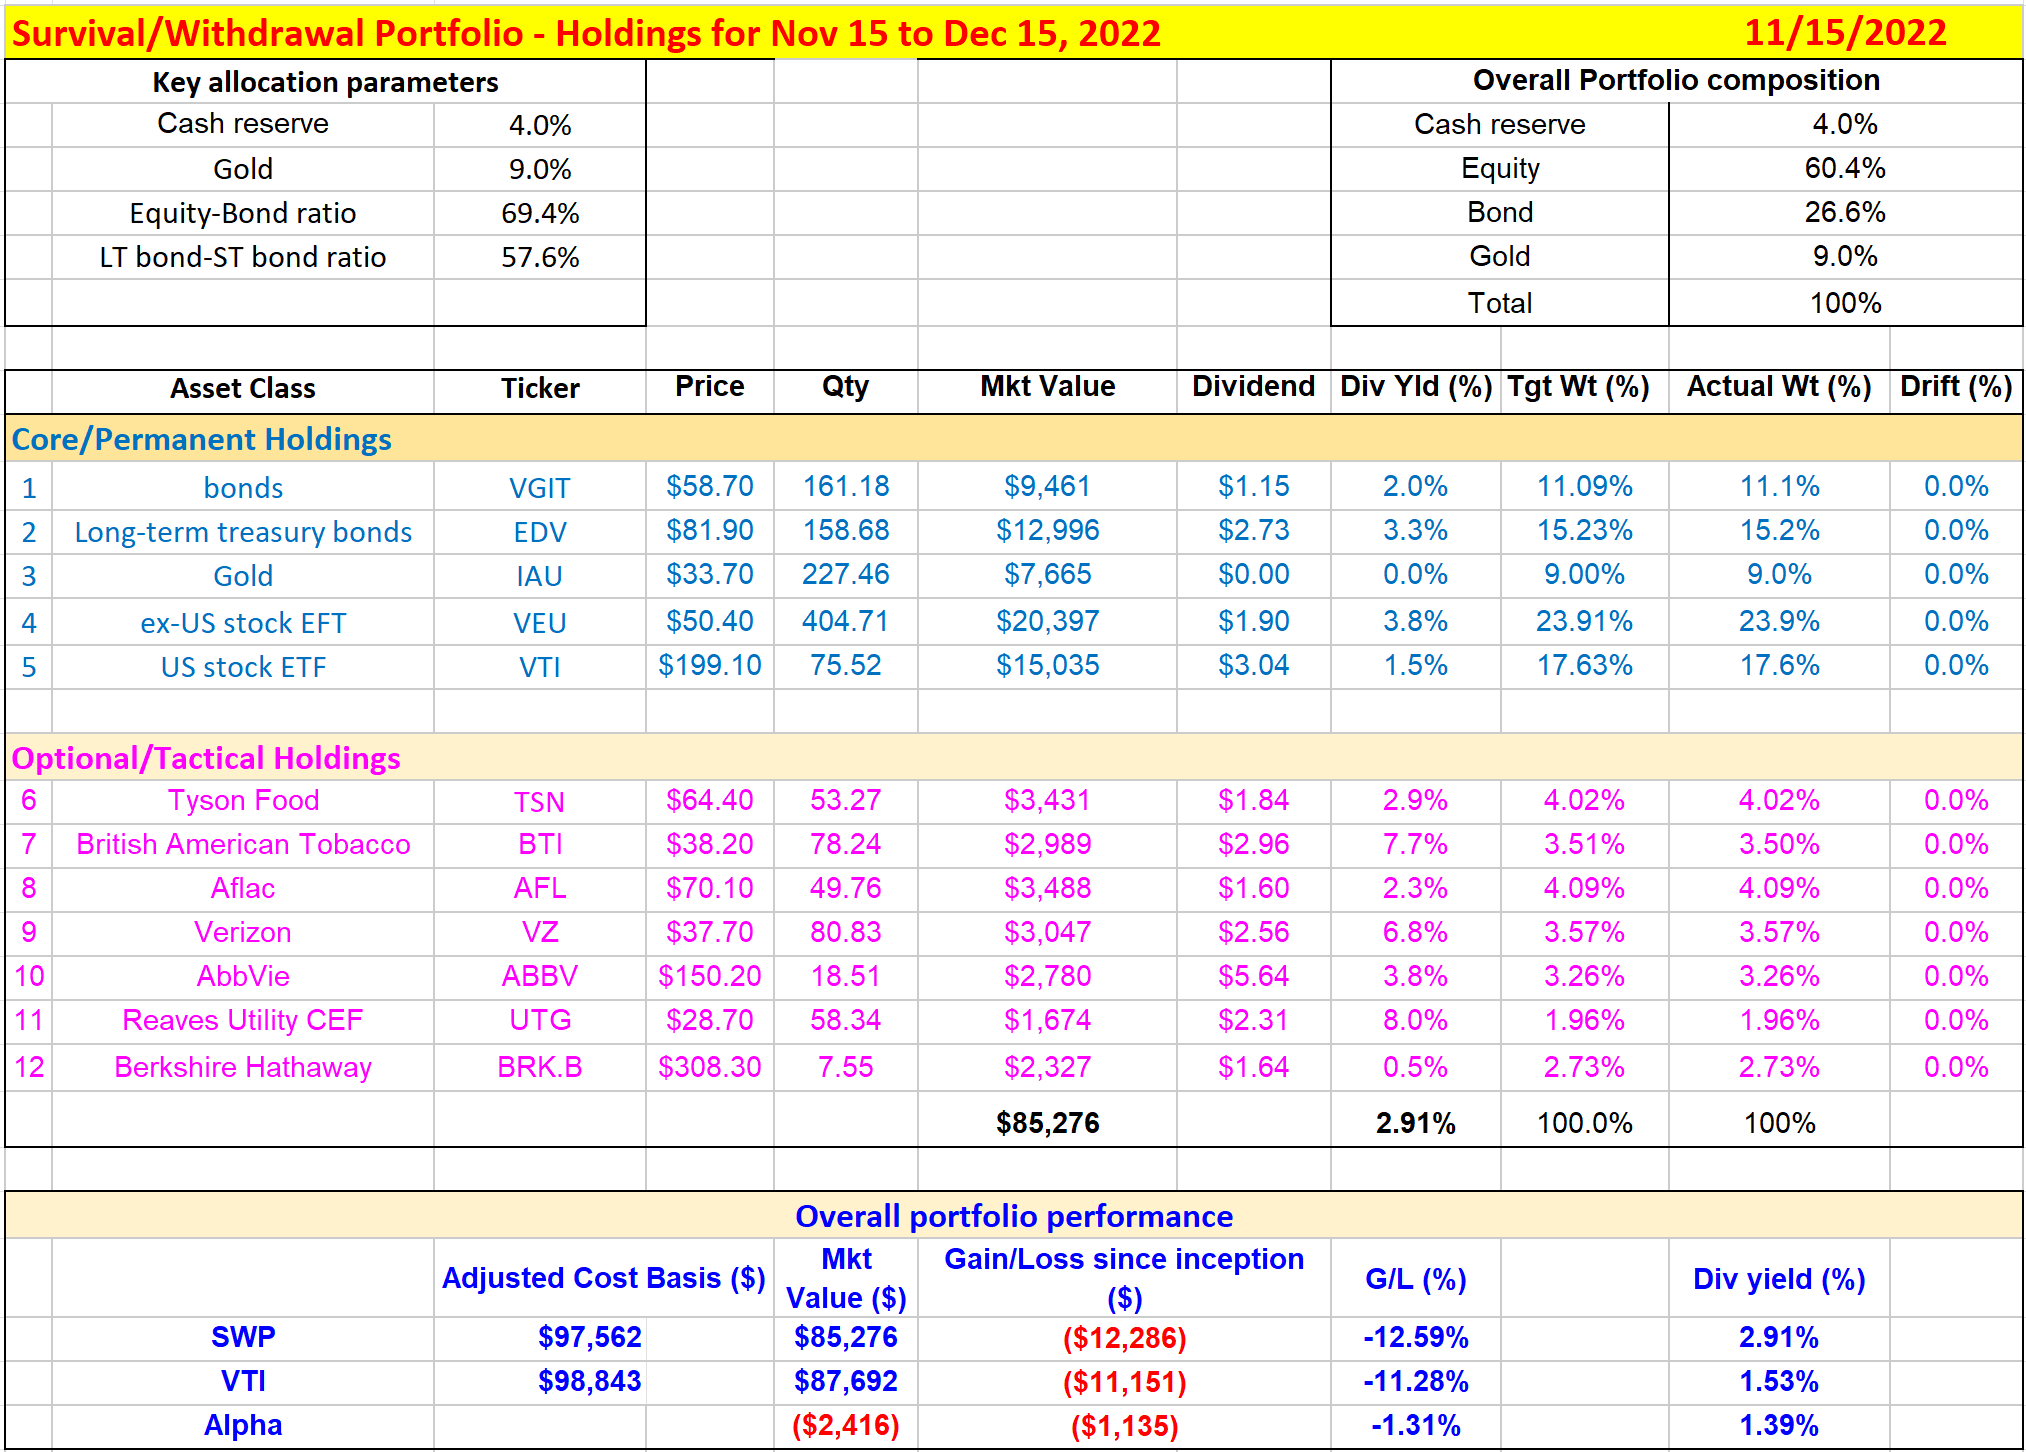
Be the first to comment