Daniel Grizelj
Thesis
The iShares Core Growth Allocation ETF (NYSEARCA:AOR) is an exchange traded fund that provides an investor with the return profile of the classic 60/40 portfolio allocation. An investor can choose a “do it yourself” approach where several equity and bond ETFs are purchased separately, or just buy AOR.
Historically, the 60/40 build has allowed for a portfolio construction that resulted in lower volatility. An investor who would have been long just the S&P 500 (SPY) in the past decade for example would get a lower volatility portfolio via the bond diversification. The bond diversifier would result in a balanced return on classic risk-off days, when equities would be down and yields would be lower in a normalized risk-off move.
The 60/40 portfolio relies exclusively on the inverse correlation that has been historically witnessed between treasuries and equities. In a classic risk-off environment, investors sell equities and seek the safety of treasuries, thus pushing yields lower and prices higher. That has not worked in 2022:
AOR Drawdowns (Portfolio Visualizer)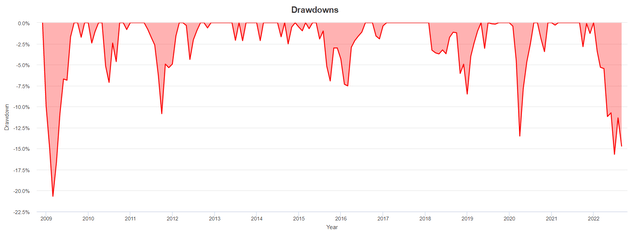
We can see that this year has been the second-worst drawdown for AOR in the past 15 years, surpassed only by the great financial crisis of ’08-’09. The reason for this is simple – this year’s equities and treasuries returns have seen a positive correlation. In fact, the negative equity performance this year is in large part driven by the rising rates environment.
The COVID crisis brought about a Fed-induced zero rates environment, meant to stimulate the economy. The lax monetary policy environment also resulted in a rise of asset bubbles and an overflow of liquidity in all pockets of asset classes due to ‘TINA‘ (there is no alternative). Rampant inflation brought everything to a stop, and we are currently witnessing a quick retracement of the excesses of the past.
The Fed has hiked rates violently to fight inflation, which in turn has resulted in alternatives that offer attractive yields across the asset class spectrum. The speed of the rate hikes has made 2022 the worst year on record for bond returns:
US Agg Bond Total Return (Compound Capital)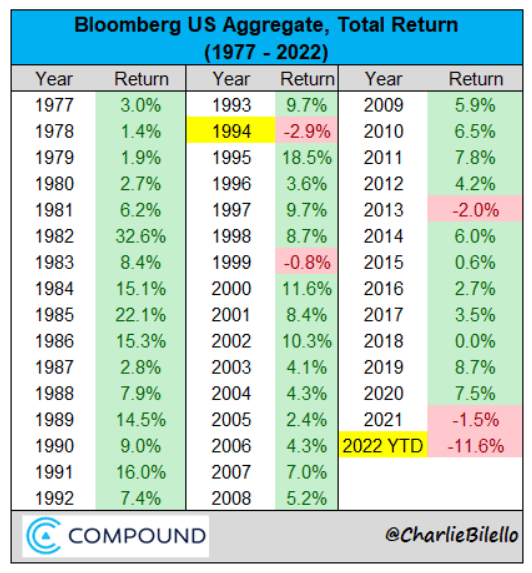
There are several things which are quite interesting to observe from the above historical total return figures. Firstly, 2022 “wins” by a large margin the “best” year for bonds contest. Secondly, it is surprising how few years have negative bond returns – this is due to the carry displayed by the asset class. As long as the move higher in yields is slow, bonds can absorb, from a total return perspective, higher yields. Sudden shifts up in the yield curve are instances where the asset class performs the worst. This is the case in 2022.
Fed Rate Hikes – Are We There Yet?
The Fed fell behind this year as inflation spiked, and it has played catch-up ever since. Powell and Co. are looking for sequential prints with lower core PCE levels before even starting to think about pausing rate hikes. We are expecting a 75 bps hike in September, which has been well telegraphed by the WSJ. Nick Timiraos is rapidly becoming the Fed’s “trumpet“, after his well-timed article calling for a July 75 bps move.
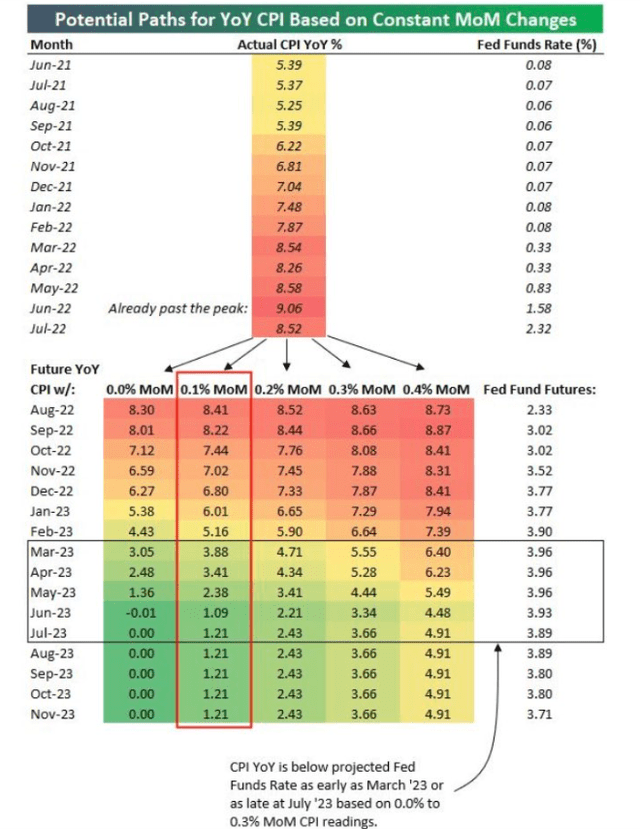
The market discussions center around the fact that the Fed will not consider turning on rates until CPI year-on-year is below the Fed Funds rates:
If we look at the above table, courtesy of Macro A., we can see that in very benign inflation scenarios y-o-y CPI does not go below the projected Fed Funds rates (implied from the futures market) until Q1/Q2 of next year. The Fed will need a consistent CPI below Fed Funds prior to any pivots.
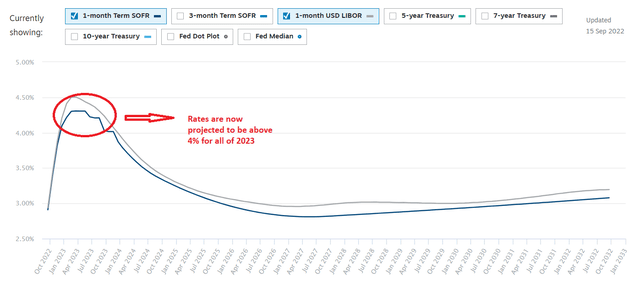
The market is now starting to price this in, with the SOFR and LIBOR curves above 4% for the entire 2023 now:
Given the latest CPI prints, banks are revising their hike projections, with Goldman (GS) now expecting the Fed to hike by 75 basis points this month, 50 basis points in November, up from their previous forecasts of 50 basis points and 25 basis points respectively. They expect another 25 basis points hike in December to top off 2022.
Some market participants, namely Ray Dalio, are calling for much higher rates. Mr. Dalio actually estimates a 4.5% to 6% range for Fed Funds in the next few years:
The Bridgewater Associates founder said the Federal Reserve will seek to curb inflation by hiking interest rates from around 2.5% today, to between 4.5% and 6% over time.
We do not think rates much above 4% are feasible for the United States government given their high debt burden and interest rate payments, but the fact that some market participants see such high levels should tell you that there is a significant “thought dispersion” on the correct levels.
Holdings
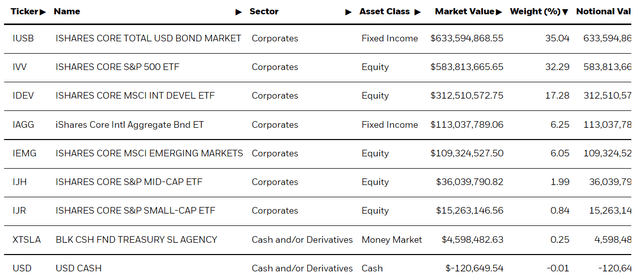
Rather than holding individual equities and bonds, the fund allocates its capital across specific purpose ETFs:
The specific asset class breakout is as follows:
Holdings Breakout (S&P)
Conclusion
The 60/40 portfolio has historically offered better volatility-adjusted returns due to the negative correlation between equity and bond prices. 2022 has been a unique year where negative equity returns have been driven by a violent repricing higher of risk-free rates. This unique situation has resulted in a positive correlation between the two asset classes, resulting in one of the worst years on record for the 60/40 portfolio. As risk-free rates peak, we will see a reversion to the historic inverse correlation. The rest of 2022 will be difficult for AOR with pressures across both of its components: we do not believe we have seen the lows in equities yet, nor have we reached the terminal Fed funds rate. New money looking at this historically successful portfolio construction methodology should pick up AOR at the beginning of 2023 rather than now.


Be the first to comment