


ugurhan
Introduction
The SPDR S&P Metals & Mining ETF (NYSEARCA:XME) looks to provide diversified exposure to 34 stocks from the metals and mining segment of the S&P Total Market Index. XME’s holdings are impacted by developments in a range of metal sub-industries ranging from Aluminum, Coal, Gold, Silver, Other precious metals, Consumable Fuels, and other Diversified Metals. In this article, we examine the investment case for XME at this juncture.
Conditions Look Favorable For The Sector
Whilst there may be a few blemishes along the way, by and large, conditions for the metal and mining industry look quite encouraging.
Nobody is playing down the impact that potential global recessionary conditions could have on the demand side, but contrary to the hard landing outlook a few months ago, we’re increasingly looking at a softer landing.
Mining exploration projects may have taken a back seat on account of tighter monetary conditions but I believe this will come back as most central banks are done with their aggressive positioning. If anything, H2-23 may also prompt a number of banks to cut rates.
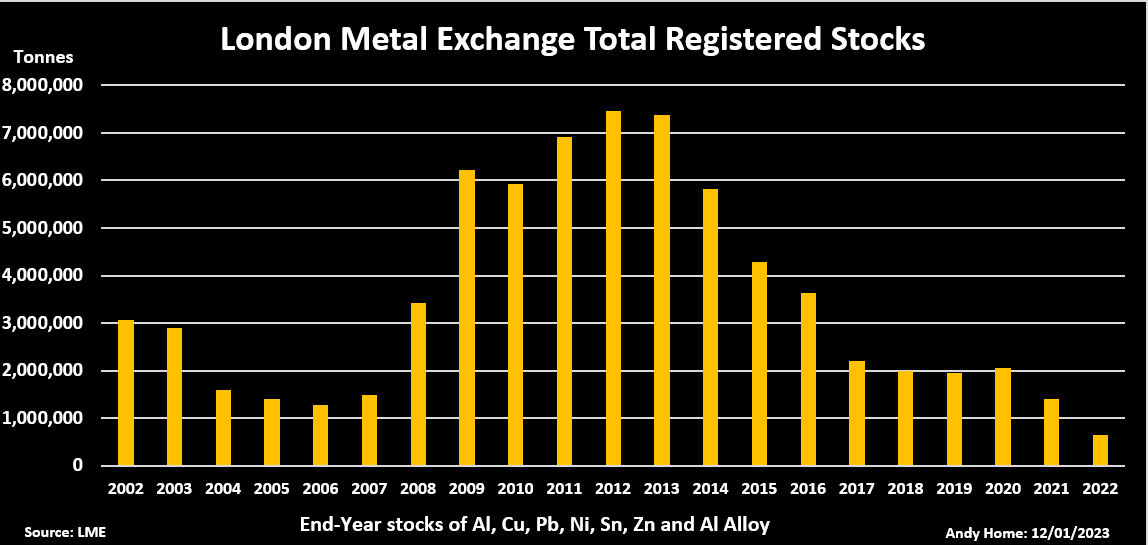
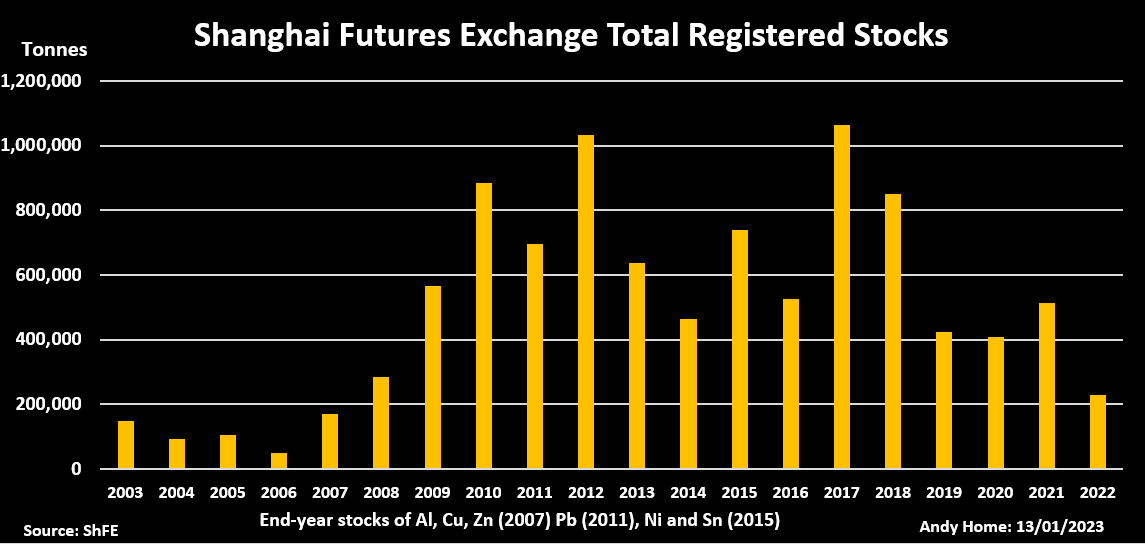
Bruised by relentless lockdowns over the past couple of years, China- the world’s largest guzzler of metals looks set to renew its appetite and this has been instrumental in pushing inventory levels for a range of metals across the LME and the Shanghai Futures Exchange to drop to its lowest level in years.
Reuters
For instance, at the end of last year, the registered stocks of all LME base metals (except tin) dropped last year, so much so that the total tonnage registered was less than half of what was seen at the close of 2021.
Reuters
Meanwhile, on the Shanghai Futures Exchange, warehouse stocks were at the lowest point in 15 years!
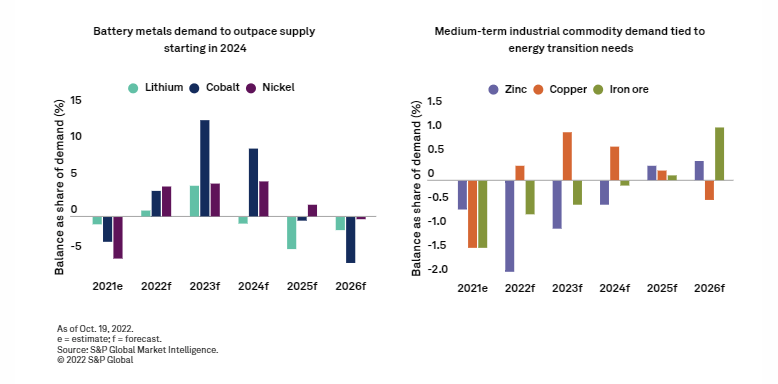
Also consider a burgeoning thrust towards decarbonization and the growing penetration of EV technology which should add further pressure to the supply-demand imbalance across various commodity markets, with deficits expected by 2024 itself. All things considered, the prospects for better realizations look very promising for these miners.
S&P Global
XME or PICK?
The two most popular “diversified” mining ETFs one can pursue are XME and the iShares MSCI Global Metals & Mining Producers ETF (PICK). If you’re thinking of pursuing one or the other, and can’t make up your mind, here are a few pointers worth considering.
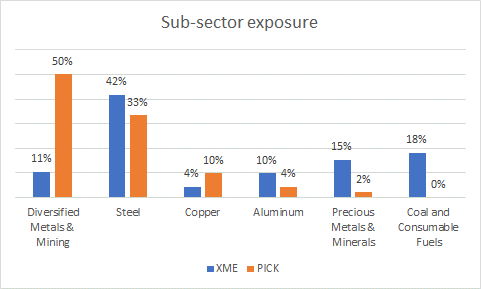
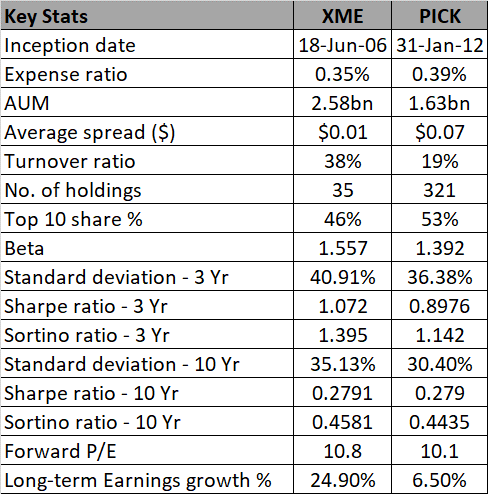
- XME focuses on US-based stocks, whereas PICK focuses on global stocks with US-based stocks only accounting for 17% of PICK’s total holdings. Australian-based miners account for the largest stake at 27%. If you think recessionary conditions could get a lot worse you may want some exposure to gold and silver miners, and XME gives you a little bit of that, with over 15% of the total portfolio. PICK does not cover stocks that have exposure to gold and silver mining although there is a little exposure to other precious metal miners (~2%).
Homepages of XME and PICK
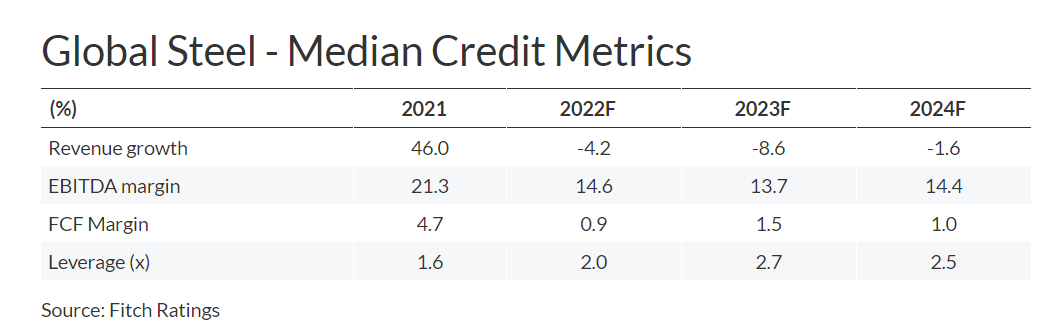
- XME may be hampered by its heightened exposure to steel companies (~42% exposure, the largest metal exposure, vs 33% for PICK. Diversified metal miners are PICK’s largest exposure accounting for 50% of the holdings). Whilst global steel consumption is expected to grow incrementally in 2023, revenue declines will continue for this year and the next (following a 4.2% decline in FY22), even as EBITDA margins contract by almost 100bps.
Fitch Ratings
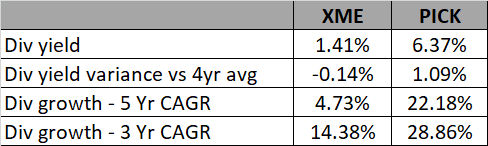
- If you’re a mining investor who attaches importance to the income angle, PICK should be your preferred choice. The yield difference between the two options is almost 500bps with PICK offering a figure of over 6%. PICK’s current yield is also over 100bps higher than its historical average, whilst XME lags its historical average by 0.15%. PICK has also grown its dividends at a far superior base both over three years as well as five years.
Seeking Alpha
- PICK also comes across as a less risky and has a steadier profile relative to XME. PICK spreads its tentacles across 320 stocks and this helps spread the risk out. XME is a lot more focused, covering only 30-odd names. Whether it’s in the short-term (three years) or the long-term (10 years), XME’s standard deviation is a lot higher than PICK’s. Due to its narrow focus, you also get a lot of churn with XME, whereas since PICK covers the bulk of miners across the globe, there’s less need to rotate. This is exemplified by the respective annual turnover ratios where XME’s is 2x as much as PICK’s (19%).
- XME may have the higher volatility quotient of the two, but it sure does a better job of mitigating its heightened risk profile, particularly in recent years. The 3-year stats show that its Sharpe ratio has been well ahead of PICK, even as it trumps it marginally over 10 years as well. Crucially, it does a solid enough job of managing harmful volatility as highlighted by the excellent Sortino figures as well.
- If you’re someone with a short-term mindset and are relatively confident of determining upside prospects in the market, you’d want to go with XME. Given the tight spread of just $0.01x (7x better than PICK’s), you can get excellent fills on your position. Besides, when risk sentiment is generally buoyant across the markets, XME tends to be more sensitive to benchmark movements. Note the disparity between the two betas. Given that 2023 has been relatively buoyant for markets so far, it’s no surprise to discover that XME’s AUM has seen a larger surge of 2x that of PICK’s.
- From a valuation angle, PICK is available at a slight forward P/E discount of mid-single-digits, but then again consider the much superior earnings growth potential (almost 4x) you get with XME.
Seeking Alpha, YCharts, ETF.com
Closing Thoughts- What Do The Technicals Imply?
Based on the discipline of technical analysis alone, it’s fair to say that one is staring at a conflicting outlook for XME.
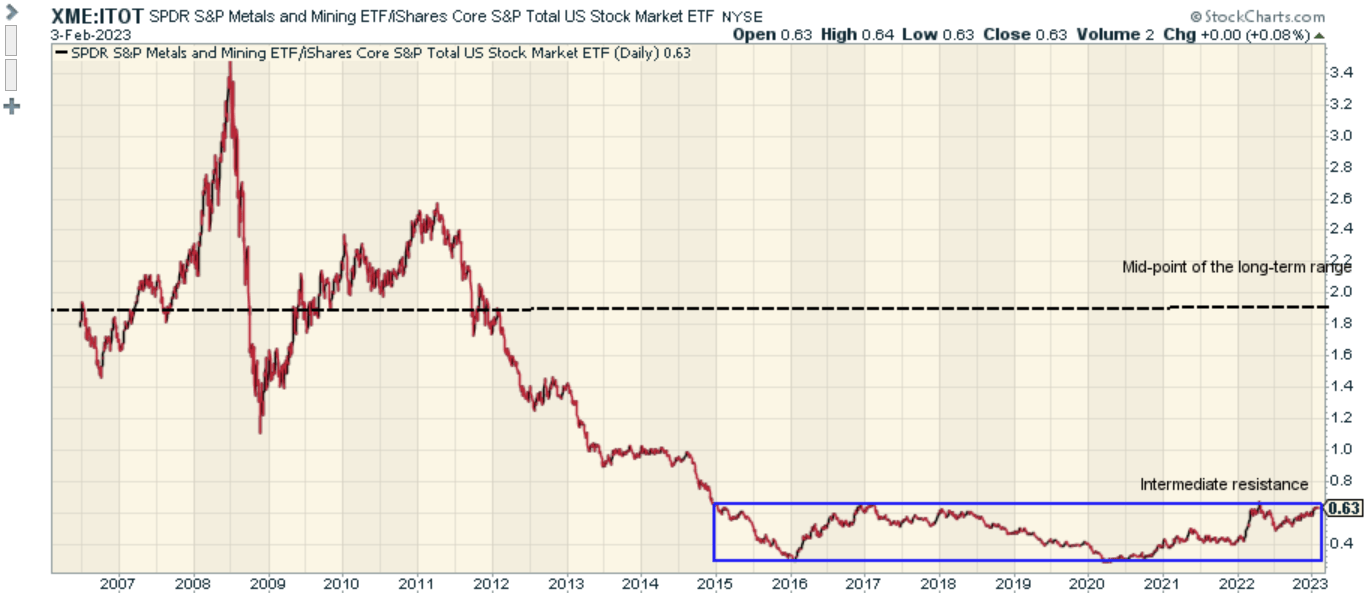
As noted in the introductory section of this article, XME is a subset of the S&P Total Market Index (S&P TMI). We thought it would be appropriate to take a look at the metals and mining portion of the parent index to determine the scope of mean-reversion.
Stockcharts
There are two main takeaways from the image above. If you’re a glass-half-full person with a long-term holding track record then it’s fair to say that XME appears to be a very promising candidate for mean-reversion over time; the current relative strength ratio is two-thirds lower than the mid-point of the life-long range. However, if you’re someone whose holding period tends to be a lot shorter, it’s fair to say that in the near term, conditions look overbought, as the RS ratio of XME and ITOT (the ETF which tracks the S&P TMI) has just recently hit the highs of its 8-year range, a terrain it previously failed to clear on four separate occasions (2015, 2017, 2018, 2022). This landmark “may” prompt investor sentiment to ebb away from XME once again.
Investing
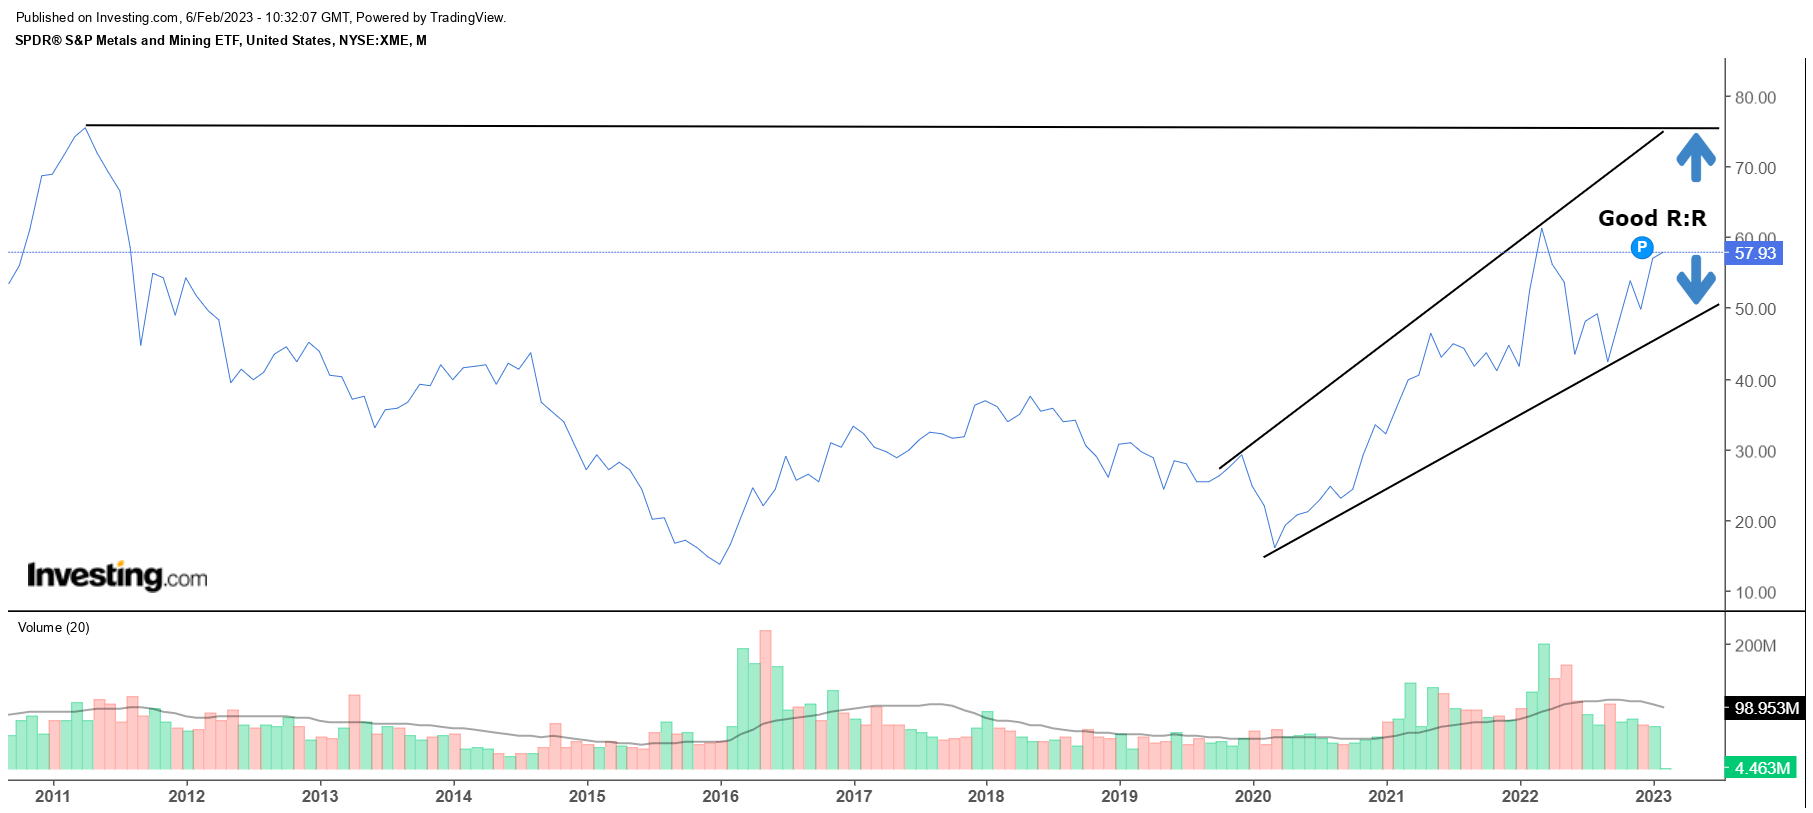
If we switch over to XME’s own long-term chart, we can see that the price has been trending up in the shape of a quasi-ascending channel, a quasi-broadening wedge pattern. There also appears to be no major resistance till the $75 levels, which also coincides with the upper boundary of the wedge/channel. If one were to stage an entry at the current share price and keep the boundaries of the wedge as guideposts, the reward to risk looks very favorable at 2.1x.
Be the first to comment