

GeoffHardy/iStock via Getty Images
Investment Thesis
Opendoor Technologies Inc. (NASDAQ:OPEN) remains a highly speculative play we are closely monitoring, given its growing dominance in the iBuying segment and expansion to 51 markets as of FQ2’22. Assuming continued migration from the conventional real estate transactions, we may see OPEN actually succeed over the coming decade, with a rather ambitious $2.3T in Total Addressable Market size in the US.
With a growth-at-all-cost strategy, OPEN is definitely going on the offensive with a multiyear partnership with Zillow (Z) and Opendoor Exclusives. With an $11B in financing capacity, $2.5B of cash and equivalents on its balance sheet, and higher spreads, the company seems well poised for expansion and growth ahead.
However, the current odds are not quite in OPEN’s favor, with a rapidly cooling property market, rising mortgage rates through 2023, and pessimistic macroeconomics. Its lack of profitability does not help as well, since the company will likely continue relying on debts and SBC expenses through 2025. Therefore, indicating that the stock is only suitable for investors with a long-term trajectory and higher tolerance for risk. Even then, one should always size the portfolio accordingly and only add at near bottoms for maximum gains.
OPEN’s Management Continues To Impress
S&P Capital IQ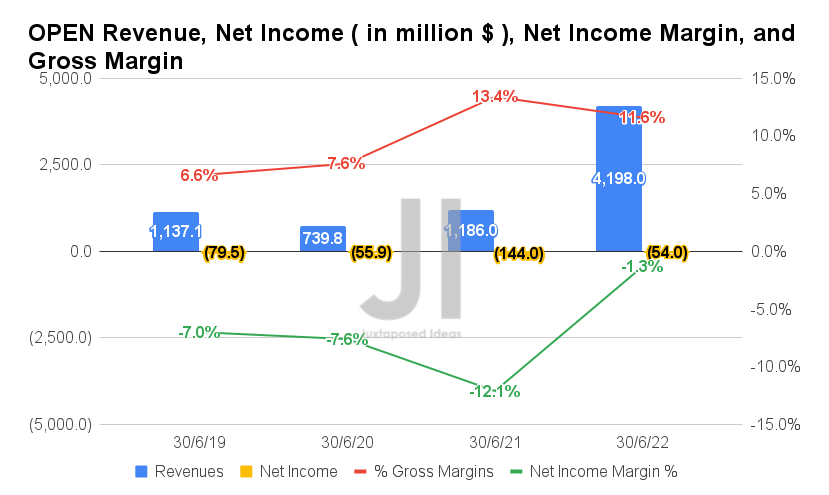
In FQ2’22, OPEN reported revenues of $4.19B and gross margins of 11.6%, representing an increase of 353.9%, though a minimal decline of 1.8 percentage points YoY, respectively. Nonetheless, it is evident that the company is slowly but surely improving its profitability, with GAAP operating income of $32M and net income of -$54M in the latest quarter. This indicates a rather satisfactory increase of 62.5% and 826% YoY, respectively, despite the -18.6% fall in revenues QoQ.
S&P Capital IQ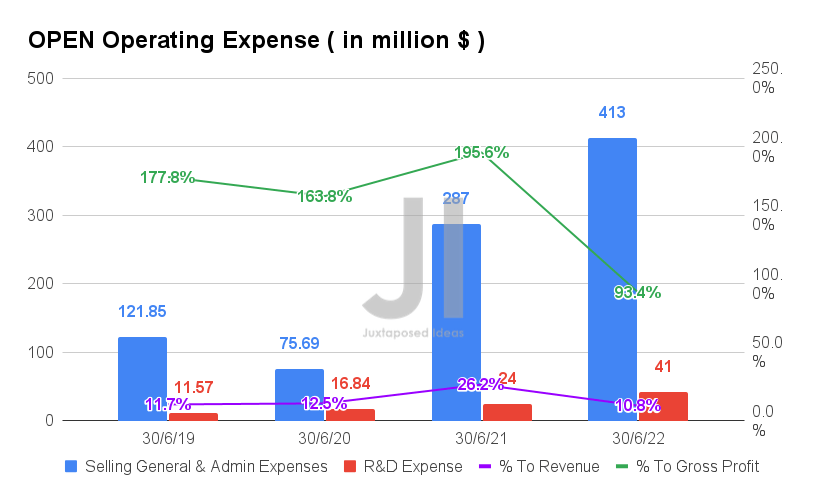
Much of its lack of profitability is attributed to OPEN’s aggressive operating expenses. By FQ2’22, the company reported $454M of SG&A and R&D expenses, representing an increase of 8.8% QoQ and 45.9% YoY. However, with the management guiding an aggressive reduction in its operating expenses to $190M by FQ3’22, we may see a silver lining in the company’s profitability moving forward.
With its partnership with Zillow and the intriguing Home e-commerce experience, we will see how OPEN performs against multiple headwinds in a cooling real estate market by FQ3’22. Assuming victory against all odds for its upcoming quarters, the bulls may potentially see a small stock recovery by H2’22. Though, these gains are unlikely to sustain due to the slower property market then.
Beware Of This Potentially Dilutive Cash-Burn Machine During The Economic Downturn
S&P Capital IQ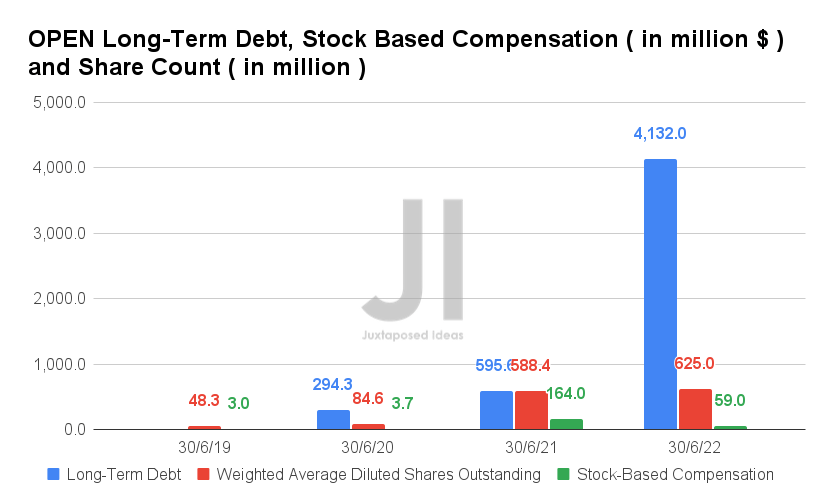
Though OPEN reported long-term debts of $4.1B in FQ2’22, it is essential to note that it holds significant inventory worth $6.62B at the same time. Therefore, we do not expect much headwinds to its liquidity in the short-term, aided by its cash and equivalents of $2.85B on its balance sheet. This is assuming that the company is able to sell most at its original carrying value or for a considerable profit, of course.
Nonetheless, it is also evident that the median home prices started to fall in July 2022, with visibly increasing inventories in the market compared to previous quarters. Consequently, we can understand why the consensus estimates remain pessimistic for the short term since the management guided for lower contribution margins in H2’22.
As a result of its unprofitability, OPEN will likely continue relying on elevated Stock-Based Compensation (SBC) and dilutive capital raises moving forward, with $59M of SBC expenses already reported in FQ2’22. Assuming a similar rate ahead, we may see the company report up to $252M in SBC expenses for FY2022, further diluting existing investors. However, it is also interesting to note that these numbers represent a projected moderation of 52.9% from FY2021’s levels of $535.95M.
Nonetheless, it is no secret that OPEN has diluted its existing shareholders by 349.1% since its IPO in 2020. Otherwise, by 10.5% since its follow-up offering in February 2021. In addition, investors must not forget its 2026 Notes of $978M, which translates to 50.85M shares based on original conversion rates, or speculatively, 205.89M shares based on current depressed prices. Thereby, potentially pointing to further dilution of 32.9% from the current share count of 624.96M in FQ2’22.
Though SBC is often used by unprofitable high-growth tech companies, it is also evident that OPEN is in danger of over-relying on this dilutive strategy for the next three years. Interested investors beware.
Mr. Market Is Uncertain About OPEN’s Recovery Ahead
S&P Capital IQ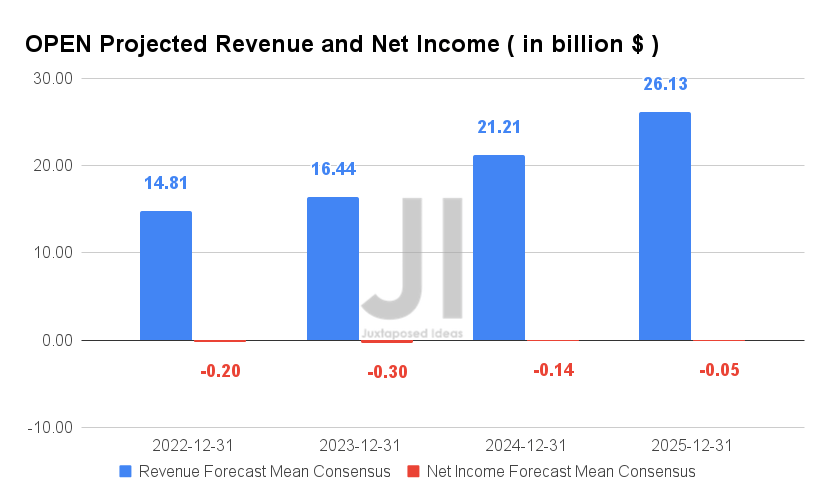
Over the next four years, OPEN is expected to report revenue growth at a CAGR of 34.35%, while continuing to record unprofitability at the same time. Investors must note that these numbers notably represent a massive decline in estimates by -21.3% since June 2022.
For FY2022, consensus estimates that OPEN will report revenues of $14.81B and net incomes of -$0.2B, representing tremendous YoY growth of 84.66% and 69.7%, respectively. In spite of that, Mr. Market has downgraded its FY2022 projected revenues by -18.5%, revealing a lack of confidence in the iBuying prospects throughout 2025. Thereby, speculatively pointing to the stock’s continued underperformance ahead.
In the meantime, we encourage you to read our previous article on OPEN, which would help you better understand its position and market opportunities.
- Opendoor: H2 2022 Is The Real Question In The Midst Of Slowing Demand
So, Is OPEN Stock A Buy, Sell, or Hold?
OPEN 1Y EV/Revenue and P/E Valuations
S&P Capital IQ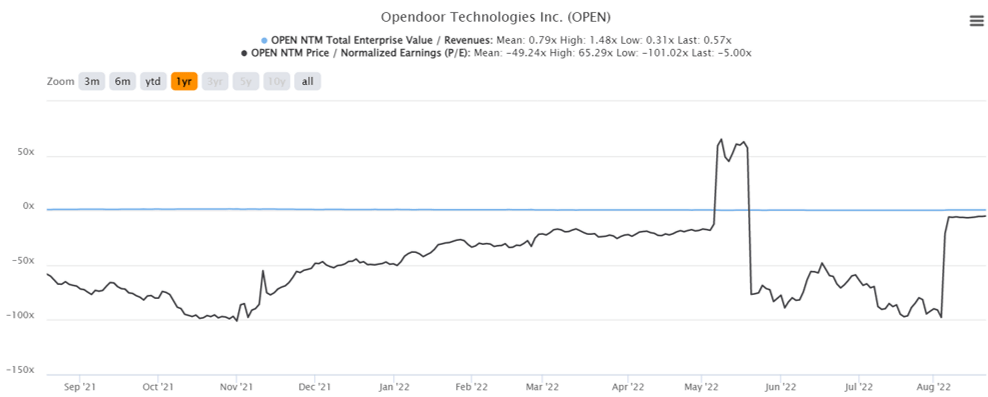
OPEN is currently trading at an EV/NTM Revenue of 0.57x and NTM P/E of -5.0x, lower than its 1Y EV/Revenue mean of 0.79x though massively improved from its 1Y P/E mean of -49.24x. The stock is also trading at $4.75, down 81.2% from its 52-week high of $25.33, nearing its 52-week low of $4.30. It is evident by now that the stock had lost all gains since its recent rally post FQ2’22 earnings call.
OPEN 1Y Stock Price
Seeking Alpha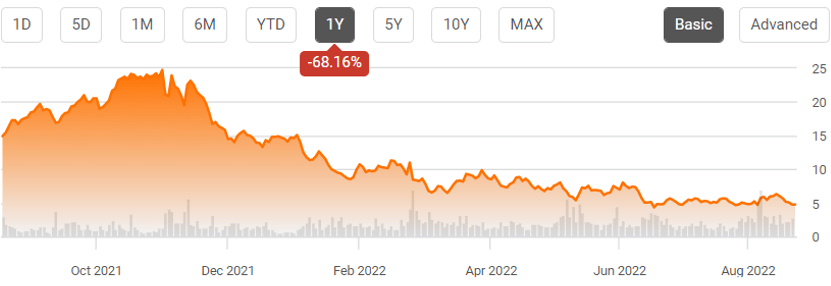
Though consensus estimates continue to rate OPEN stock as a strong buy with a price target of $11.17 and 135.16% upside from current prices, we are uncertain of its potential recovery in the intermediate term. With the Fed set to hike interest rates again in September, we may expect to see further headwinds to OPEN’s margins and, therefore, stock performance in H2’22.
In the meantime, we rate OPEN stock as a Hold for now, since there is also no point in selling at current levels. Hold on tight to this potential multi-bagger during the upcoming turbulence.
Be the first to comment