Sean Gallup
Thesis
Is Google (NASDAQ:GOOGL, NASDAQ:GOOG) cheap? This is an interesting question and one that is arguably hard to answer. Different investors might come to different conclusions. But in the end, I argue, it is all about valuation.
In this article, I will present three ways how investors could value Google: a relative multiple comparison (1), a sum-of-the-parts valuation (2) and a residual earnings model (3).
My analysis finds that Google is a strong buying opportunity, no matter the valuation method.
Relative Multiple Comparison
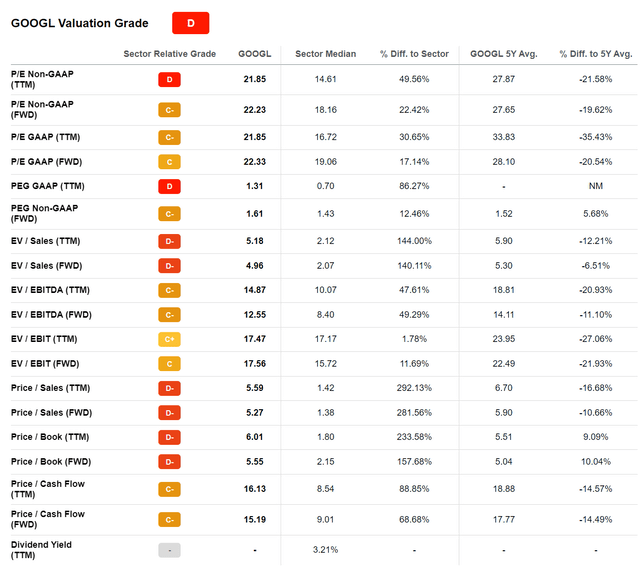
Arguably, the easiest –but also the most superficial and ineffective– way to value Google is through a simple multiple analysis. According data compiled by Seeking Alpha, Google currently trades at a one-year forward P/E of x22, a P/ of x5.5 and P/S of x5.3.
As compared to the company industry peers, Google is valued at an approximate premium between 20% and 300%, depending on the relevant multiple.
Given the initial multiple introductions above, an investor might argue that Google is expensive and this would be the end of the story. However, I argue that there is much more to the story. In order to accurately reflect a multiple valuation, one must account for a company’s growth. Moreover, as investing is a relative discipline (finding the best pick in an opportunity set), a relative comparison is necessary.
That said, I advise to use the PEG ratio, which is broadly accepted as an informative valuation metric to capture the relative tradeoff between a company’s current stock price, current earnings and the expected growth. The PEG ratio is calculated by dividing a stock’s one-year forward P/E by the three-year CAGR expectation as estimated by analyst consensus.
Google is currently valued at $118.22/share and based on analyst consensus EPS, the one-year forward P/E is x22.5. Given that analyst estimate a 3-year CAGR of about 14%, I divide 22.5 by 14 to calculate a PEG of x1.6. The same calculation for FAAMG peers returns x2.4 for Meta Platforms (META), x3 for Apple (AAPL), x3.2 for Amazon (AMZN) and x1.56 for Microsoft (MSFT). Thus, on a relative comparison, Google is valued second cheapest amongst the FAAMG universe, only Microsoft is slightly cheaper.
If we compare Google’s PEG to the PEG metric of the broad market of x4.5 (reference S&P 500), the company looks like an absolute bargain.
Analyst Consensus EPS; Author’s Calculation
All that said, an investor could say that Google should reasonably trade at the average FAAMG’s PEG multiple, which is x2.37. Based on this multiple, we can reverse engineer the company’s implied P/E, given that growth expectations are firm. This will give an implied P/E of x33. Accordingly, the fair price per share should be somewhere around $173.
Sum-of-the-parts Valuation
I am not the greatest fan of the Sum-of-the-parts valuation, as I argue it is unreasonable to assume that a company’s business units could be spun-off without friction and/or investors have adequate insights to allocate a company’s fundamentals to various units. But I am aware that many investors like to anchor their thinking on the SOTP, so here you go.
Google operates three key business units: Google Services (Advertising), Google Cloud and Other Bets. The idea is that if we can find a reasonable independent valuation for all these segments, and add up the numbers, we would derive the company’s valuation.
The challenge is in finding a reasonable valuation. But here is how I would value the segments:
Google Services: For Google Services, given that the segment is the most established, I propose to use a DCF model. According to my estimations, incorporating analyst consensus estimates, will likely generate operating cash-flow of $97 billion in 2022 and approximately $112 billion in 2023. I assume a 4.5% terminal value growth rate and a very reasonable cost of capital equal to 10%. Based on these assumptions, I calculate an enterprise value of 1,863 billion.
Google Cloud: The cloud business unit is expected to generate 2022 revenues of $26.9 billion and an operating loss of approximately $3.7 billion. I believe an EV/Sales multiple would be best to anchor a valuation. Given that high-growth and high-potential software firms often trade at x15 sales, I argue a x10 sales would arguably be a reasonable anchor. Thus, I estimate an enterprise value of $269 billion.
Other Bets: This segment is the most speculative and difficult to value, given that other bets generate little revenues and fundamentals of specific bets are not transparent. For example, we know that Waymo was valued at about $30 billion in 2021. Previously the self-driving arm was reportedly valued as high as $200 billion. Given the risk and lack of anchor for valuing ‘Other Bets’, I advocate a very prudent approach: value at zero.
So, to calculate Google’s combined enterprise value, we add 1,863 billion for Google Services, $269 billion for Google Cloud and $0 for Other Bets. To derive the company’s shareholder value, I further add Google’s $96.19 billion of net-cash.
Divided by shares outstanding, the calculation will return a fair price/share of about $187.
Residual Earnings Model
The residual earnings model is my favorite tool to value a company, but arguably also the most complex. As per the CFA Institute:
Conceptually, residual income is net income less a charge (deduction) for common shareholders’ opportunity cost in generating net income. It is the residual or remaining income after considering the costs of all of a company’s capital.
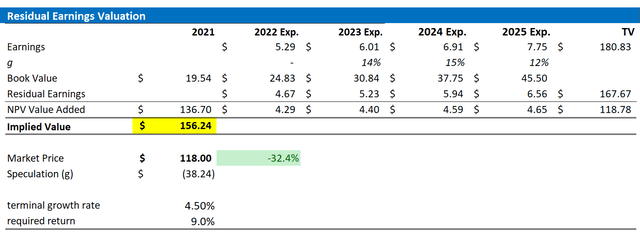
Accordingly, I have constructed a RE model with the following assumptions:
- To forecast revenues and EPS, I anchor on consensus analyst forecast as available on the Bloomberg Terminal. I project the consensus until 2025. Everything thereafter, in my opinion, is too speculative.
- In the estimate of the cost of capital, I use the WACC framework. I model a three-year regression against the S&P to find the stock’s beta. For the risk-free rate, I used the U.S. 10-year Treasury yield as of August 01, 2022. My calculation indicates a fair WACC of 9%.
- For the terminal growth rate, I apply expected nominal GDP growth at 3.5%. Although I think that growth equal to the estimated nominal long-term GDP growth is strongly understating the company’s growth potential, I advocate a conservative approach.
- I do not model any share buyback – further supporting a conservative valuation.
Based on the above assumptions, my calculation returns a base-case target price for Google of $156.24/share, implying upside of more than 30%.
Analyst Consensus EPS; Author’s Calculation
I understand that investors might have different assumptions with regards to Google’s required return and terminal business growth. Thus, I also enclose a sensitivity table to test varying assumptions. For reference, red cells imply an overvaluation as compared to the current market price, and green cells imply an undervaluation.
Analyst Consensus EPS; Author’s Calculation
Conclusion
In this article, I have presented three ways to value Google, and arguably I have been quite conservative in my assumptions. Notably, all valuation techniques discussed point to considerable upside for the stock.
For the relative multiple comparison, I calculate a $173 target price, for the sum-of-the-parts valuation I view $187 as fair, and for the residual earnings model an investor could assume a $156.24 anchor.


Be the first to comment