

yorkfoto
ETF Snapshot
The iShares China Large-Cap ETF (NYSEARCA:FXI)- with nearly $6bn in assets, and a listing history of close to two decades- is one of the prominent funds offering exposure to large companies in China; to be more precise, this is an ETF that tracks a market-cap weighted index, so you get access to 50 of the largest Chinese stocks that trade on the Hong Kong Stock Exchange. Attempts have been made to cap the exposure of individual stocks at 9%, whilst the aggregate weights of all those stocks with over 4.5% exposure have also been capped at 38%.
What Type Of Companies Are In FXI, And What’s The Outlook?
FXI comes across as a cyclical-themed product as the top three sectors (aggregate weight of ~78%) are all heavily sensitive to cyclical upswings and downswings; the Consumer Discretionary (CD) sector accounts for ~35% of the portfolio (incidentally 3 out of the top 4 names of FXI belong to the discretionary sector), the Financials sector accounts for ~26%, and the communication services sector accounts for 17%.
Currently, most indicators particularly for the CD sector, are not in the best of health, although there is a growing acceptance that H2-22 could be a lot better than H1. Just for some perspective, the Chinese President has set a rather ambitious FY22 GDP growth target of 5.5%. Considering that the economy grew by 4.8% in Q1, and would have likely have grown at 1-2% in Q2 (although some suggest China may even have seen a contraction in Q2), you’re effectively expecting H2 GDP growth to come in around the ballpark of 7.5%-8%. It remains to be seen if such high numbers are achievable under the cloud of the ongoing zero-COVID policy.
FT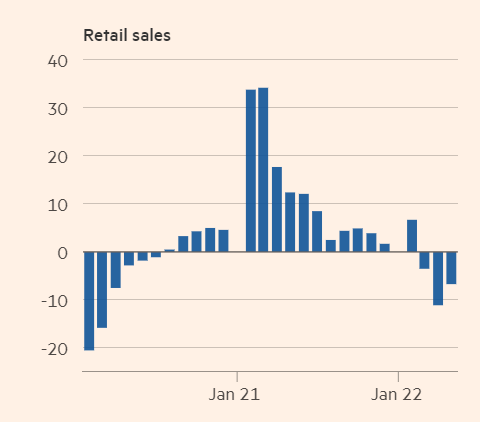
With regards to the consumer cyclical data per se, note that retail sales have been sliding for three straight months, even as the forward-looking consumer confidence index flounders at record low territories, for the second successive month.
Trading Economics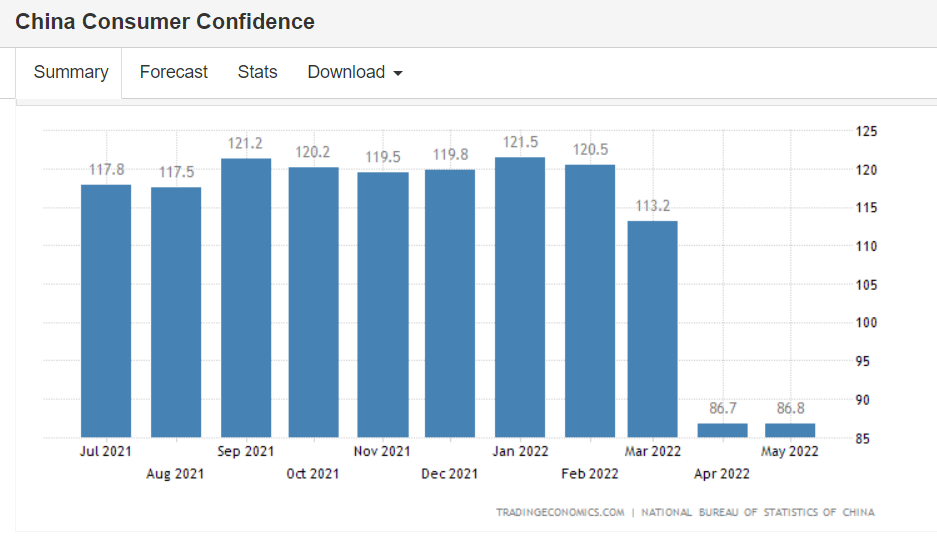
Whilst few pockets of the Chinese economy appeared to have made a smart recovery in June post the widespread lockdowns, contact-intensive areas such as retail and food services still continue to be a drag. As long as the zero-COVID policy remains in place, it is difficult to envisage the CD sector running at full tilt, as consumers are likely to be very wary about how and where they spend their time. For the uninitiated, if someone is found in the same location as a positive case, they risk being quarantined for weeks at a stretch. Lockdowns don’t appear to be a thing of the past and recent data from Nomura shows that over 114m were under partial or total lockdown at the start of this week, compared to 67 million last week. Whilst I suspect the worst may be over, underlying conditions in China are likely to progress in a stop-start manner for the foreseeable future.
How Does FXI Compare To Other Notable Chinese-centric ETFs?
To get a sense of FXI’s qualities, I’ve compared it to two of the other large ETFs that have been around for at least 10 years; these ETFs also focus on a diversified basket of Chinese stocks, rather than those that are thematic in nature. The two ETFs in question are – a) The iShares MSCI China ETF (MCHI), and b) SPDR S&P China ETF (GXC).
FXI is the oldest ETF of the lot, having been around since May 2004; yet still, that hasn’t prevented MCHI from garnering a higher AUM, of over $6bn despite coming to the bourses nearly seven years later (March 2011). Another important takeaway is that both MCHI and GXC offer exposure to a larger number of stocks than FXI (GXC:873, MCHI: 617), so you also get a useful dose of mid-and small-caps in both portfolios (the mid-and-small cap share in GXC is 27%, whilst it is 19% for MCHI). As I will highlight later on in this section, that has played an important role in the risk-adjusted return numbers of these ETFs.
I also believe it’s fair to say that FXI tends to attract not just buy-and-hold investors, but also a fairly strong cohort of short-term and tactical traders. This is exemplified by the fact that FXI’s average dollar volumes of nearly $1.3bn a day are miles ahead of what MCHI or GXC witnesses. Notice also that FXI tends to be popular with even those who want to profit on the downside, as highlighted by a heightened short-interest figure of 23%.
Then as a structure, FXI does not come across as a very compelling option. Firstly, it is the least cost-efficient of the three options with a pricey expense ratio of 0.74% which is 15-17bps higher than its peers. FXI is also a portfolio that tends to witness elevated levels of churn; typically, on a yearly basis, more than 30 out of its 50 stocks tend to be turned over, so as a long-term play, you may not quite get the benefits of holding this through cyclical upswings that may take years to play out. Conversely, the portfolios of MCHI and GXC are a lot more stable as exemplified by low annual turnover rates of 15-18%. FXI’s yield of 1.74% too isn’t the best on offer; that honor goes to GXC.
Finally, I also wanted to get a sense of how volatile the FXI portfolio has been (over the long-term as well as short-term), and also, how effectively it has managed to negate volatility whilst generating returns.
What we can see is that over a long period of 10 years, the FXI portfolio is the most volatile (as represented by the annualized standard deviation figure) out of the lot, however, over the short-term (three years), its standard deviation is lower than the other two options. So as far as volatility goes, there doesn’t appear to be any obvious takeaway, however the same can’t be said of the risk-adjusted return metrics (Sharpe ratio and Sortino ratio) both over three years, as well as 10 years.
Over the last 10 years, FXI’s ability to generate excess returns (relative to the risk-free rate) for every unit of total risk (as measured by the SD) is rather low at only 0.2147. Whilst this has improved over the last three years to 0.243, note that the differential versus the other two peers has only widened even more.
FXI has also not managed to deliver adequate excess returns when only downside deviation is concerned, as exemplified by very low 3-year and 10-year Sortino ratios of 0.378 and 0.3461 respectively.
GXC- the portfolio with the largest share of mid-and-small-cap names delivers not only the best Sharpe Ratios but also the best Sortino ratios, regardless of the time period in question. The implicit conclusion here is that FXI’s narrow focus on only 50 large-cap names hasn’t proven to be a very useful strategy for generating solid risk-adjusted returns.
If there’s one silver lining for FXI, it’s that its forward valuations appear to be the most attractive from this pace; as per YCharts, FXI can be picked up at a multiple of 10.2x, lower than the other two options, and also slightly lower than the broad-based EM themed ETF- iShares MSCI Emerging Markets ETF (EEM) which trades at 10.73x.
YCharts, Seeking Alpha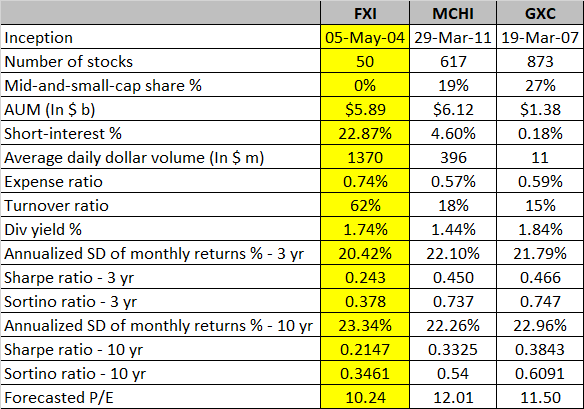
Closing Thoughts – Is FXI ETF A Buy, Sell, Or Hold?
As implied in the previous section of this article, the iShares China Large-Cap ETF isn’t the most compelling option for those who want to invest in China. Nonetheless, if you are predominantly guided by technical analysis, I’d say the relative strength and standalone charts suggest that there may be some interesting opportunities to exploit.
Firstly, let’s consider how the top 50 Chinese stocks are positioned relative to other international stocks as represented by the Vanguard FTSE All-World (ex-US) ETF. Whilst there’s been a recovery from record lows, this ratio still looks oversold and is trading outside its long-term range, implying favorable risk-reward for FXI.
Stockcharts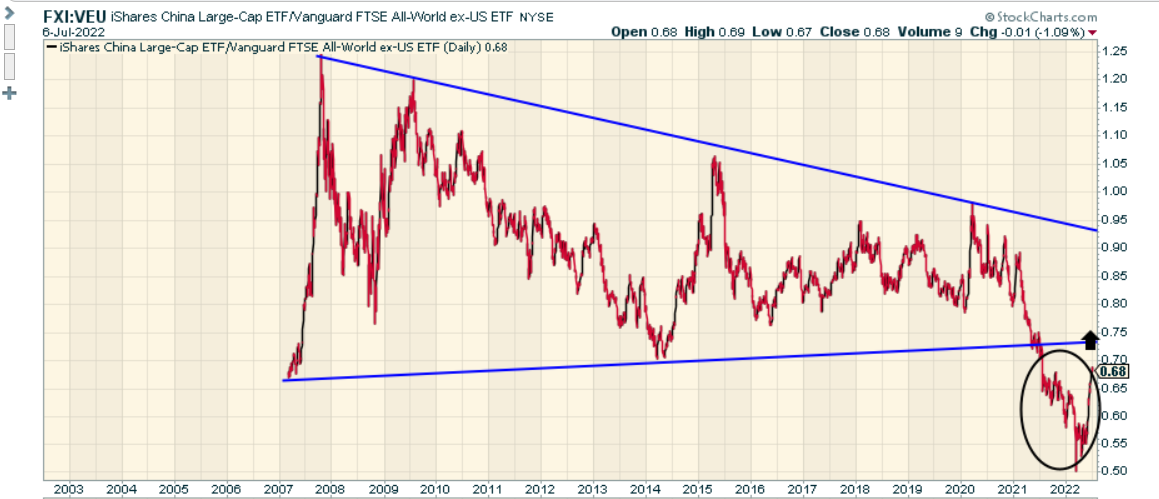
The second chart highlights how the largest 50 stocks of China are positioned relative to the broader Chinese market, as represented by MCHI. Here we can glean that FXI has been losing ground to MCHI over the years in the shape of a descending channel, but within the framework of the long-term channel, there’s still scope for more upside as the ratio is yet to hit the upper boundary of the channel (implying potentially stronger traction of FXI relative to MCHI).
Stockcharts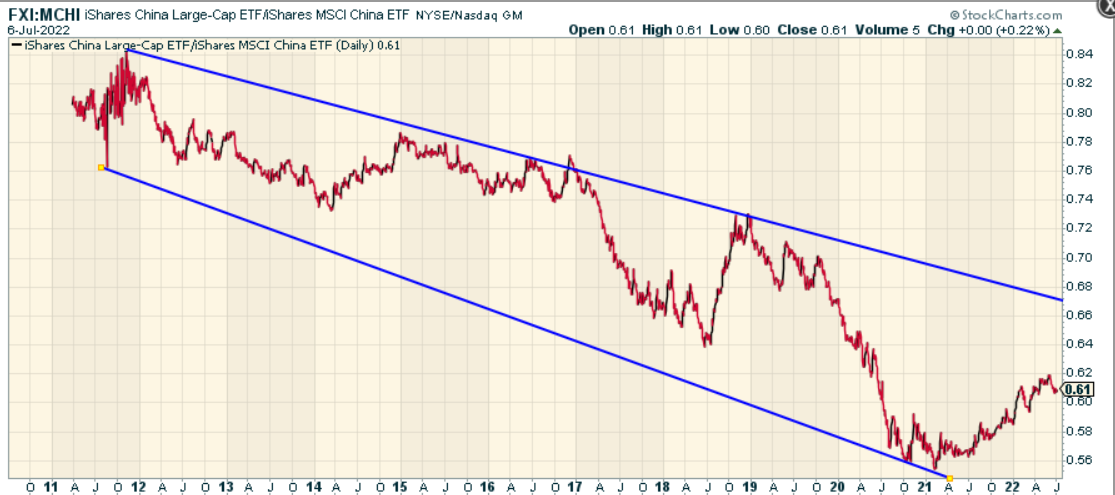
Finally, there’s also the long-term standalone chart of FXI (in line format), which gives you a sense of the structure over the last decade or so. What we can see is that this ETF has tended to oscillate between an approximate range of $30-$52. Currently, it is trading a lot closer to the lower end of the range, after having bounced from levels of $30, a zone that had served as a key inflection point in two other instances (2011 and 2016). Once again, the risk-reward here looks quite appealing. The elevated short interest of 23% also sets up FXI as an attractive short-covering candidate relative to other options.
Investing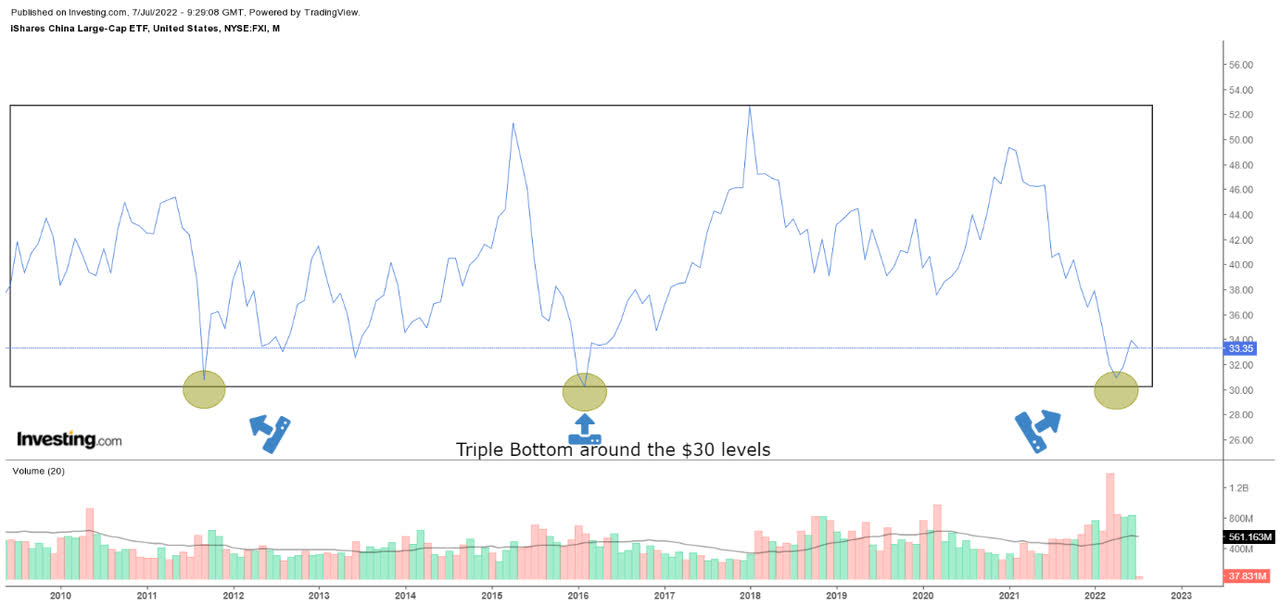
Thus, to conclude, I like the technical imprints and the risk-reward of FXI but structurally, this product suffers from plenty of flaws and it isn’t my preferred choice to play China. The mixed opinion on FXI makes it a HOLD.
Be the first to comment