

Drazen_
In this article, I provide insight into the building materials firm Eagle Materials (NYSE:NYSE:EXP). We examine the business and its success and present a case to answer the question in the headline. By looking at the segments that EXP operates in, their record and profitability, and the current opportunity, we assess whether Eagle Materials is a solid play and a foundation for growing wealth.
Eagle Materials competes in segments such as:
- Wallboards, where they are the fifth largest US wallboard producer. The focus on both costs and efficiency has allowed a reduction in wastes and low-cost production of gypsum wallboard.
- Cement, with facilities in Illinois, Kentucky, Missouri, Nevada, Ohio, Oklahoma, Texas, and Wyoming. A 2020 acquisition in Kentucky included distribution terminals and increased their capacity by about 25%.
- Aggregates and concrete focus on highway construction and maintenance, in addition to residential and commercial buildings.
Together, these are complementary segments with different growth drivers that should provide Eagle Materials with robust revenue growth and profitability over different market cycles. Recent years have seen increases in revenues, particularly in cement and gypsum wallboards (Figure 1)
Figure 1. Revenue in Eagle Materials’ segments (TIKR Terminal)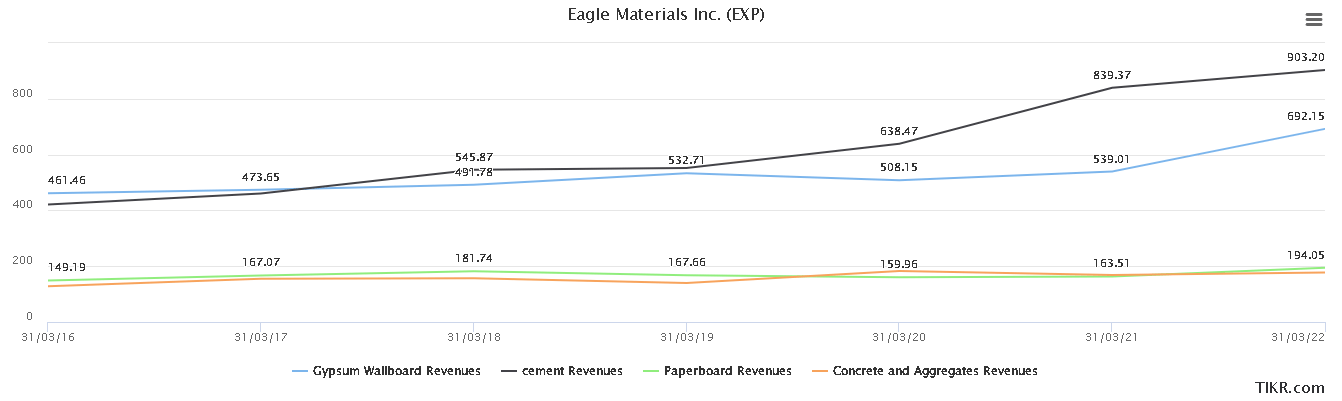
With their headquarters in Texas, they have a strong presence in multiple states often through focused acquisitions that aim to complement and extend distribution reach (Figure 2). The Gypsum wallboard and paperboard system they have established has a strong U.S. Sunbelt geographic focus.
Figure 2. EXP’s locations (Eaglematerials.com)
The environment
For infrastructure spending, there is stability over the next several years with many budget allocations set. While the price inflation over the next several years will possibly put pressure on EXP’s performance, the growth in volumes should be there. Overall, I see long-term growth in infrastructure spending and investment that will lift EXP’s results. The ASCE’s Comprehensive Assessment of America’s Infrastructure paints a picture of significant deficits that need to be addressed. The gaps will not be closed quickly or easily.
Backlogs in the overall home construction industry should support demand for many of their materials in 2022. In the long-term, the demographics of 30- to 39-year-olds are anticipated to continue to buy or build housing for families. Further, they have been able to pass on many of the rising costs with higher prices to customers.
One of the challenges is the Fed’s actions. In response to the issue, the CEO noted that:
Will the Fed overshoot, undershoot or land the plane just right? What the Fed does is not under our control. Therefore, we will do as we always have and that is focused on operating our assets safely, efficiently, and effectively. In short, we will focus on what is entirely in our control to add value to our shareholders.
Housing has been strong and, after the global financial crisis, we have seen housing starts in the USA increase (Figure 2). This is true in the South with the strongest acceleration since 2010, where Eagle Materials has a strong base to support residential housing with wallboard manufacturing and distribution. Overall, this provides some confidence going forward for the ongoing success of this segment.
Figure 2. Housing starts by region (BusinessQuant)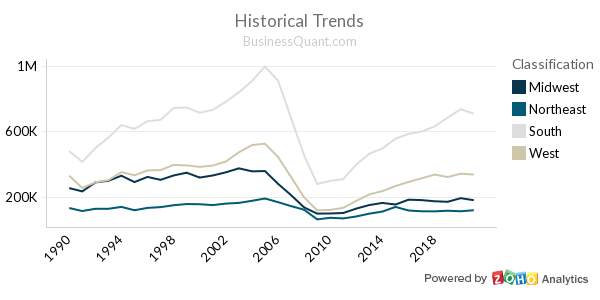
In this environment, the most recent quarterly results showed a strong increase in revenue from $476 million in 2022 to $561 million in 2023. When we look at the businesses of cement and wallboards, we can see from the Q1 results how these segments combined in residential construction, infrastructure, and non-residential construction (Figure 3). These are all areas, as noted, with future growth expectations.
Figure 3. End-use for segments in the U.S. (EXP’s Q1 2023 results)
Profitability and an economic moat
Operational effectiveness in these segments has a long history for EXP. They have continued to perform effectively, creating high levels of profit and a demonstrated ‘economic moat’ from this effectiveness. I rate EXP highly compared to their peers in terms of their overall profitability, and EXP has the historical record to back this up. For instance, EXP demonstrated over the last decade that they can maintain some key profitability metrics (Figure 4), with ROE, ROA, and ROCE dipping in 2020.
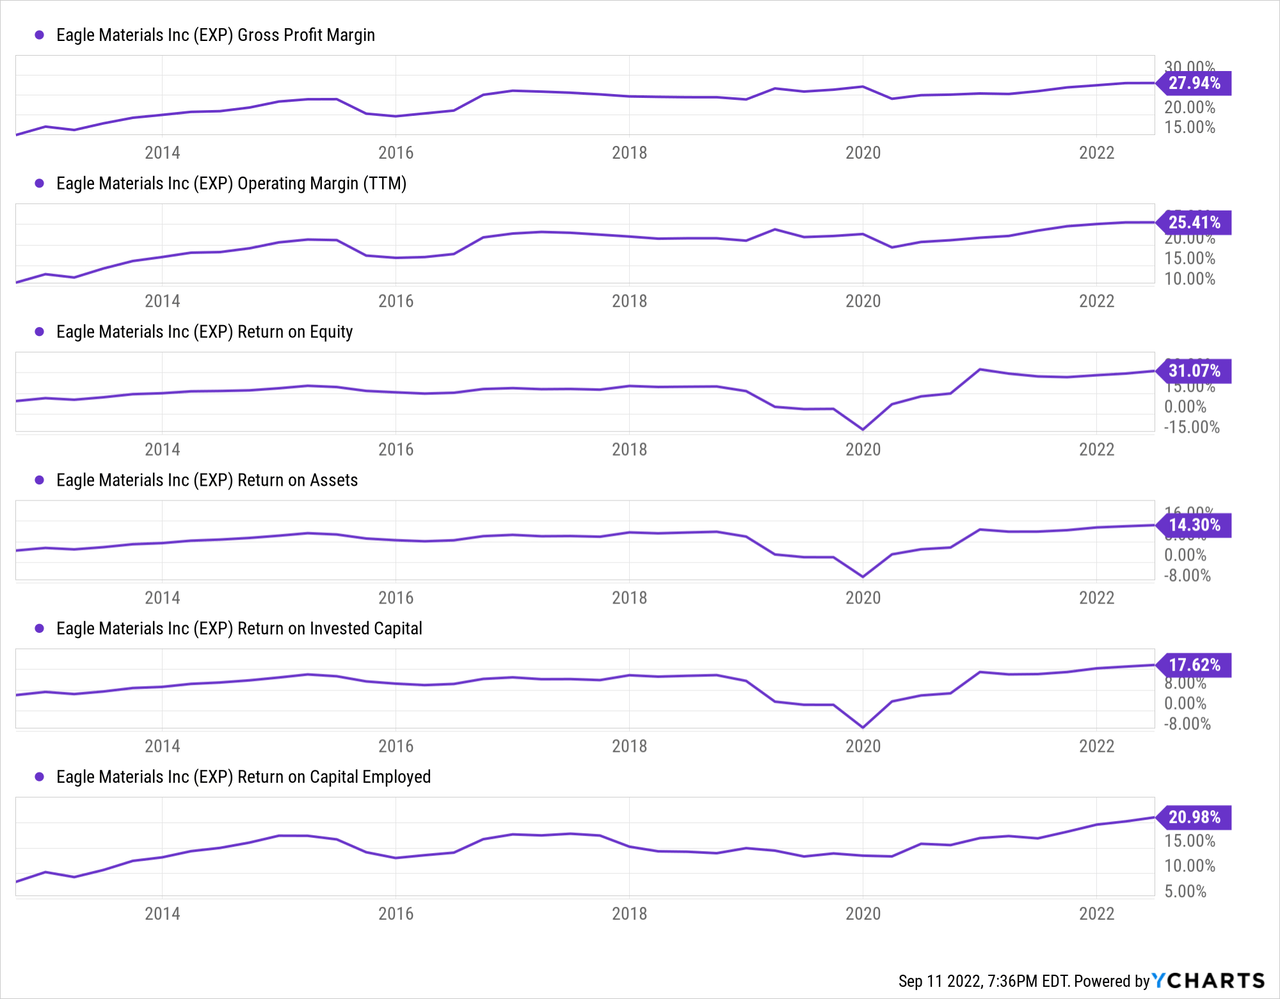
Figure 4. EXP’s profitability metrics (Source: YCharts)
With this confidence in their operational effectiveness and profitability, how do they compare with their industry? The answer is that they compare effectively, with most metrics exceeding their industry, except for the gross margin (Table 1). One number I consider closely is the ROIC, which, as we can see from Figure 2 and Table 1, appears healthy.
Table 1. EXP comparison to their industry over key profitability metrics
| EXP | Industry | |
| Gross Margin | 27.90% | 31.70% |
| SG&A Margin | 2.50% | 10.70% |
| Operating Margin | 25.40% | 13.20% |
| Net Margin | 19.70% | 9.70% |
| Return on Assets | 13.90% | 6.50% |
| Return on Equity | 34.20% | 13.40% |
| ROIC | 18.20% | 12.00% |
Source: Author, with data from Stock Rover
Capital allocation
Eagle Materials pays a dividend but, like many in materials, it is not a large dividend. However, it is demonstrably secure and safe. The Seeking Alpha Dividend Grades are reasonable; they indicate an “A+” for safety and an “A” for growth. I make it an 8.8% free cash flow payout ratio and a 10.3% payout ratio (source: Stock Rover). This is solid and shows safety.
From 2009 to 2019, the annual dividend payment was $0.40 (comprising four quarterly dividends of $0.10), followed by a single quarterly dividend in 2020, then a boost to quarterly dividends in 2021 to $0.25 per quarter. So, this is not ‘solid’ and bankable like we might expect from a dividend aristocrat, but the dividend boost in 2021 is encouraging.
Share repurchases are also judiciously used. The Q2 earnings call suggested they invested $110 million to repurchase 884,000 shares in the quarter, coming out at $124 per share. This seems a prudent and reasonable average price.
Peer comparison
Given the two segments for Eagle Materials, I’ve opted for several firms focused on cement and others in related building materials.
- Boise Cascade Company (BCC)
- Cementos Pacasmayo S.A.A. (CPAC) for an international comparison
- CEMEX, S.A.B. de C.V. (CX) for an international comparison
- James Hardie Industries plc (JHX)
- Martin Marietta Materials, Inc. (MLM)
- Smith-Midland Corporation (SMID)
- Summit Materials, Inc. (SUM)
- United States Lime & Minerals, Inc. (USLM)
- Vulcan Materials Company (VMC)
When making a comparison with three valuation measures (EV/EBITDA, Price / Sales, and Price / Earnings) against the peers, EXP appears to be near the middle of the pack. The more pure-play aggregates and cement firms (VMC and MLM) appear to have more elevated valuations; I’ve made the highest two valuations in each column bold.
In contrast, if we look at the final row, we can get a sense of the peer groups and see that EXP’s slightly undervalued in terms of EV / EBITDA and slightly overvalued in terms of P/E comparisons, and more overvalued in terms of P/S.
Table 2. EXP compared to peers on valuation metrics
| Ticker | EV / EBITDA | Price / Sales (LTM) | Price / Earnings |
| BCC | 1.7 | 0.3 | 3.2 |
| CPAC | 4.9 | 0.8 | 9 |
| CX | 7.2 | 0.4 | 7.8 |
| EXP | 8.7 | 2.5 | 12.6 |
| JHX | 11.5 | 2.8 | 20.6 |
| MLM | 16.3 | 3.8 | 28.3 |
| SMID | 13.5 | 2.4 | 25.2 |
| SUM | 6.8 | 1.4 | 12.6 |
| USLM | 7.1 | 2.9 | 15.8 |
| VMC | 18.7 | 3.5 | 37.7 |
| Summary | 9.7 | 1 | 10.8 |
Source: Author, with data from Stock Rover
Valuation and opportunities
So far, I’ve presented some expectations for growth and demonstrated why I believe the company is a strong performer. They appear to be reasonably valued relative to their peers. Next, I look at the current valuation and investment opportunities.
I use FAST Graphs to provide context and calculate likely returns based on P/E multiples in the future, using the analysts estimates of EPS and then the difference between where prices are now vs where they would be at a future time relative to the expected earnings.
Keep in mind that the analysts’ estimates of EPS are frequently wrong for EXP, as they are for other firms dealing with materials and construction. For example, FAST Graph’s Analyst Scorecard shows a 50% hit or beat for two-year out estimates from analysts (20% margin of error).
Figure 5 presents the FAST Graphs forecasting calculator with 13 analysts providing estimates to the end of the 2024 financial year and four until the end of 2025, with the orange line representing a 15x P/E multiple. I’ve opted to use a 15x P/E multiple while recognizing that Eagle Materials has a five-year P/E of 17.55x, which indicates the market’s premium on this quality company. My choice to use a 15x multiple is that it is more conservative and provides a more reasonable expectation.
From the calculator, we might expect approximately 78% total rate of returns until the end of 2025, or about 25% annualized rate of returns.
Figure 5. EXP analysts’ expectations for earnings until the end of 2025 and expected total rates of return (FAST Graphs)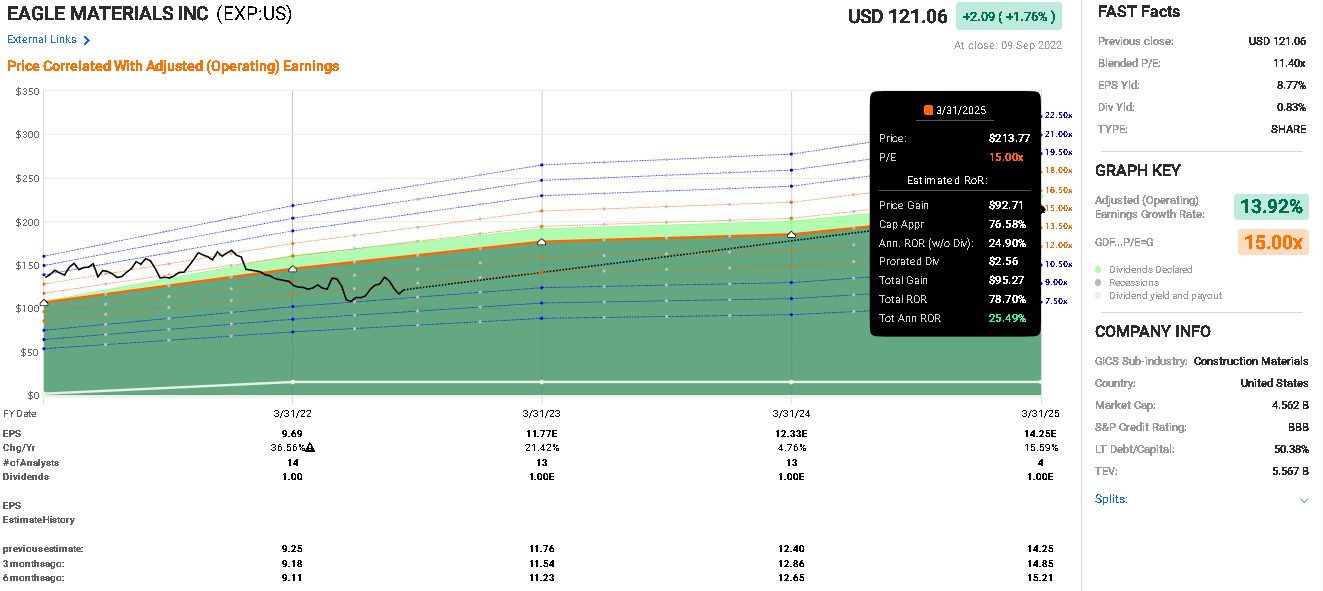
Together, this provides the expectation of future growth that appears to give a reasonable rate of return. These are based on average estimates and to evaluate how sensitive these forecasts are, I’ve opted to re-run the calculation using the ‘lowest’ analysts’ estimates I could find (Source: Finbox.io). This gives a total rate of return of 56% by the end of March 2025, or an annualized rate of return of 19%.
A final point to note is the historical analysts’ revisions shown at the base of Figure 5. An analysis of the EPS estimates from six months earlier against the current estimates suggests some downward revision has occurred. However, this is not extreme and the additional check (with the lower analyst’s estimates) suggests that even if estimates weaken, there is still a reasonable upside here.
The analysts’ expectations for long-term EPS growth over the coming five years are at 8% per year. This investment will not go ‘gangbusters’ and grow at outstanding rates, but this is not the type of investment that should. Instead, we should expect Eagle Materials to grow and compound with time. Success, therefore, requires buying at the right levels to enable us to join with the future growth of the business.
Risks
I see several sources of risk for my thesis for Eagle Materials and these are what I will be monitoring closely.
First, they do make acquisitions. So far, these have been successfully integrated. However, if an acquisition was made at too high a cost, was poorly integrated, or failed to deliver synergies with the cost structures that Eagle Materials has established, this would put my assessment of Eagle Materials’ profitability at risk. As long as it was not an overly large acquisition, I would not consider this to be severely damaging, but it would likely take several years to ride out, at which point I would likely continue to hold initially.
Second, there are economic risks to sales in the primary wallboards and cement segments. A general economic slowdown or downturn would reduce residential and non-residential construction and consequentially lower the sales in the wallboards segment (Figure 3). I agree with the assessment made in the last quarterly earnings call that this is mitigated in the short term by the existing backlogs, which provide a buffer. In the long term, the demographic of potential buyers of about 30 years of age, who are likely to aspire to home ownership, provides buoyancy to wallboard sales.
The other major end-use for their cement segment is in infrastructural projects, such as roading and bridges (Figure 3). There are risks here as while there is federal funding and long-term funding arrangements and contracts, inflationary pressures may pressure Eagle Materials’ margins over this period because of the inability to influence pricing. The situation would not be unique to them and would not cause significant harm to Eagle Materials, but it would substantially erode earnings for several years. Again, as with the acquisition risks, for these economic risks, I would likely hold and continue to monitor the situation as I do not see these as existential risks but rather they are likely to erode earnings.
Thesis
Eagle Materials is a strong company with a long track record of profitable operational performance. They appear to be reasonably valued compared to their peers. Their exposure to both residential housing and infrastructure makes this a balanced investment opportunity that is not overly exposed to one market.
My analysis of the potential returns suggests that there is a reasonable upside, even if using more conservative P/E multiples and analysts’ estimates.
The quality of the company, future expectations, and the careful dividend and capital allocation philosophy all suggest that this is an investment to help build wealth for long-term investors. There are risks but not existential and instead, they are likely to erode earnings for a time.
Because of the quality of Eagle Materials, their strong track record, and my expectation of a reasonable rate of return in the future, I rate this as a Buy and will be looking to start a position in the coming week.
Thank you for taking the time to read this analysis. Let me know if you have questions or if there are any other companies you think I should look at.
Be the first to comment