


DNY59
Let me begin by asking you to ponder something:
Is it a net positive or net negative when a company gets big and complicated with many different business lines?
The answer, as with most things in the stock market, is it depends.
On the negative side, too many business lines can distract and cause certain areas to get neglected by management, but on the positive side there can be cost savings, vertical integration or synergy.
Thus, it is not immediately clear whether a multi-line business should trade at a premium or discount to more focused companies. It must be examined on a case by case basis.
The Case of Iron Mountain (NYSE:IRM)
To me, the most crucial aspect of picking stocks is finding differences between how something is priced and the fundamental reality. I think IRM’s complexity is a source of opportunity because it has a huge disparity in this regard:
- IRM trades at a massive complexity discount
- IRM’s complexity contains substantial synergy
In the coming sections I will more fully justify each of these points, but the crux of the thesis is that IRM’s complexity should cause it to trade at a premium, but due to the difficulty of understanding the business it causes IRM to trade at a sizable discount. This large delta between market price and intrinsic value makes IRM an opportunistic buy.
IRM’s complexity discount
While I would typically value REITs on FFO or AFFO, many of IRM’s business lines are not comparable to REITs. We need a more universal metric that makes for a reasonably fair comparison between a diverse set of companies which makes EV/EBITDA the ideal metric.
In the second quarter, IRM generated $455 million of adjusted EBITDA annualizing to $1.82B. With an enterprise value of about $25B that is an EV/EBITDA of 13.7X.
Assuming there is no complexity discount, this EV/EBITDA would approximate the weighted average EV/EBITDA of the business segments in which IRM participates. However, each of the sectors that are similar to IRM’s business trade at much higher EBITDA multiples.
IRM doesn’t fit cleanly into any category as its business is so diverse, but it has aspects that fit into categories which I will try my best to describe below.
IRM is a REIT. Its properties, in terms of physical buildings, are most similar to industrial warehouses and data centers. Unlike warehouses, it generally does not lease them out wholesale to single tenants but rather operates the properties themselves and sells storage to a high number of customers. This business line is most akin to a self-storage REIT with a bit more of a concierge aspect.
Here are the comparable multiples of the REIT companies to which IRM shares characteristics:
- Digital Realty (DLR) is the longstanding mainstay data center REIT. it trades at 24.75X EBITDA
- Public Storage (PSA) is the main self-storage REIT – 24.77X EBITDA
- Prologis (PLD) is the bellwether Industrial warehouse REIT – 31.92X EBITDA
Beyond the rental of physical real estate, a large and growing portion of IRM’s business is services of various forms.
- Shredding
- Data digitization
- Archiving and retrieval
- Data security
- Cloud-based IT solutions
- Mail delivery organization
- Fraud prevention
The list could go on as IRM offers a wide range of services in a somewhat customized fashion to meet customer’s needs.
Once again, these do not fit neatly into a peer set as it is an unusual batch of things that are not normally part of the same company. However, I do think they collectively fit rather nicely into a couple GICS subsectors called “information services” and “business and consumer services”. Collectively these subsectors consist of hundreds of companies with wide ranging suites of products.
Aswath Damodaran, also known as the dean of valuation, maintains a great website with EV/EBITDA information on the entire market.
Looking at the 7229 stocks he includes in the total market, the average EV/EBITDA is 27.27X. If we narrow the search to only companies that are EBITDA profitable, the average is 18.19X. Regarding these sectors in particular:
- Information services – 25.81X EBITDA
- Business and consumer services – 16.01X EBITDA
- REITs as a whole sector – 26.81X EBITDA
Regardless of how you weight IRM between its business segments, its 13.7X EBITDA multiple is clearly a big discount to any of the sectors or individual companies to which is has similar sources of revenue.
This behooves looking further as to whether or not the discount is warranted. Perhaps IRM is one of those companies that has gotten too complex and unfocused such that its performance is suffering.
Is the complexity a net synergy or a net burden?
There are 2 tests which can be run in an attempt to answer this question.
- How do IRM’s individual business segments perform compared to pure-plays of those same segments?
- How does IRM’s overall growth rate compare to pure-plays of its sectors?
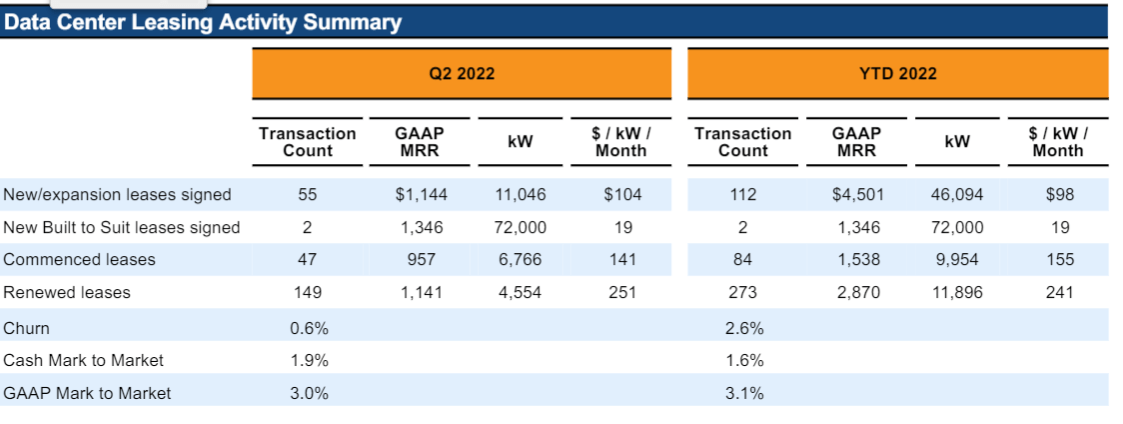
IRM vs. data centers
Iron Mountain’s data centers are thoroughly outperforming. IRM is leasing up at a faster pace, quickly achieving 100% occupancy shortly after development completes. Churn is low and IRM is achieving rollups on its lease renewals.
Supplemental
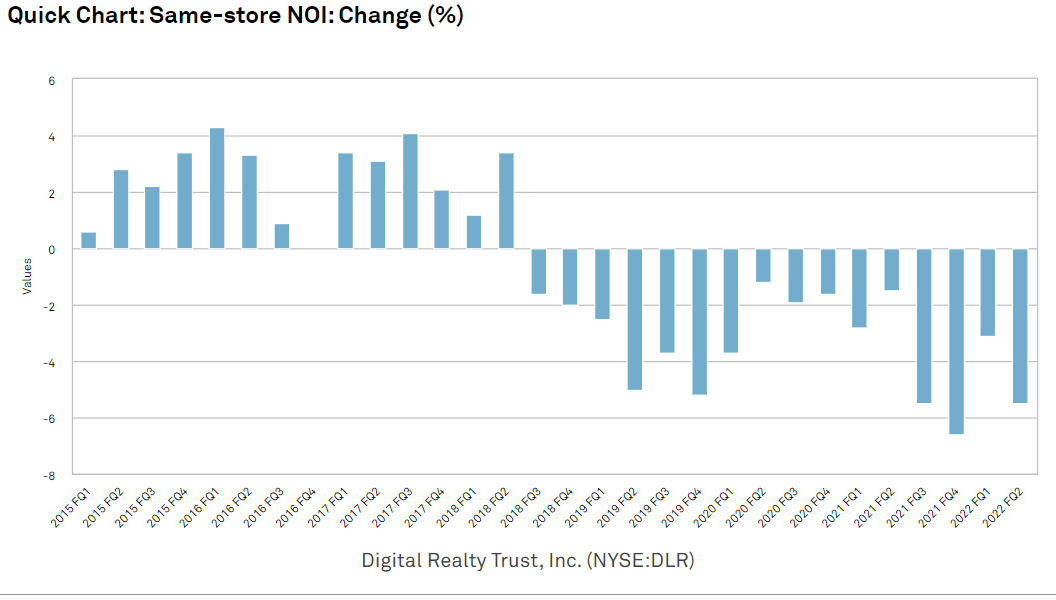
In contrast, Digital Realty consistently has roll-downs on renewals resulting in negative same store NOI.
S&P Global Market Intelligence
On IRM’s conference calls they attribute the data center outperformance to their pre-existing relationships from their other business segments.
Regarding whether IRM’s complexity is a positive or a minus, data centers clearly fall in the synergy column.
Industrial
IRM’s performance relative to industrial REITs is less clear because they are doing something so different with the property.
So the sorts of warehouses IRM owns would normally be rented out wholesale to a tenant at something like $4-7 per square foot.
IRM is instead using the warehouses to store boxes of documents, fine art, police tapes and other valuables. In so doing, IRM is achieving revenue per square foot that is many times higher than what these properties would generate as industrial warehouses.
So in that sense, IRM is drastically outperforming with its use of the property.
On the flip side, traditional industrial REITs are growing at a faster pace with companies like Prologis raising rents in the range of 30-50%.
IRM is growing its rates nicely, just not at the white hot pace of traditional industrial.
Supplemental
Overall, I would say it is neither underperforming nor outperforming in industrial. It is taking the same buildings and doing something entirely different. Both the industrial REITs and IRM are executing well.
Storage
IRM has a consumer storage segment in which it picks up items directly from customers and stores them in their warehouses. It is a premium service relative to traditional self-storage where customers would drive their items up to what is essentially a garage door and place their items inside. Self-storage such as that which is done by PSA is a fairly efficient business because the real estate costs are low. IRM’s concierge style self-storage is similarly efficient in that it utilizes space in the warehouses they already own that would otherwise be vacant.
It is not a large segment by any means, but it is exceedingly high margin. I see it as a clear synergy as they are extracting extra revenues out of the space they already own and already use for a different purpose.
Tech And Services
Historically, IRM’s service segment has been dominated by paper shredding. It is a vertically integrated business that fits naturally with its document storage providing a cost effective and secure way to dispose of documents that are no longer wanted.
Shredding revenues come from a combination of the customer paying to get their documents shredded and the resale value of recycled paper. As such, it has had some volatility with pricing of recycled paper. A few years back, China drastically reduced its recycled paper purchase volumes which tanked market prices and took a bite out of IRM’s earnings. You can see some of that impact on the graph below.
Supplemental
Since that time, IRM’s service revenues have expanded into more tech, IT, and business organizational type of services.
At an increasing pace, IRM has been logging some big customer wins in this segment. Here is Bill Meaney’s description of a win on the 2Q22 conference call:
“On the Digital Solutions side, we recently won a contract with a large insurance and financial services company in the United States. They had previously only used us for shredding services, aligned with the acceleration of the digitization initiatives, they needed solutions to help them create greater business efficiencies whilst maintaining data security for the sensitive information their company handles every day. We provided a cloud-based solution to further support their work from anywhere initiatives by delivering information to their associates wherever they are in a secure and easy-to-access manner.”
The challenge for most companies that sell this sort of cloud-based solutions or CRM or other business organizational type of services is establishing customer connections. Customer acquisition cost is a massive expense for these sectors, but IRM already has the relationships. It is an overused point by now but still relevant that IRM has relationships with nearly all of the Fortune 500.
These new segments allow IRM to leverage its pre-existing relationships for new sources of revenue and the new revenues come with minimal incremental costs.
It is a small but rapidly growing portion of IRM’s revenues and a clear synergy.
IRM’s overall performance
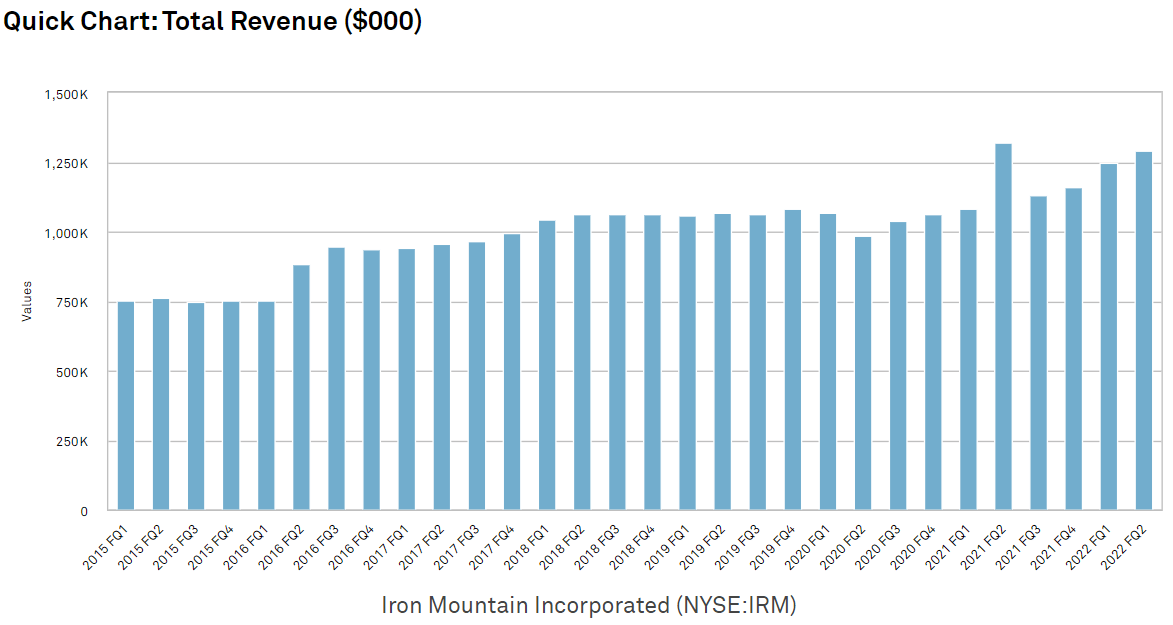
Looking at IRM as a complete company it is executing well, continually increasing revenues, EBITDA, and AFFO/share.
S&P Global Market Intelligence
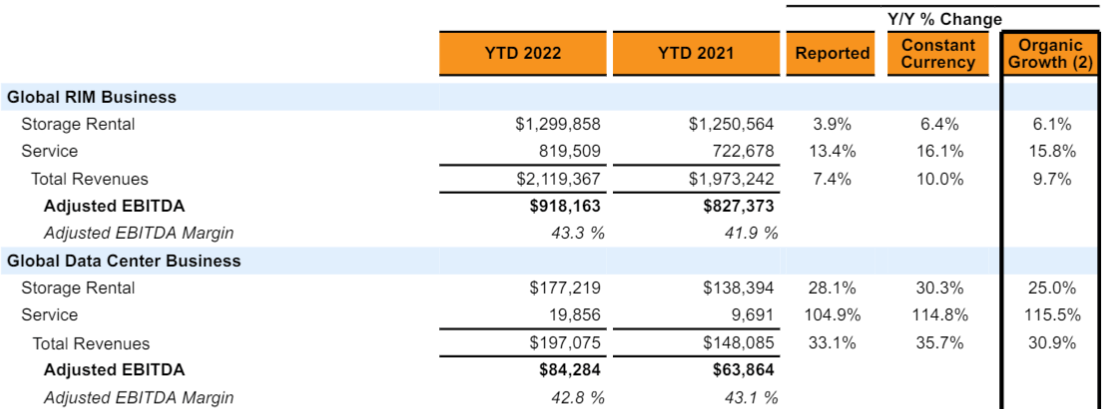
Each individual segment is growing resulting in overall revenue growth of 33.1% year over year.
IRM
This growth is not just IRM buying stuff, but rather organic growth with fully 30.9% of the 33.1% coming from same properties.
Putting it together
Given strong execution across each business segment and clear synergies I see IRM’s complexity as a bonus rather than a detractor. As such, I find it opportunistically undervalued given that it trades at about half the EV/EBITDA multiple of companies in similar businesses.
At current market price, IRM is generating a massive amount of cash flow with an AFFO yield of 7%. This cash flow in turn finances the 4.6% dividend yield while leaving plenty of retained capital for growth.
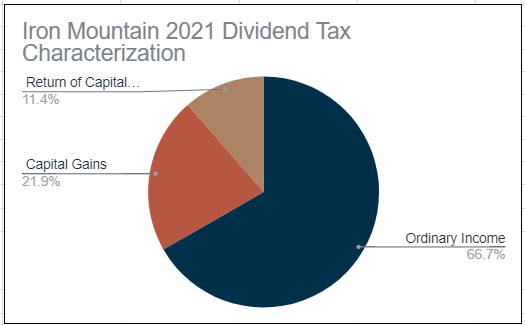
Partially tax advantaged dividend
REIT dividends come in various forms which have different tax implications. IRM’s dividend was classified in 2021 like this.
Portfolio Income Solutions Tax Characteristics Spreadsheet
2022’s classification could be different, but there is usually some stickiness between years.
- Return of capital dividends are tax deferred in that they simply reduce your cost basis on the shares allowing deferral of tax until IRM is sold
- Capital gains dividends are taxed at the lower capital gains rate
- Ordinary REIT dividends come with a 20% deduction as per Section 199A
The Bottom Line
IRM’s strong and growing business is priced at a cheap multiple, affording investors a well-covered high yield and significant upside to fair value.
Be the first to comment