

simonkr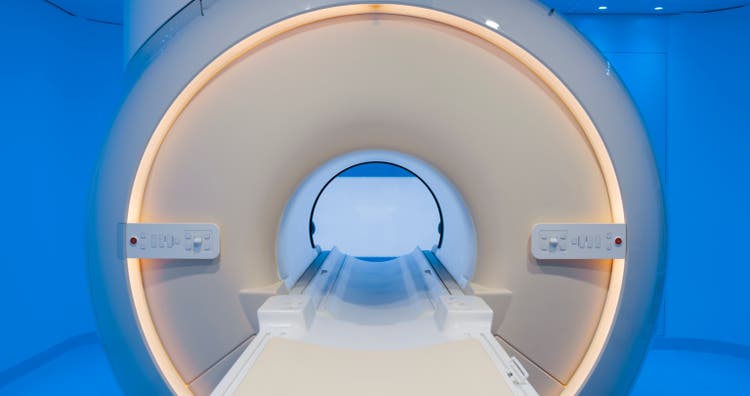
Investment Summary
Following its latest set of numbers, investors have already priced in IRadimed Corporation’s (NASDAQ:NASDAQ:IRMD) growth catalysts over the coming 12–24 months. In short, it’s been a difficult play in IRMD in 2022 and we are now less constructive on the name.
Despite a solid trajectory of earnings growth mapped out in front of us, coupled with growth this YTD, investors just haven’t been swayed on the long side. Since our last report, shares have receded a further 21%, and stock price is down across all time-frames this YTD, clipping a 38.8% loss on the chart since January.
As a reminder, IRMD is a global player in the manufacturing and distribution of magnetic resonance imaging (“MRI”) compatible devices. These are essential components required to ensure a patient safely, effectively can undergo MRI investigation. Its expertise in this segment is seen in its two main divisions, the MRidium 3860+ MRI compatible IV infusion pump, and the IRadimend 3880 MRI compatible patient vital signs monitoring system. Both systems have advantages of being able to work accurately from any location in an MRI scanning room without interference from the MRI machine. IRMD’s sales channel is primarily to hospitals and other acute care facilities. The way it makes money is through the sale of these systems coupled with disposable add-ons for each unit.
Exhibit 1. IRMD FY22 Price evolution [year to date]
Data: Interactive Brokers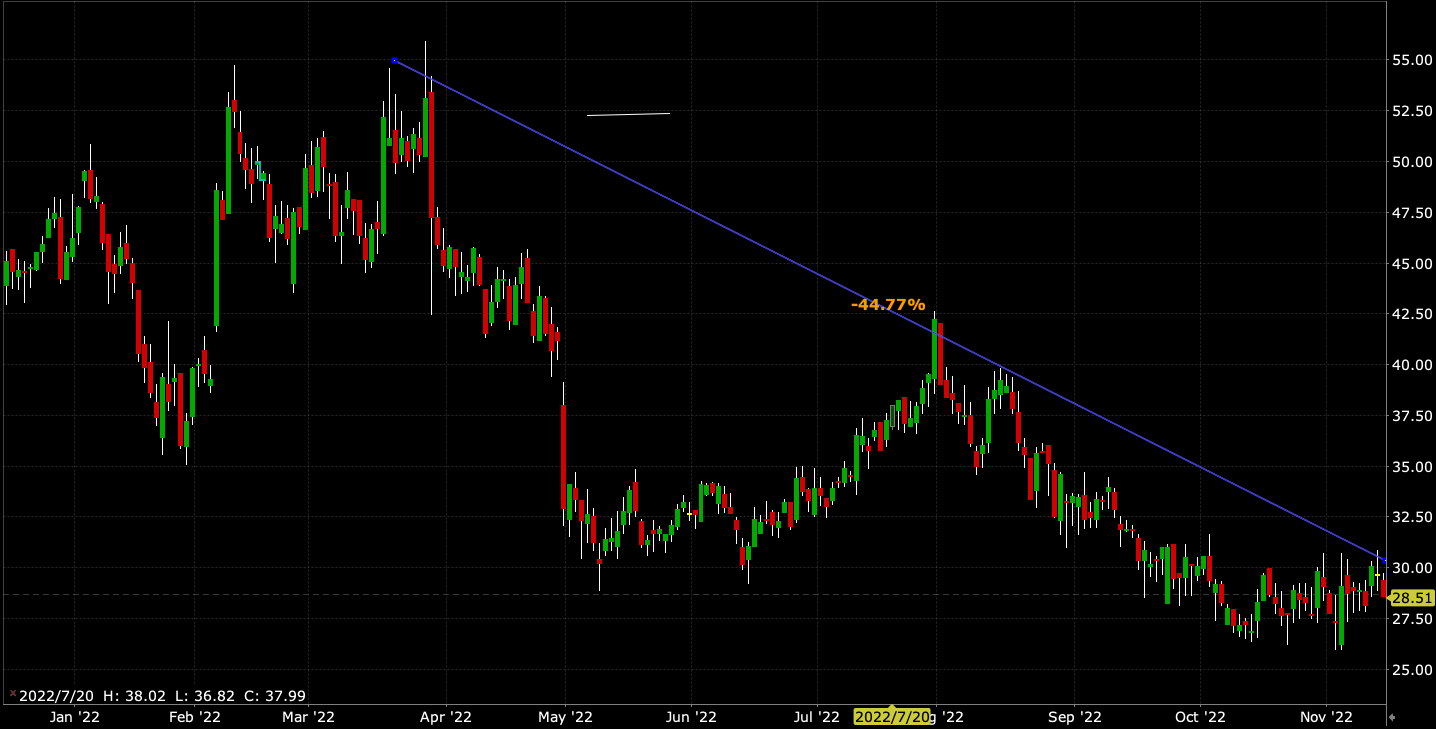
Despite challenges, there’s plenty of capital inflows into the best performing stocks in FY22. Our readers understand our strong performance in covering selective opportunities within the medtech/life sciences domain. To see some of our recent longs, and their performance, check these links below:
Back to IRMD, although it registered an improved quarter, without visibility around the market’s psychology on the stock, we reduce our position to neutral, eyeing a tactical position should market data suggest otherwise. Rate hold, price target $28.
Q3 results, strong, but under-reflected in share price
It’s worth mentioning that the company’s latest results for Q3 FY22 were marked particularly well, which overall resulted in IRMD booking a robust financial performance. We can note a 23% growth at the top line to $13.4mm, underscored by a $0.5mm lift in CFFO to $3.9mm.
Regional highlights include a 24.6% spike in domestic turnover to $10.8mm, whereas international sales were up ~16.5% to $2.6mm. The revenue split moved 100bps in favor of domestic revenue to 80.6% of overall sales.
Meanwhile, last 12 months (“TTM”) return on average equity (“ROE”) continued within its uptrend to 19%, above pre-pandemic averages. Although, trading at 5x book value reduces the investor ROE to 3.8% if paying that multiple.
Driving the ROE expansion primarily has been growth in earnings/net margin since FY20, coupled with higher asset turnover [Exhibit 2]. In contrast, the company hasn’t realized any upside from financial leverage [capital structure all equity], telling me the ROE growth has stemmed from earnings growth.
Exhibit 2. Unpacking ROE shows upside from earnings, asset turnover as hoped.
Data: HB Insights, IRMD SEC Filings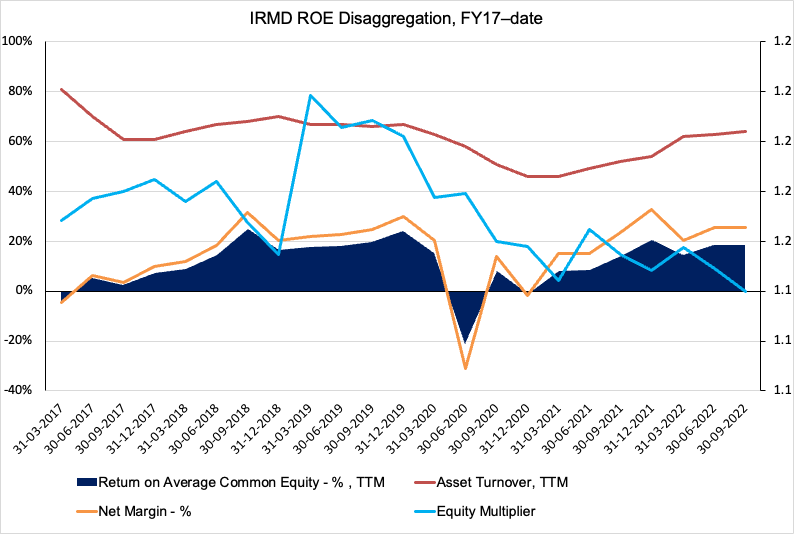
Key divisional highlights from the quarter, by my estimation boil down to the following:
1). Device revenue saw >32% upside to $9.4mm, underpinned by a 46% growth in monitor sales. Revenue mix was 42%/58% MRI IV infusion pump/MRI Compatible Patient Vital Signs Monitoring System (“monitoring systems”) respectively. ASP for infusion pumps was $30,000 vs. $33,000 this time last year.
INFU said the decline stemmed from unfavorable product sales mix dragging the mean lower. Although, IV infusion pump quarterly operating return on cost was 270bps vs 190bps the year prior. Meanwhile, the ASP per monitoring system was $46,000 compared to $41,000 for the same period in 2021, with a flat return on cost of 160bps.
2). The increase in operating return on cost points back to the domestic sales upside and the price hikes management implemented from H2 FY22. Here we should also note that disposables turnover increased 530bps YoY to $3.4mm, and with both segments combined, gross margin lifted more than 150bps YoY to 78.6% as good evidence of this. Management kept a lid on OpEx margin at 47.8% of sales versus a 48.6% margin the year prior, despite a $1.1mm YoY increase in OpEx.
3). Management remains confident on a complete 501(K) resubmission for the next-gen 3870 infusion pump. The overhang after the company withdrew its 501(K) application for FDA approval looks to be nearing a resolution. Management note that the FDA is ready to meet and address all issues before a resubmission. It says the first meeting was held in October.
4). Guidance unchanged at the top FY22 with forecasted revenue of $52.5–$53.2mm, EPS guidance revised upwards. It now foresees fully-diluted earnings of ~$1 at the upper end. It expects $1.1mm–$300,000 in stock-based comp for Q4 FY22.
Forward estimates don’t match market narrative
Projecting out into the coming 2-year period [quarterly, annual] we see growth trends remaining on par with historical rates. We argue that 27% growth at the top is a reasonable expectation for FY22, with this tightening to 15% revenue growth in FY23 [Exhibit 3].
We believe the bulk of upside will stem from sales volume in the monitoring systems segment [Exhibit 4]. Indeed, quarter-on-quarter growth across disposables and infusion pumps is also expected.
With these numbers we would argue IRMD is on track to deliver Q4 EPS of $0.26, a 16% YoY decrease. Looking ahead, out revenue assumptions pull down to a 32% and 40% YoY EPS upside in the next 2 reporting periods, respectively.
The question is, then, what’s got the market so submissive on IRMD considering the fundamental data discussed so far.
Exhibit 3. IRMD top-line growth assumptions, absolute and YoY % delta
Data: HB Insights Estimates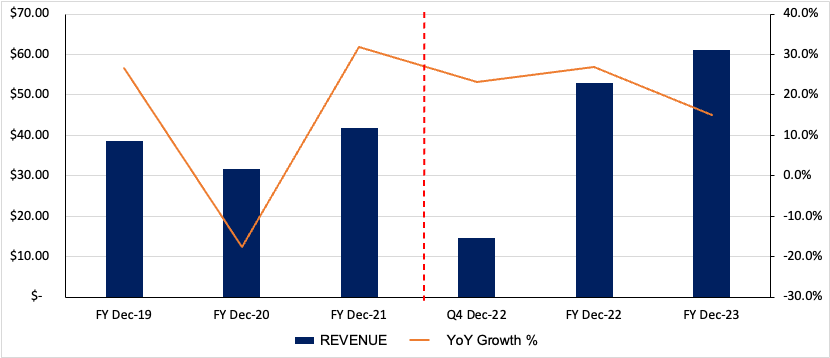
Exhibit 4. Divisional growth assumptions, FY22–FY23
Data: HB Insights Estimates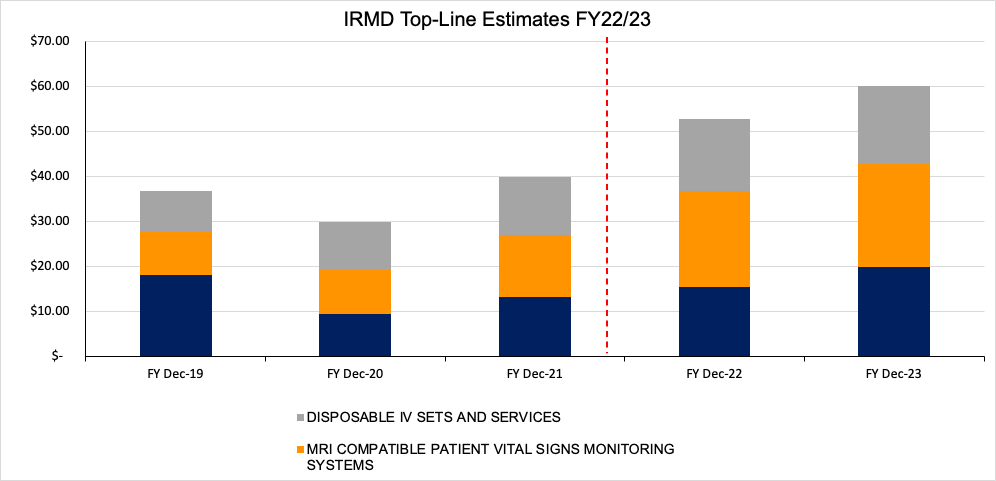
Perhaps it is the potential wind-back in forward earnings growth, however this is offset by the potential EPS rebound downstream [we should highlight our forward EPS estimates in Exhibit 5]. Or, perhaps it is explained by the available market data, as seen in Exhibit 6, showing weekly price evolution since Nov FY19.
The stock peaked in March 2022 before forming a solid, steep downtrend that’s remained in situ to date. Its first attempted recovery was met with poor volume and no accumulation, invalidating the move in my opinion.
Right now we’ve got IRMD testing this resistance line again, whereas the 50DMA is also at this point. Volume’s been flat into the move, and I’ll need more data in order to reverse the thesis from buy back to hold. For now, the chart looks bearish in my estimation.
Exhibit 5. IRMD Forward revenue, EPS growth assumptions [quarterly, annual] into FY23.
Data: HB Insights Estimates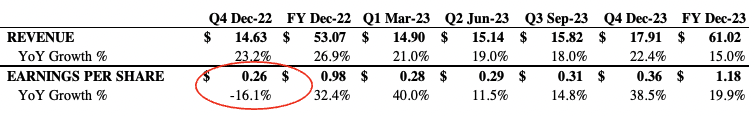
Exhibit 6. Price action unsupported by recent reversal to upside by estimation. More data needed to validate move.
Note: Log scale shown (Data: Updata)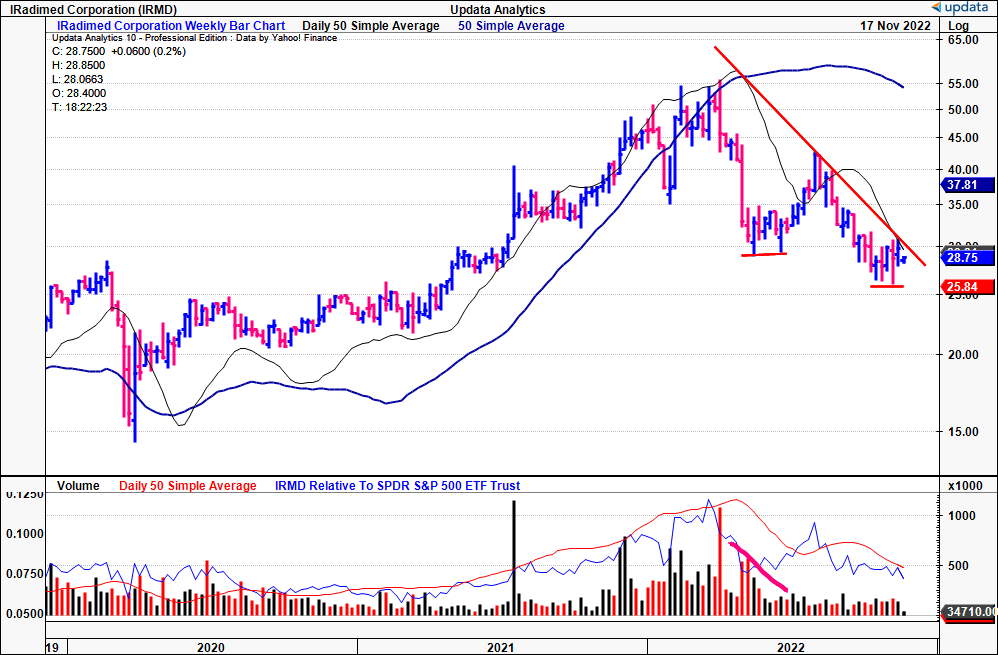
Valuation and conclusion
Looking at valuation, the mathematics of why the market consensus has re-rated IRMD so heavily in FY22 becomes clearer. We see a positive growth trend in EPS and forecast the company to print $0.98 per share in FY22. This is, however, a step back from the pace EPS advanced over the trailing 12 months [Exhibit 7].
Consensus has the stock to trade at 27–29x forward earnings, and we feel this is reasonable based on sound calculations. As such, we submit that IRMD should trade at ~$26 on 27x our FY22 projections of $0.98.
Looking further ahead to FY23, applying the 27x multiple to our FY23 EPS estimates derives a price target of $31 [Exhibit 8]. Thus, the stock is trading near the mean of the two estimates, and I suggest the market therefore has IRMD priced correctly at the moment.
Exhibit 7.
Note: Fair forward price-earnings multiple calculated as 1/fair cost of equity. This is known as the ‘steady state’ P/E. For more and literature see: [M. Mauboussin, D. Callahan, (2014): What Does a Price-Earnings Multiple Mean?; An Analytical Bridge between P/Es and Solid Economics, Credit Suisse Global Financial Strategies, January 29 2014]. (Data: HB Insights Estimates)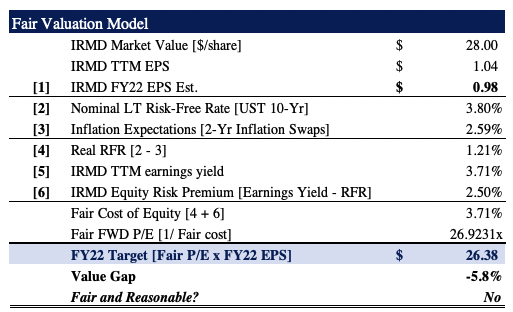
Exhibit 8.
Note: As above (Data: HB Insights Estimates)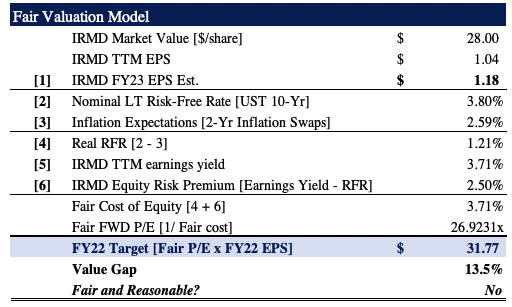
We’ve become less constructive on IRMD as the available data has morphed in H2 FY22. We are content in sitting put for now with IRMD until the stock presents with more compelling reasons to reverse course to the upside. With our revenue, EPS projections looking forward its looks as if the market consensus has IRMD priced correctly at $28–$29 per share. Rate hold.
Be the first to comment