

Dzmitry Dzemidovich
Investment thesis
IQVIA Holdings Inc. (NYSE:IQV) has been in a moderate downtrend since the beginning of 2022. While recently only showing some sporadic relative strength, the stock could perform significantly better than its industry in the past 5 years. The stock has tried to form a new uptrend, but failed and has since retraced to important support levels.
Although companies providing health information services began to perform better in the past 3 months, the industry is still the worst performer in the healthcare sector in the past year. IQV stock is experiencing a short-term selloff and has to demonstrate if this will lead to lower lows or if the closest support will allow the stock to rebound. If the support holds, my most likely price target is set at $254, but the recent setup could suggest more downside risk, which I see possibly leading to around $194-$192, resulting in a short-term risk/reward ratio of 3.75 from its latest closing price.
A quick look at the big picture
The healthcare sector in the U.S. is among the winners in the last 3 months, led by a rebound in biotechnology stocks, followed by companies providing healthcare plans and part of the medical care facilities industry. Companies in the health information industry performed worse in the group, though their negative trend of the past 12 months seemed to improve recently.
Finviz Finviz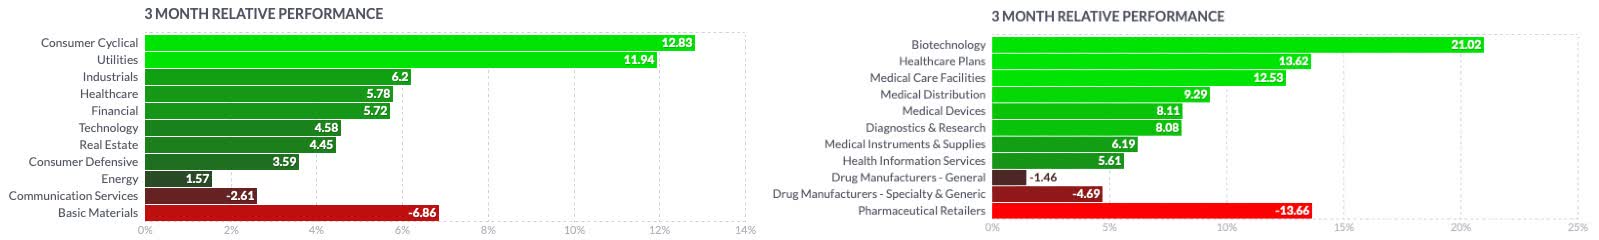

The NASDAQ Health Care Index (IXHC) began to improve in July and showed significant relative strength in August when compared to the broader healthcare sector. Despite a recent rebound, the industry reference seems to struggle to overcome its long-term downtrend as it got rejected on its EMA200 and is now priced under its EMA50, with all its most important moving averages still negatively oriented.
Author, using TradingView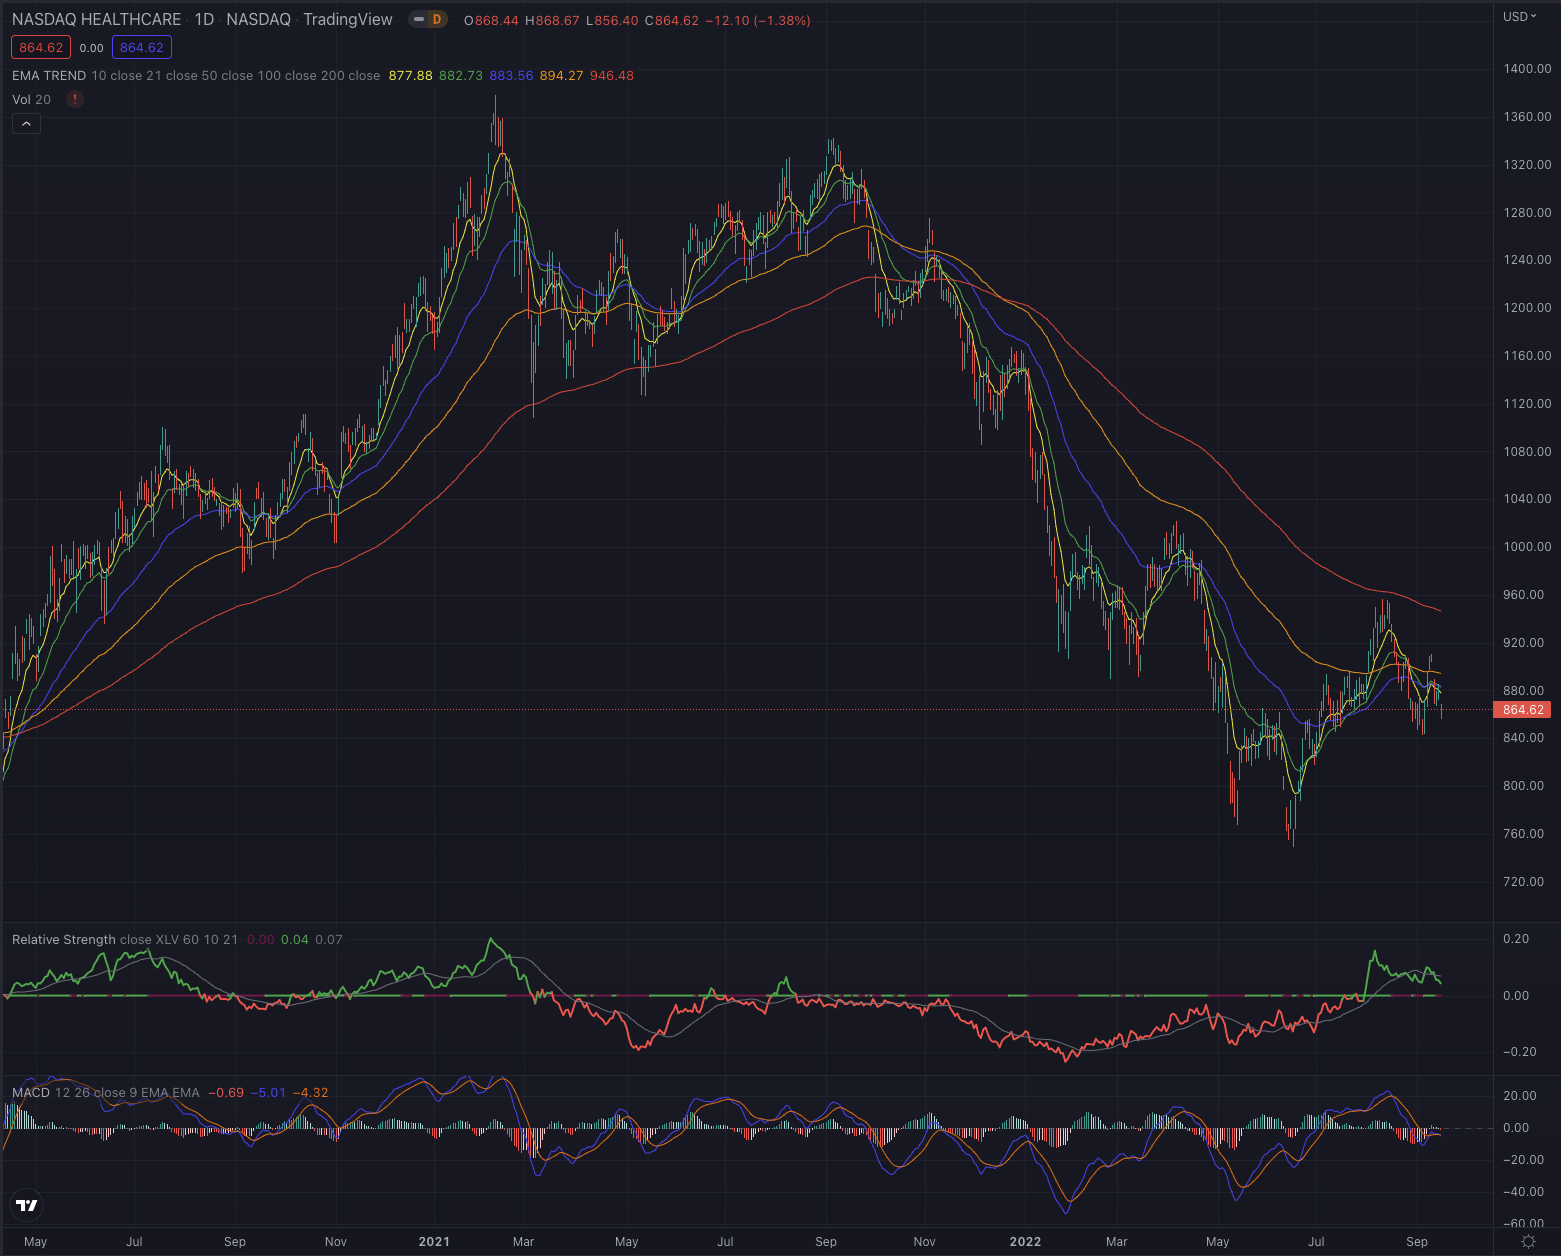
Looking back even further, IQVIA significantly outperformed its main sector reference and could establish itself remarkably better in its industry, reporting 115.83% performance over the past 5 years, almost 10 times better than its industry reference, and more than doubling the performance of the Health Care Select Sector SPDR (XLV).
Author, using SeekingAlpha.com
Where are we now?
Since my last article, “IQVIA A Smart Choice In A High-Inflation Environment,” published on April 29, 2022, where I suggested the stock may be in an unfavorable technical situation, the stock has effectively bottomed only on June 16. It instantly formed a strong rebound that led the stock 28% higher until mid-August. The recent retracement is characterized by increasing sell volume that leads the stock to break all its relevant supports, and even form a gap down in its last trading session. The EMA200, which suggested a flattening of its downtrend, has instead since turned negative again, while the stock seems quite extended under its most important moving averages.
Author, using TradingView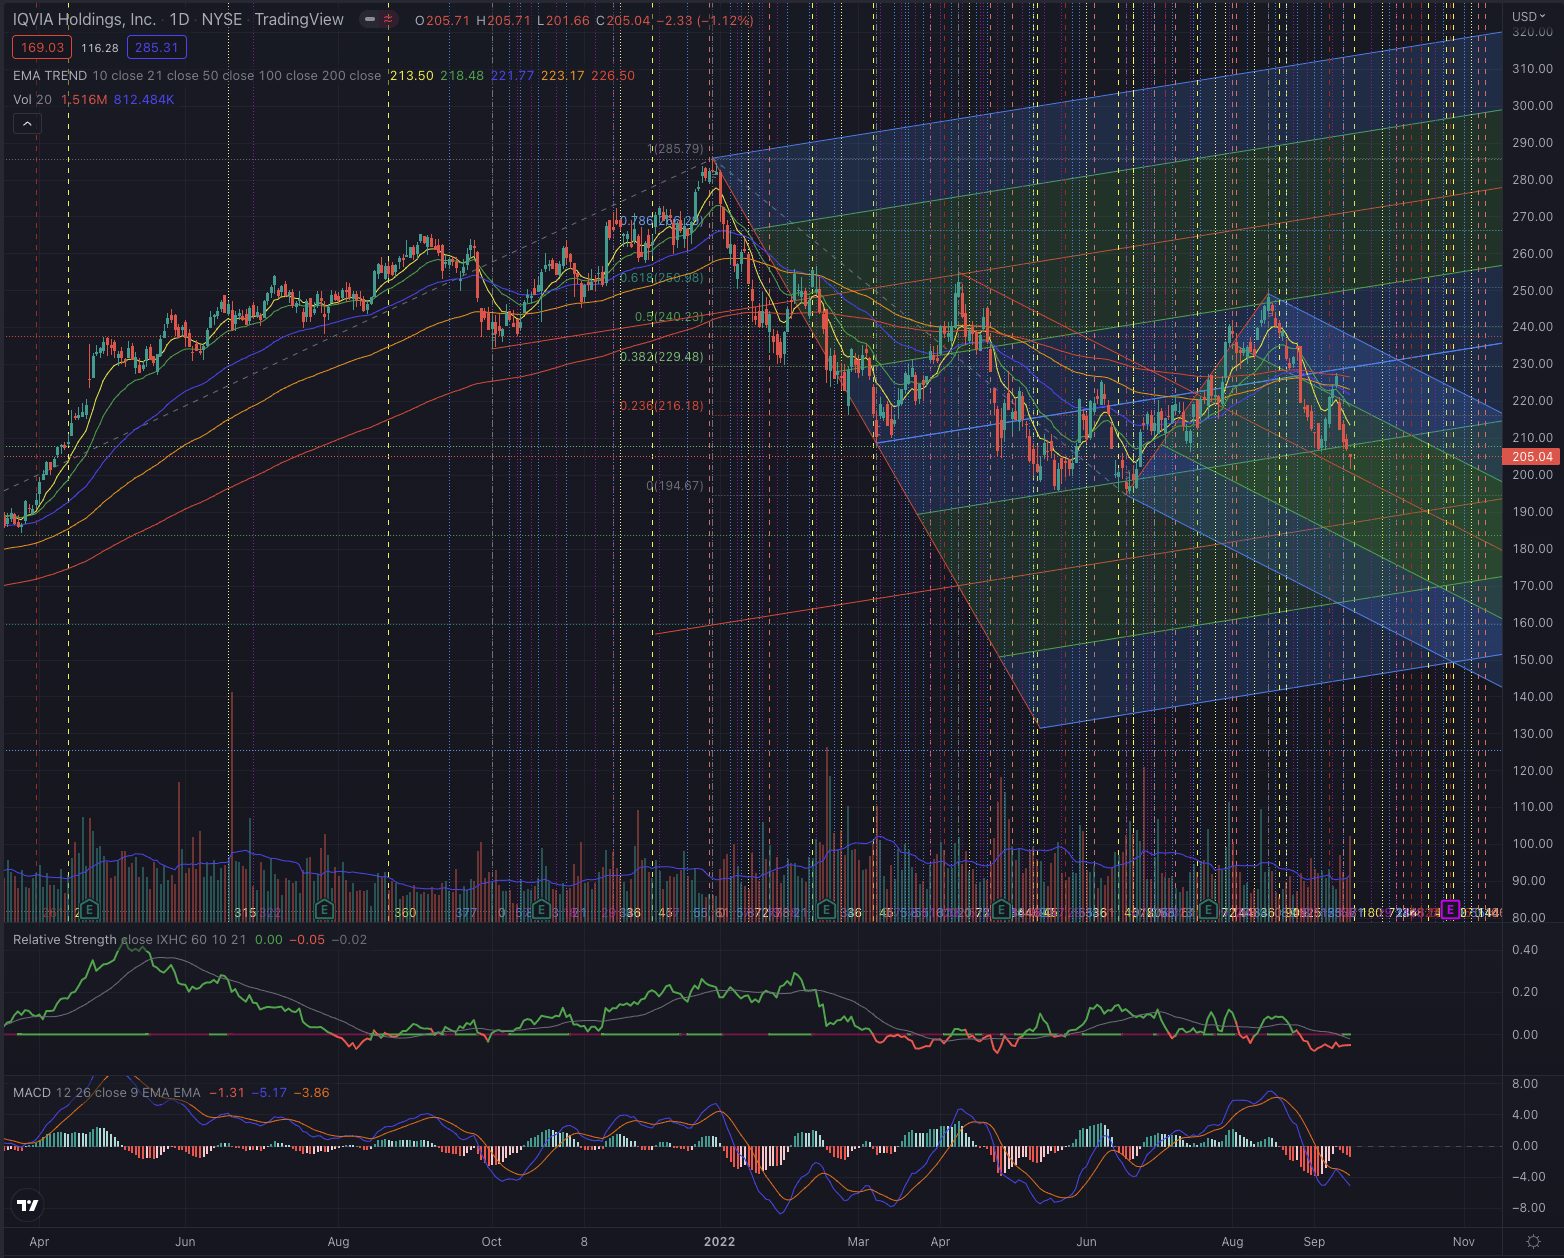
Although it’s still early to determine if a significant new downtrend is forming or if this pullback is all part of the bottoming process, it’s important to note that the last session, despite starting with a gap down and massively higher volume, has finally prevented the stock from falling further. This is a common behavior broadly observed when buyers are showing more interest at certain price levels.
What is coming next?
I expect IQVIA stock to continue to moderately outperform its reference sector, while slowly improving its performance in its industry in the near term, as the stock still looks fundamentally undervalued. Technically, the stock seems to be more likely to continue its short-term downside movement, trying to form a sound base, from which it would start its next attempt to break out if more buy-side volume shows up and the stock can overcome its overhead resistance.
Author, using TradingView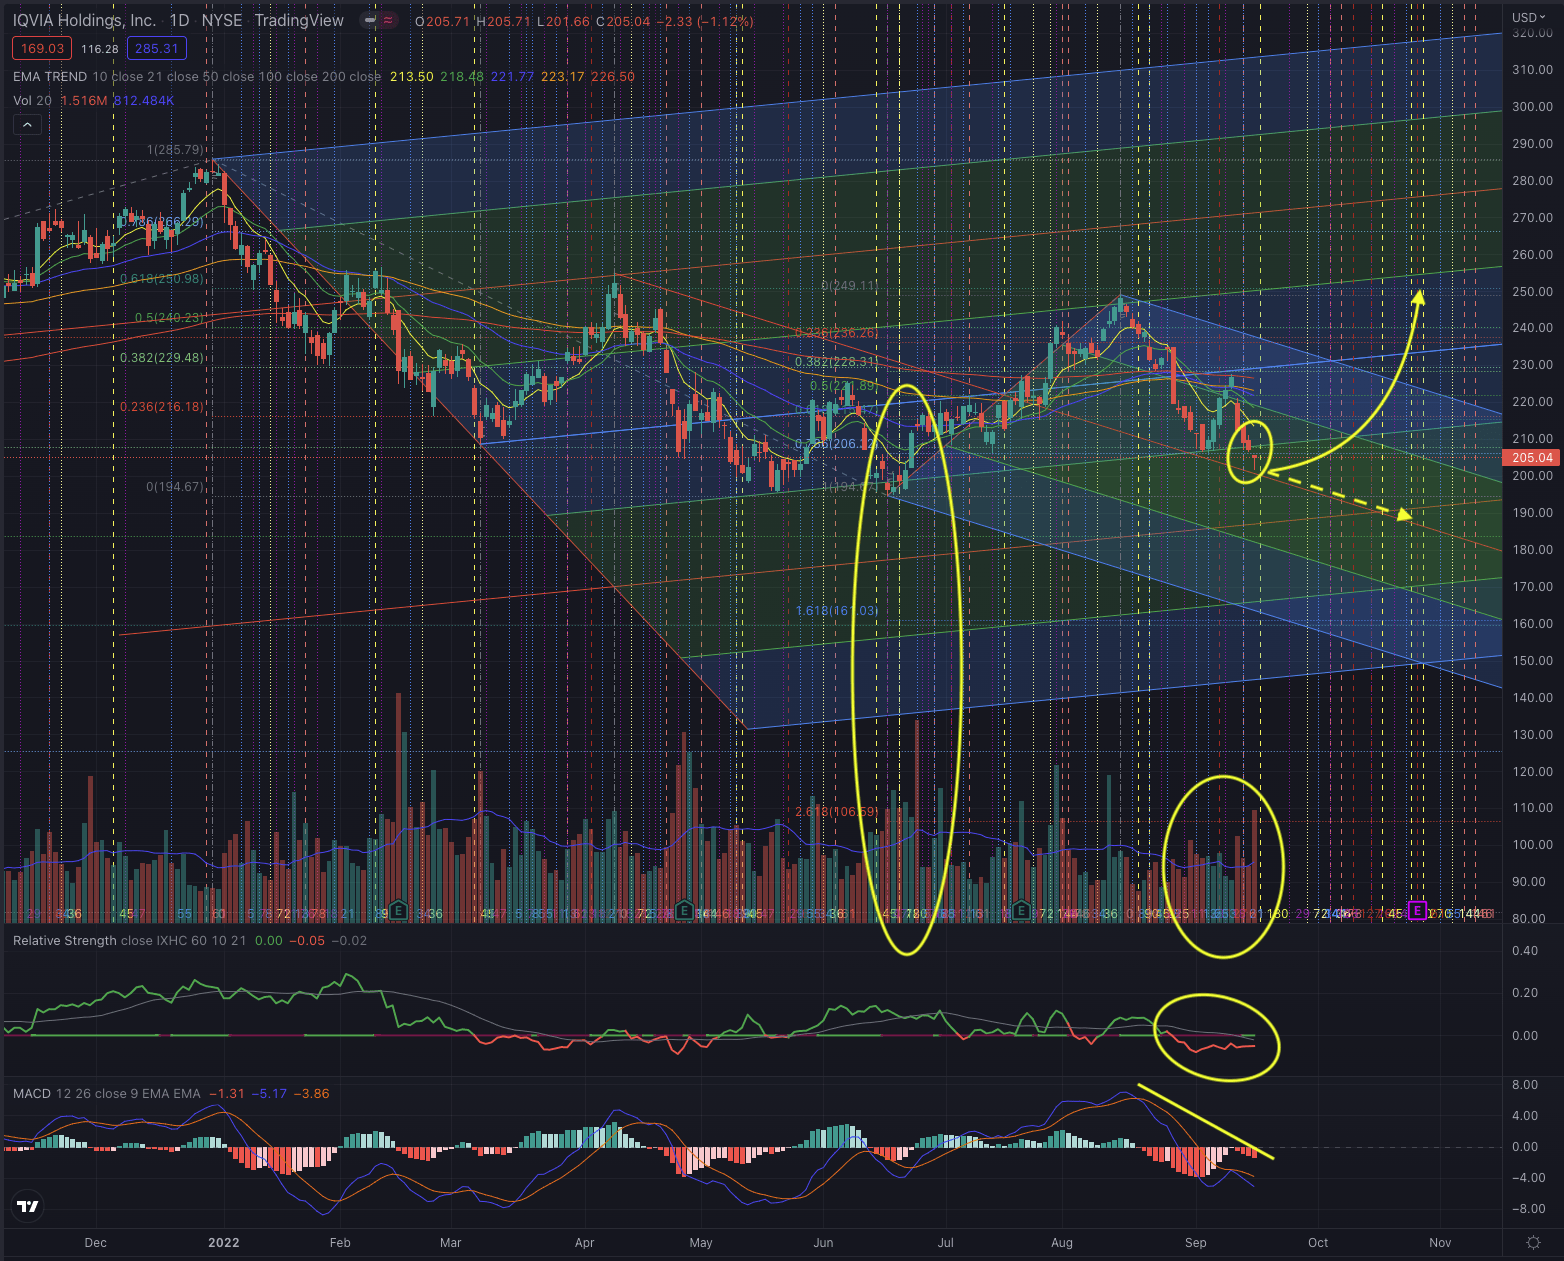
My projections suggest the most likely short-term price target to be set at $254, while I qualify the downside risk at around $194-$192, with possible catalysts coming up next, as the company will report its Q3 results towards the end of October.
Investors should closely observe the price action and how the stock behaves at the next support and resistance levels, and how an eventual attempt to overcome its resistances is confirmed or rejected, by particularly observing the trading volume in both directions and the relative strength. The stock could continue by forming an extended downtrend and reaching its low set on June 16, which would be its last support in the near term. If the stock instead rebounds, the next important resistance levels are set by its EMA50 and the ceiling of the trend channel. As the stock just made a gap down, I would put particular attention to the next sessions, and keep my stop-loss tight, to avoid being caught in a continuation of the downtrend.
The bottom line
Technical analysis is not an absolute instrument, but a way to increase investors’ success probabilities and a tool allowing them to be oriented in whatever security. One would not drive towards an unknown destination without consulting a map or using a GPS. I believe the same should be true when making investment decisions. I consider techniques based on the Elliott Wave Theory, as well as likely outcomes based on Fibonacci’s principles, by confirming the likelihood of an outcome contingent on time-based probabilities. The purpose of my technical analysis is to confirm or reject an entry point in the stock, by observing its sector and industry, and most of all its price action. I then analyze the situation of that stock and calculate likely outcomes based on the mentioned theories.
IQVIA likely bottomed on June 16, and has since attempted to form a new uptrend, but could not break out over its medium-term top, and has now fallen under important support levels. The stock faces significant overhead resistance, as it got rejected by its EMA200 on increasing volume. The next sessions will give more clarity on the stock’s direction, as the downtrend could further be confirmed, by attempting to reach the low set in June, or the stock could attempt to form a new rally, leading up to the upcoming Q3 earnings release. I qualify the stock’s most likely short-term target being at $254 and its downside risk is seen between $194-$192, resulting in a short-term risk/reward ratio of 3.75 from its latest closing price.
Be the first to comment