

Pgiam/iStock via Getty Images
Investment summary
Since our last publication on IQVIA Holdings Inc. (NYSE:IQV) shares have continued trading within a wide range across the chart, failing to catch a strong bid along the way (Exhibit 1). Nevertheless, we remain bullish on the long-term outlook for IQV investors, and in this report, I’ll run through the fundamental reasons why on a much deeper level. As a reminder, our bullish thesis on IQV is predicated on the following suppositions:
- Earnings quality and resiliency throughout numerous market cycles, including the last 3-year period.
- IQV continues to compound FCF at a long-term geometric rate of 23% since FY16′, with the company also generating a TTM ROE of 21.15%.
- Return on invested capital also a standout with the company generating ~31% in trailing ROIC at the last earnings report.
- Capital budgeting at this level a key factor in the investment debate, with IQV consistently generating a positive spread in ROIC above the cost of capital (economic profit).
- Valuations supportive with fundamentally derived estimates suggesting valuation upside should the market agree.
We encourage you to read our last 2 publications on IQV by clicking here, and also here for the FY21 analysis. In this report I’m going to delve a little deeper to demonstrate the strengths in IQV’s business model that lead us to believe the company can generate future economic value for shareholders in the long run, utilizing models used in corporate valuation to do so. Net-net, we reiterate that IQV is a buy, seeking a $254 target.
Exhibit 1. IQV 18-month price action, continues to trade within wide range sideways
Data: Updata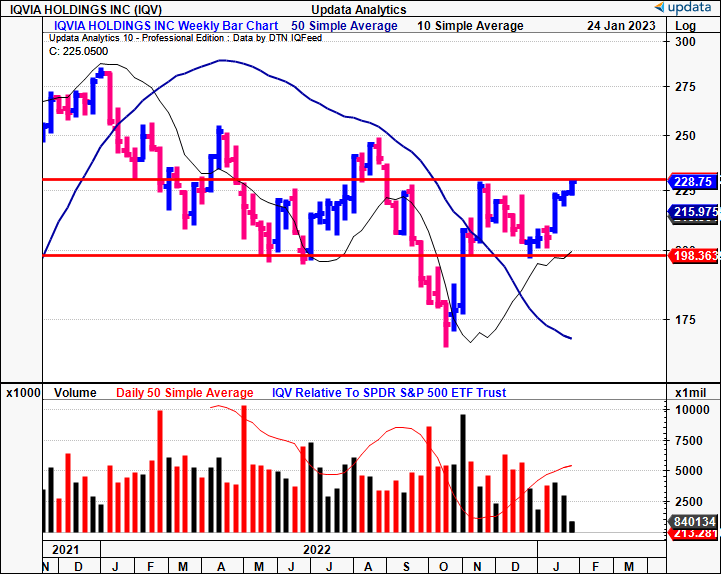
Profitability a main long-term driver for valuation upside in IQV
It’s worth noting that growth is only valuable to a company if its investments exceed the cost of capital. This is known as economic profit, otherwise economic value added (“EVA”). This forms the bedrock as to why we heavily scrutinize the ROIC of companies. We do this for two main reasons:
- To identify a firm’s ability to fund its future growth initiatives, without relying on external financing (either equity capital or debt financing).
- To understand the percentage of profit(s) that a company needs to ‘reinvest’ to achieve its forecasted earnings (or sales) growth.
Both of these factors tell us a great deal about the strengths of a company’s business model. Simply, a company that generates an ROIC above the cost of capital on an ongoing basis is able to self-fund its future growth initiatives without needing to raise additional capital, or stack up additional liabilities on the balance sheet. Moreover, per Berkshire Hathaway’s 1992 letter to shareholders, Buffet said the impact of growth can be “negative as well as positive”, where the growth in ROIC is below the cost of capital. In the same breath, high ROIC names generally need to reinvest a lower percentage of their profits in order to grow earnings (or sales) at a stated level. This means there is more cash leftover to distribute to equity holders, either in the form of free cash flows, or dividends where applicable. Therefore, we like companies with high ROIC that outpaces the cost of capital, and that are growing profits at a steady, sustainable rate.
Here we turn to IQV, having already explained its propensity to generate substantial FCF on an ongoing basis. Equally as pleasing, IQV has generated substantial value these past 2 years in the form net operating profit after tax (“NOPAT”) growth, coupled with growth in ROIC (Exhibit 2). Moreover, despite a rollover in free cash flows, the level of ROIC has remained strong, suggesting the excess capital has been reinvested wisely. Note, IQV is due to report Q4 and FY22 earnings in late February.
Exhibit 2. IQV generating substantial NOPAT and ROIC growth, reinvesting FCFs with strong return
Note: “Q4 Forecast” assumes the same level of invested capital as Q3 FY22, but forecasts the level of NOPAT. Hence, it is an ‘unclean’ measure. No changes are made to GAAP earnings to reconcile to non-GAAP accounting. (Data: Author, IQV SEC Filings FY20-FY22)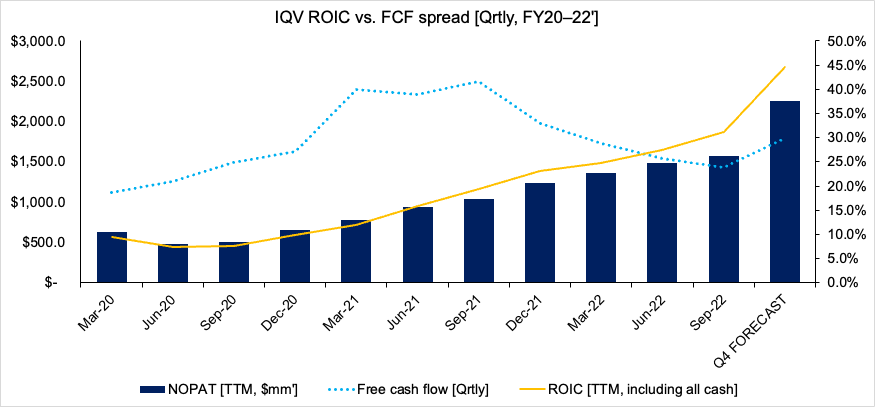
You’ll note the effect of this, in that the company consistently generates EVA above the WACC hurdle in the chart below (Exhibit 3). This, due to the widening ROIC/WACC spread, such that in Q3 FY22, the company delivered ~$1Bn in EVA at a spread of 21.34%. Noteworthy is that the company also has ~$12bn in debt liabilities on the balance sheet. Nevertheless, at these numbers, the opine the company is able to fund its future growth without the need for additional leverage.
Exhibit 3. IQV growth in EVA and widening ROIC/WACC spread, suggesting it can continue self-funding its future growth initiatives
Data: Author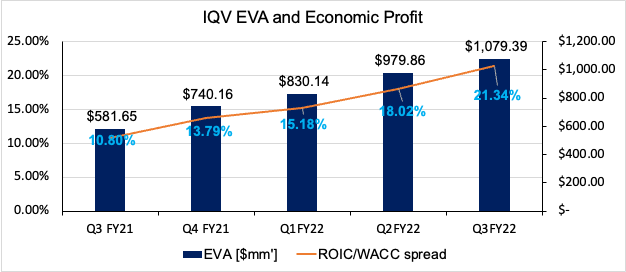
Noteworthy is that ~26.8% of IQV’s working capital is comprised of on-balance sheet cash, so we’ve made some adjustments to reflect for this. Cash on the balance sheet isn’t required for operations in IQV’s case. To account for this, research suggests that, for a company producing stable cash flows, we should include 2% of cash as working capital, and strip the remainder out as “excess cash”. We’ve done this for IQV in Exhibit 4, with negligible effects to the trajectory of ROIC, noting it still comfortable covers the cost of capital. You can see all of our calculations for the charts presented here in Appendix 1 at the end of this report.
Exhibit 4. IQV’s ROIC trajectory, numbers, when stripping out excess cash
Note: For further information how to handle excess cash, see: ” Mauboussin & Callahan (2014): Calculating Return on Invested Capital How to Determine ROIC and Address Common Issues”, Credit Suisse Global Financial Strategies. (Data: Author, IQV SEC Filings)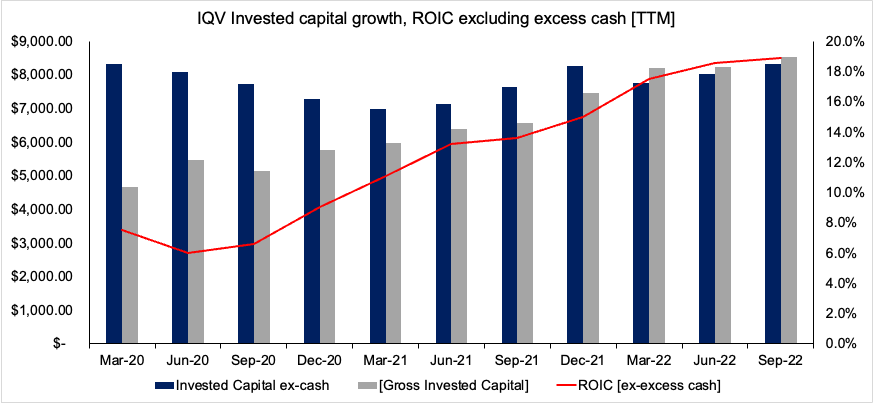
With these points in mind, it’s prudent to understand what’s driving the outsized level of ROIC for IQV, by breaking it down into its subcomponents, NOPAT margin and invested capital turnover. You’ll see that both measures have run higher over the past two years on a TTM basis (Exhibit 5). Hence, the company is not only allocating capital at a higher rate, but the NOPAT margin on this is increasing in tandem. These are strong numbers to work by in our opinion, and add another bullish tilt to the IQV risk/reward calculus.
Exhibit 5. Both invested capital turnover and NOPAT margin driving the level of ROIC for IQV (TTM results per quarter shown)
Data: Author, IQV SEC Filings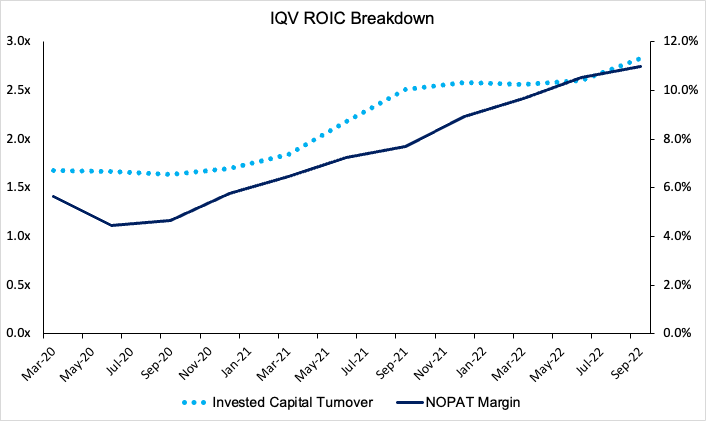
Putting it all together for the IQV investment debate
1. Reinvestment rate
The points on IQV’s high profitability (NOPAT, ROIC) are well received, but the question is, what does this mean for future value, growth, and for equity holders? In order to answer this, we turn to the 2nd reason we calculate ROIC – to understand what percentage of profit does IQV need to reinvest for it to achieve its forecasted earnings growth, which consensus places at 10.07% for FY22 to $1.94Bn (for FY23′, consensus projects 4.87% growth). We’ve already established that IQV’s investments generate a return in excess of its WACC hurdle. But this would be useless if it needed to reinvest 100% of its profits to achieve this growth rate.
Hence why the 2nd reason of utilizing ROIC in the analysis is purposeful in the first place. Epoch Investment Partners, in addition to Michael Mauboussin of Counterpoint Global at Morgan Stanley, do an excellent job of describing this concept in further detail. To take it a step further, our calculations suggest the real cost of capital for IQV is 12.25%, factoring in the market’s 2-year expectations for inflation at 2.47%. What you need to know is that the reinvestment rate, in other words, the percentage of profits needed to generate forecasted earnings growth, is a function of the growth rate divided by the ROIC.
As you’ll see below (Exhibit 6), IQV only needs to reinvest ~32.4% earnings, if it wants, to achieve EPS growth of 10.07% in FY22, leaving 67.6% as distributable cash flows to shareholders. It should be noted that there are some limitations to this model and that the mathematics changes depending on the inputs.
Exhibit 6. At its current trailing ROIC, IQV needs to reinvest only ~32% of earnings to achieve the consensus growth rate
Note: The limitations of this model assume a 100% equity financing. This is not the case for IQV, and some modifications may therefore be required to factor in debt repayment obligations. For further reading on reinvestment rate see: Blieberg & West (2019) The P/E Ratio: A User’s Manual, “Epoch Investment Partners, Inc.”; and “Mauboussin & Callahan (2014): What Does a Price-Earnings Multiple Mean? An Analytical Bridge between P/Es and Solid Economics, Credit Suisse Global Financial Strategies (Data: Author)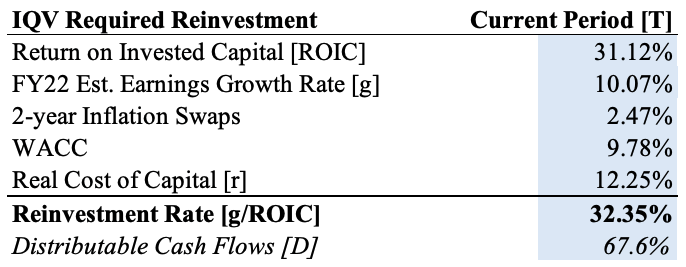
2. Valuation
As a reminder, a company’s objective should not just be to exhibit growth year over year. It should also be to create value, in other words, make investments that generate return above the cost of capital. The above analysis confirms to us that IQV is able to continue unlocking future value, and that growth is accretive to the company’s valuation at present. As such, there’s room to calculate a ‘justified’ P/E based on the company’s ROIC and earnings growth rate. This is a major step above blindly quoting P/E ratios calculated from trailing earnings, and stating this as a valuation.
You’ll note that, IQV is trading at a 45% premium to the sector at a 37x trailing P/E. The question is, are we paying a fair price for IQV at this multiple, and at its current market value? Mckinsey (2004) demonstrates a well-known method in corporate valuation used in calculating a P/E multiple that is justified from ROIC and earnings growth, thereby providing a far cleaner measure of P/E. Using this, we can understand if a high P/E multiple is warranted for IQV. We can go ahead and utilize the inputs into an output for the company’s P/E ratio (Exhibit 7). As such, a 31x P/E multiple is fair for IQV in our opinion. Assuming a standard error in forecasting, therefore, we are paying fair price at the current market price by estimation (note, this just estimates if we are paying a fair price for the company, and not a valuation).
Exhibit 7. Justified P/E using Mckinsey value driver model to calculate P/E using ROIC and earnings growth estimates
Note: For further information on the valuation model, see: “Valuation: Measuring and Managing the Value of Companies, 7th edition”, Mckinsey & Company (Data: Author)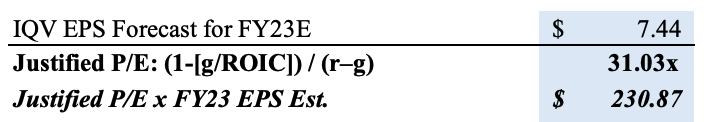
Takeaways
It’s well established amongst analyst and investor circles that a company with high economic profit can sustain a higher growth rate. IQV has exhibited exceptional bottom-line growth these last 2 years, but this would mean less if the company was reinvesting all of its profit to achieve this. As such, the economics discussed in this report illustrate that IQV’s high ROIC means it needs to invest a manageable percentage of profits in order to hit its projected growth targets. This is central to our buy call on IQV. The company’s FY22 earnings are to be released in late February, and will be crucial to vindicate or negate our investment thesis.
Alas, from these calculations, we believe that investors are still paying a fair price for IQV at its current market price. Consequently, we reiterate that IQV is a buy, maintain our previous price target to $254 in doing so.
Appendix 1.
Data: Author, IQV SEC Filings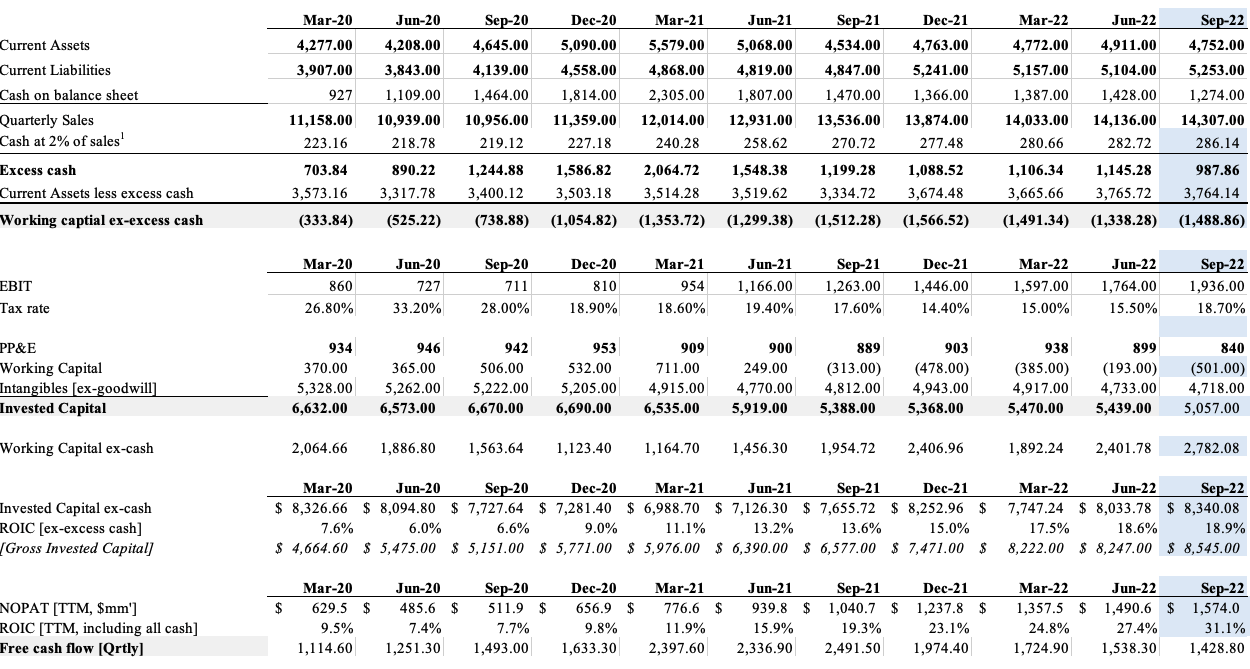
Be the first to comment