


georgeclerk
Invitation Homes, Inc. (NYSE:INVH) is a leading owner and operator of single-family rentals (“SFR”), with a portfolio of over 80K homes in 16 markets across the United States.
While there are numerous multifamily-focused real estate investment trusts (“REITs”), meaningful competition in SFRs is scarcer. The lack of incoming supply and greater barriers to entry are two constraints that continue to serve as tailwinds for INVH.
At present, American Homes 4 Rent (AMH) is their primary competitor in the space. And over the years, INVH has outpaced not only AMH but also their multifamily counterparts in same-property net operating income (“NOI”) growth. While they are lagging on a YTD basis, they are still outperforming AMH in comparative terms.
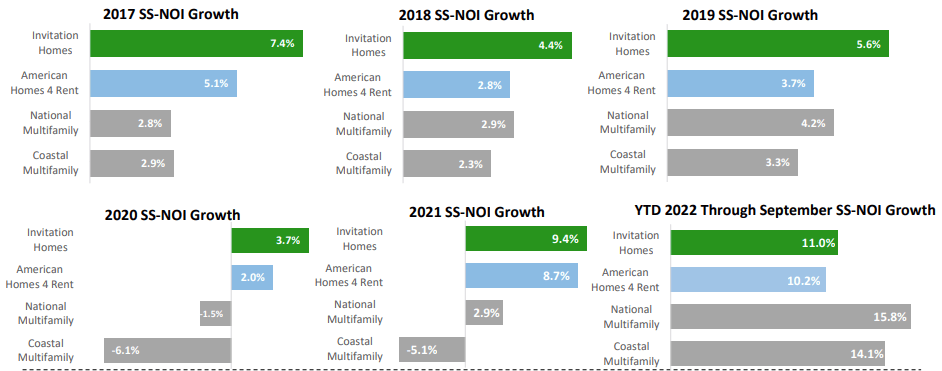
November 2022 Investor Presentation – Comparison Of SS-NOI Growth Of INVH To Peer Group
In total returns, however, INVH is currently down over 20% over the past year. The broader S&P 500, in contrast, is down 14%. And despite producing lower NOI growth, AMH is still having a better year than INVH.
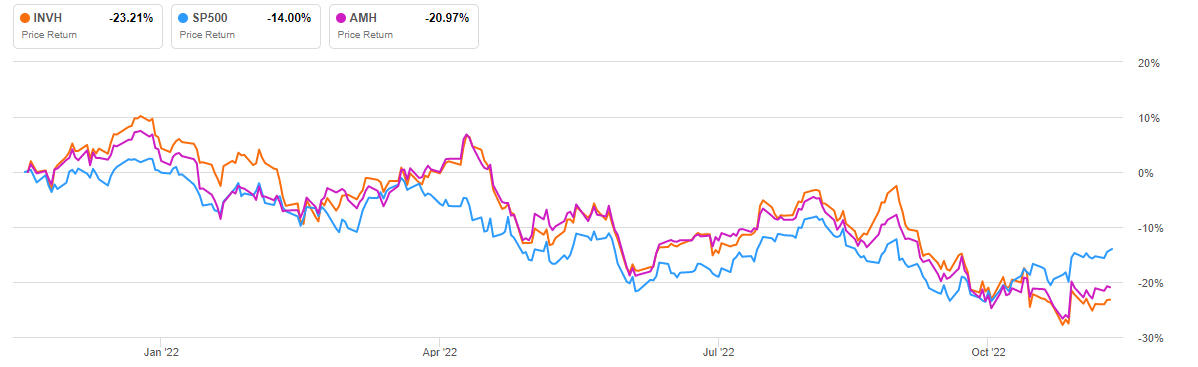
Seeking Alpha – 1-YR Share Price Performance Of INVH Compared To S&P 500 And AMH
Investors were recently disappointed by an earnings release that was accompanied by pared guidance. But the company is still generating solid results, regardless, and continues to have a positive outlook. Based on current trading levels, the stock offers prospective long-term investors upside potential of at least 10%, in addition to robust dividend growth backed by strong cash flows and a healthy balance sheet.
Key Portfolio Metrics
INVH ended the third quarter of 2022 with over 80K homes in their portfolio, 75K of which were attributable to their same-property population. Consistent with prior quarters, exposure continues to be concentrated in the Western U.S. and the State of Florida, who together accounted for over 70% of total quarterly revenues.
Within the Western U.S., exposure is more heavily weighted to both the Southern and Northern regions of California, with the two representing nearly half of the revenues generated in the region and nearly 20% of overall revenues.
Greater concentration in these regions provides tailwinds that have been in place since 2012, such as 2x better job growth and nearly 40% more home price appreciation than national averages.
Greater home appreciation is notable since increased costs of ownership in relation to rental rates often has the effect of constraining prospective buyers to their current rental arrangements.
These tailwinds, however, are partially offset by the concentration risks of being overly exposed to just a few large operating regions. In California, for example, the company is experiencing weakness relating to bad debts and turning over non-paying tenants due in part to the slowness of their court system.
In addition, at a monthly rate of $2,800, rent in Southern California is $600/month more expensive than their same-property average. This has contributed to increased churn in the market. And as a state with greater regulatory touch, there is a greater likelihood of additional rent control laws, which could inhibit INVH’s ability to drive rates higher in the future.
Nevertheless, overall same-property occupancy remained healthy at quarter end, at 97.5%. While this is down 50 basis points (“bps”) on a sequential basis, it is still 150bps better than the pre-pandemic benchmark in 2019.
One can point to increasing turnover as one red flag. But in 2019, turnover rates held above 6% all year, with the second and third quarters even at rates above 8%. And at that time, spreads were less than 5% on average. Today, roll-ups are coming in at double-digit rates on top of rents that are already well-above prior year levels.
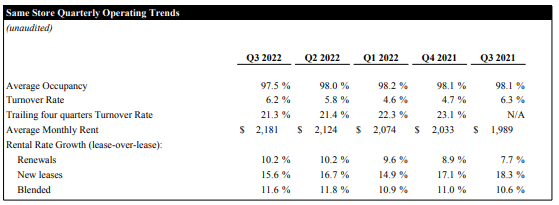
Q3FY22 Investor Supplement – Quarterly Summary Of Portfolio Statistics Within INVH’s Same-Property Population
So, while higher monthly rents are certainly driving increased churn, most are staying put for the simple reason that there are few alternatives elsewhere. One could try to seek a lower cost lease at a different landlord, but rates are at record levels across the board. And for those seeking ownership, they would have to cope with costs that are, on average, 20% more than the costs of leasing across INVH’s market, according to management, citing data from real estate consulting firm, John Burns.
Liquidity And Debt Profile
INVH has ample liquidity of nearly $2.0B, consisting of cash and equivalents and available capacity on their credit lines. In addition, they consistently generate strong cash from operations. Through the first nine months of the year, for example, they’ve already generated +$904M in operating cash flows. This is up about 15% from last year.
In addition, the cash flows are more than enough to fully cover their investing activities. With the acquisition environment expected to slow, given current market dynamics, free cash flows are likely to be even higher in future periods.
A favorable debt stack that is weighted heavily to later periods also provides increased capital flexibility.
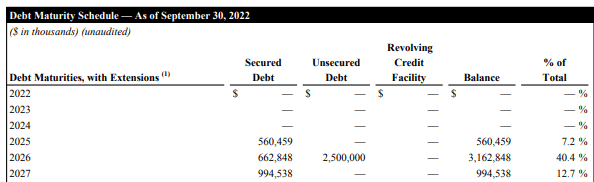
Q3FY22 Investor Supplement – Debt Maturity Schedule
Overall, their total debt load amounted to just 35% of total capitalization at quarter end. And as a multiple of EBITDAare, net debt stood at 5.7x, which is within internal targets and supportive of their investment-grade credit rating from all three major credit agencies.
With over 99% of their debt load fixed-rate, the company has very limited exposure to volatility in the current rate environment. And even if they had to take on variable-rate debt, they would have adequate capacity to satisfy the reoccurring obligations, as their current coverage ratios stand above 6x.
Dividend Safety
INVH has a strong track record of continuously growing their dividend. Since their IPO in 2017, the company has increased their dividend every year at double-digit rates. And over the last three years, it has grown at an impressive 3-YR compound growth rate of 19%.
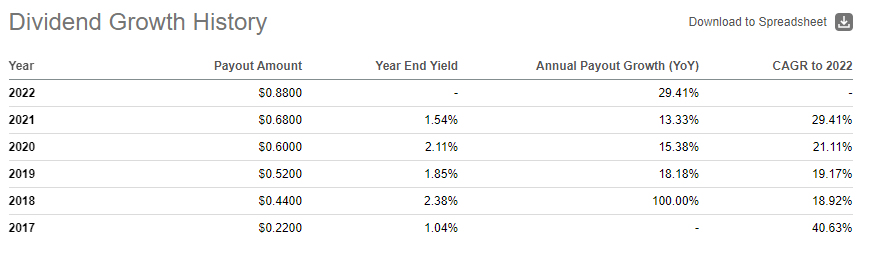
Seeking Alpha – INVH’s Dividend Growth History
Favorable industry dynamics that have enabled INVH to drive rents on strong occupancy levels is one factor in their ability to generate sufficient cash flows to support dividend growth.
Currently, the quarterly payout is $0.22/share. As a percentage of AFFO, this represented a payout ratio of just under 65%. While this is up from 53% last year, it’s worth noting that the payment is 29% higher than the prior year. Furthermore, even at the 65% payout level, it’s still lower than the sector average, which is currently about 72%.
On a full-year basis, even with reduced guidance, the payout still hovers around 63-64%. Moving forward, to support a 10% increase in the dividend at a 65% payout, INVH would need to grow AFFO by just under 8%, which seems manageable.
But even if the dividend grew 10% on stagnant AFFO, the payout would be 70%, which is still less than sector averages.
The payout, therefore, is clearly safe for the foreseeable future and is more likely than not to continue growing in future periods.
Still Inviting To Prospective Investors
INVH is a leading single-family REIT that has maintained healthy portfolio metrics throughout their short time as a publicly traded entity. While the portfolio remains strong, some cracks were noted in the current earnings release.
For one, turnover increased another 40bps from Q2. From the start of the year, turnover is now up 150bps. Double-digit rent rolls on still high occupancy levels offsets the negatives, but the trend is unfavorable, nevertheless.
At 1.7% of total revenues, bad debts were also notably higher during the current period, up 100bps from Q2 due to the unexpected increase in the time it is taking the company to address tenants who are not current with their rents. In addition to higher property tax assessments, this was another driving factor behind the scaled down guidance for the year.
Despite an uptick in turnover and bad debts, collections are still holding steady at about 97% even as the company continues to drive monthly rents higher. This, in turn, is contributing to upper-single digit NOI growth, which is an adequate rate of growth to continue supporting double-digit dividend increases.
At first glance, the stock doesn’t appear to have bargain appeal. Presently, shares trade at a core FFO multiple of 19.6x the low end of their 2022 guidance. Looking ahead to 2023 FFO projections, however, the multiple is just 17.4x.
While still a bit high on the surface, it is still lower than the multiple commanded by close peer, AMH, who currently fetches 18.7x 2023 estimates. Yet, AMH sports a NOI margin rate that is 360bps lower than that reported by INVH. In addition, their loss-to-lease is slightly shy of the 10% opportunity available in INVH’s markets.
And aside from viewing the stock purely from a multiples standpoint, it also helps to consider the current implied cap rate. For INVH, it stands at about 5.4%, based off a current enterprise value of +$26.8B and their annualized Q3 total portfolio NOI of approximately +$1.45B.
In the same period last year, however, they traded at an implied cap of 4.3%, which appears more reasonable, considering their acquisitions are being targeted at cap rates in the low to mid-5s. And for additional perspective, AMH currently trades at an implied cap of 5.2%.
At an estimated 4.8% cap rate, the stock would still be valued lower than they were last year but reasonably above the competition, which is fair, considering the company has a strong track record of double-digit dividend growth, healthy portfolio metrics, and ample opportunity embedded within their loss-to-lease. At this going-in rate, INVH would be valued at about $36, which represents over 10% upside from current trading levels. For long-term focused investors seeking dividend growth, this appears inviting, especially on any further pullback in the shares from current levels.
Be the first to comment