

ClaudioVentrella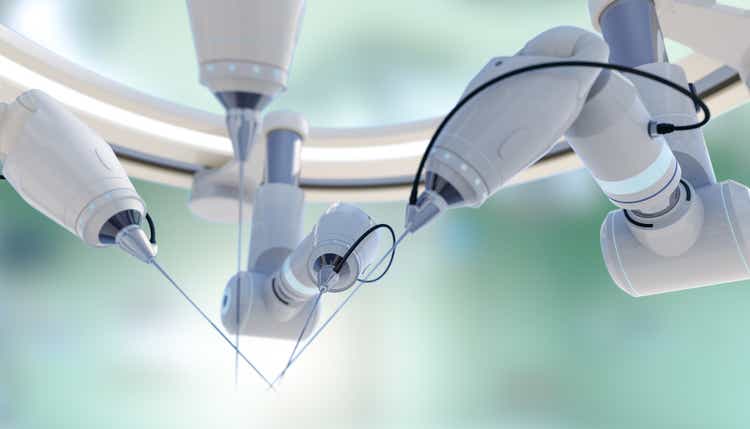
Intuitive Surgical (NASDAQ:ISRG) is a top player and a top revenue growth company in an emerging and disruptive market. The company’s sales have steadily increased over the past 10 years. In the same way, the company has continuously invested year after year in research and development and new production plants or equipment. EBIT (27.1%) and ROCE (13.8%) are outstanding rates in absolute value and above all when compared with the main competitors.
On the other side, the trend of overheads and R&D represents continuous growth and could be a concern if the sales growth doesn’t improve faster in the next future. Even the balance sheet data relating to inventories represent a critical point that deserves attention from the company. All current costs are largely covered by the growing and stable cash flow that the company can create.
The market has widely recognized the qualities of Intuitive Surgical and the share price is, in my opinion, too high as it incorporates a high future growth rate which currently requires some confirmation. Waiting to receive these confirmations, right now I rate it as Hold.
Company Overview
Today open surgery is the main surgery form. However, it could create big surgical consequences for patients with longer hospitalization times and increased costs. In the nineties, another type of surgery was born to improve patients’ lives. The new disruptive technology is called Minimally Invasive Surgery and Intuitive Surgical is one of the most important players in this sector.
Intuitive Surgical manufactures and markets Advanced Robotic Systems. These systems allow operating in front of a monitor that shows high-definition images.
Intuitive Surgical systems include the Da Vinci system and the Ion Endoluminal system. The core Intuitive System (Da Vinci) was introduced to the market in 1999 and has been active for more than 20 years.
Financial Highlights
Revenue and Profit
Seeking Alpha + Author Calculation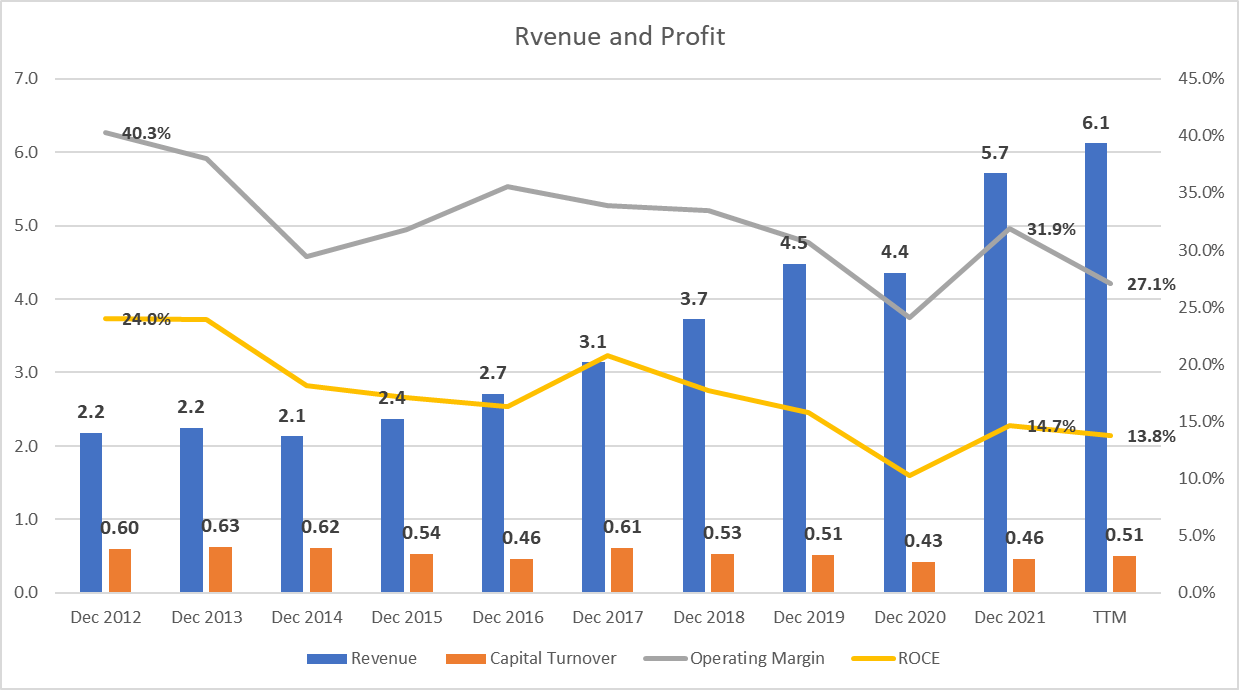
The chart above shows the trends in Revenue ($ Billion), Operating Margin, Roce (Return on Capital Employed), and Capital Turnover over the last 10 years. Turnover records constant growth with a CAGR of 10.9% (from 2.2 $B to 6.1 $B). The data underlines important growth in a market with excellent growth prospects. Operating Margin and Roce, on the other hand, recorded a downward trend, passing respectively from 40.3% to 27.1% and from 24% to 13.8%.
Although the TTM data in absolute value are more than good, these two contrasting trends are not exactly a good indicator of Intuitive Surgical’s performance and therefore it is necessary to investigate the causes.
Operating Expenses
Seeking Alpha + Author Graph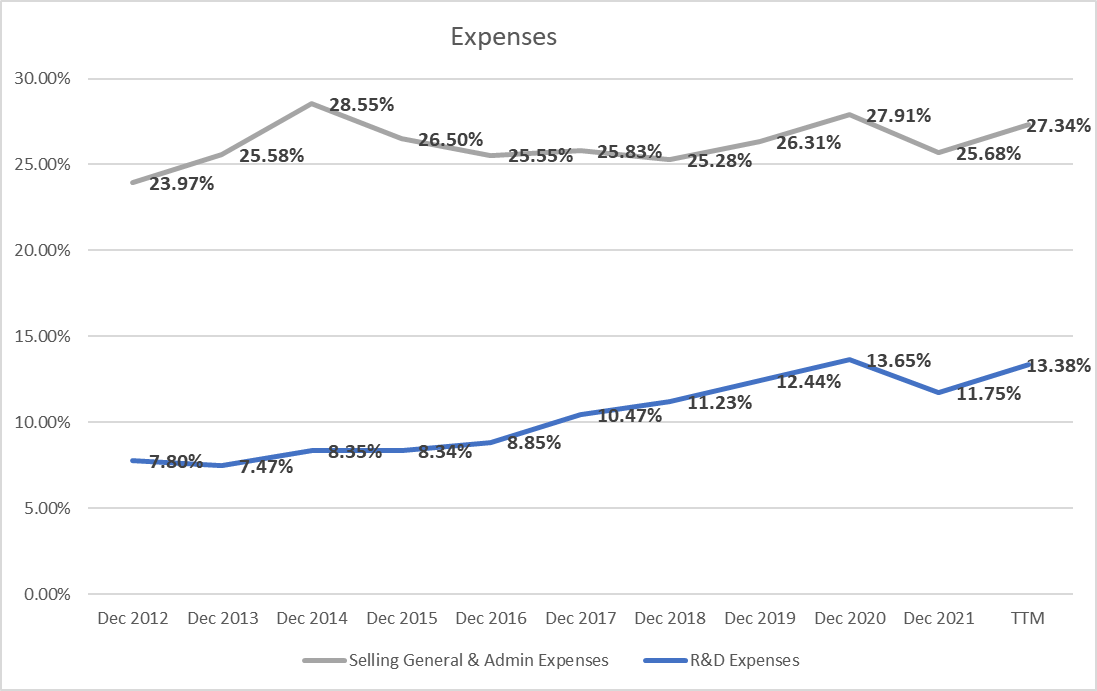
The graph shows the trend of the main operating expenses as a turnover percentage.
The first fact that deserves attention is related to the increase in R&D costs. These costs have almost doubled from 7.8% to 13.38%, eroding more than 5 percentage points on the operating margin. This isn’t necessarily a bad thing as the company itself quotes in the last Annual Report (Form 10-K):
we expect to continue to make substantial investments in research and development and anticipate that research and development expenses will continue to increase in the future
The world’s highest-paying companies’ R&D expenditure in the same sector is 15.8%. In this context, Intuitive Surgical with its 13.38% is approaching first place overall.
Related to General & Admin Expenses we can see a slight growing trend. In this case, the erosion of margins is limited to about 2 – 3 percentage points and, as the company itself points out (Form 10 -k)
we expect spending to increase as a percentage of revenue as we continue to support our customers, invest in innovation focused on the quadruple aim, and invest in manufacturing and our supply chain to ensure supply for our customers.
It, therefore, seems that the increase in expenses is totally under control and deliberately decided by the company in terms of investments for business growth.
And it is precisely revenue growth that could be the missing piece in the profitability recovery equation. According to Statista, the global minimally surgical robotics market could grow by 7.7% on an annual basis until 2030 and this figure is less than the growth recorded by Intuitive Surgical (10.9%). From this point of view, therefore, it seems that large margins of improvement on the turnover growth rate cannot be expected from the company in the next years.
My concern, as an investor, is understanding when a maximum spending limit can be reached to stabilize margins.
Return on Capital Employed
One other way to improve profitability is by improving ROCE. Moving on to the ROCE analysis we can see how it perfectly follows the Operating Margin trend. ROCE is the profitability index that measures how much all the capital invested in the company returns. It is a function that proportionally depends on two drivers: the operating margins and the capital turnover. In this case, I would like to understand how Intuitive Surgical manages the total money invested mainly as a result of the increase in operating expenses.
As far as operating margins are concerned as we discussed the trend in the previous paragraph, it remains to analyze the capital turnover. The metric measures how many sales are generated for $ 1 invested in the company.
Regarding Intuitive Surgical, the parameter is between 0.43 and 0.63 (see the first graph) with an average of 0.53 in the last 10 years. This means that for every dollar invested in the company it produces $0.53 in sales. The trend is constant and represents company stability.
Going a little bit deeper, I analyze how one of the fundamental parameters that determine capital turnover moves. In particular, a trend that needs attention is Inventory. As we can see, if we compare the incidence of the inventory level to turnover it more than doubled from 5.6% to 13.7% (in the last report).
Seeking Alpha + Author Graph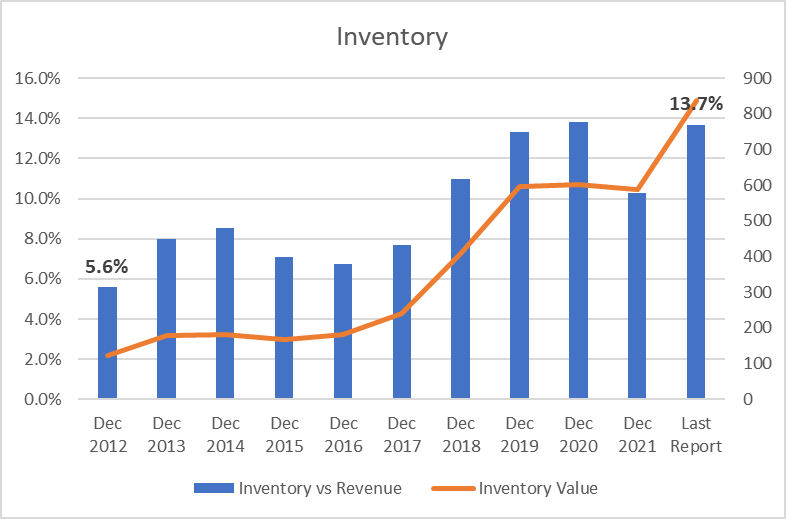
The company (quote from last Annual Report – Form 10-K) says that Inventory increased
primarily due to the increased number of systems under operating lease and usage-based arrangements and build-up to mitigate risks of disruption that could arise from trade, supply, or other matters, such as the COVID-19 pandemic.
Also:
In particular, the Company has experienced increased difficulties in obtaining a sufficient supply of component materials used in its products. … Additionally, prices of such materials have increased due to the increased demand and supply shortage. The Company is engaged in activities to seek to mitigate supply disruptions by, for example, increasing its communications with its suppliers and modifying its purchase order coverage and inventory levels.
One of the main intervention areas that the company could implement to improve profitability is precisely containing the level of inventories. To get away from the topic of COVID or the increase in inflation rates, I wanted to analyze the trend over the last 10 years and we can see a clear uptrend during the decade. It, therefore, seems that the company is implementing some actions to mitigate the disruptive effect of the increase in inventories, but it is also true that in the last Quarter Q3 these actions have not yet produced significant effects.
Free Cash Flow per Share and EPS
Seeking Alpha + Author Graph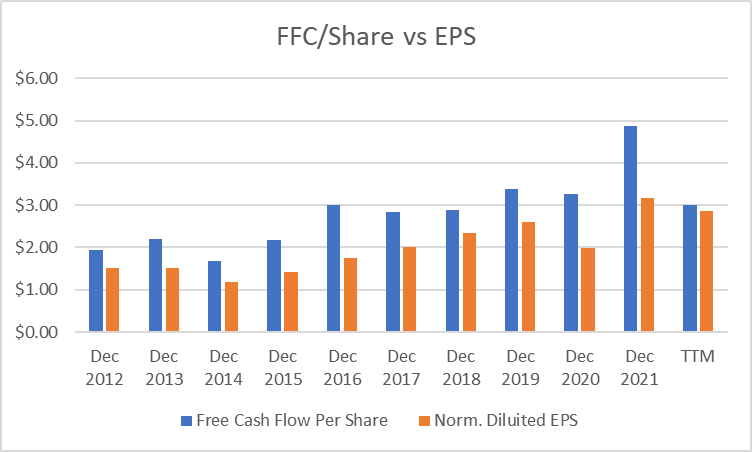
The graph shows how the FFC per Share is consistently higher than the Normalized Diluted EPS. It is a great sign of company quality. The company can generate growing profits and convert them into surplus cash available to shareholders, regularly.
The growth trend should also be underlined: excluding 2022 where a large share buyback was put in place by the company, the compounded average growth rate of the FFC/Share was 10.7%.
Valuation
Since cash flow, in my opinion, is the parameter that best underlines the potential of Intuitive Surgical, I decided to use it for the share price evaluation. Using Cash Profit as the main metric to analyze and evaluate the share’s value, I decided to identify the cash yield or interest rate of return as parameters. The parameter tells us how much every single share makes in cash and so in profit.
In a very simple way the evaluation formula is the following:
cash interest rate = cash profit per share/share price
at a current price of $260
cash interest rate= 3.08/260 = 1.2%
1.2% is very low data and we have also to take into consideration that the future earnings growth is also considered in the current share price.
Therefore, wanting to define how much value the current price takes into account the future profit growth, we can set up a calculation based on the future growth rate of the FFC/Share – 10.7% (see the previous paragraph).
Author Calculation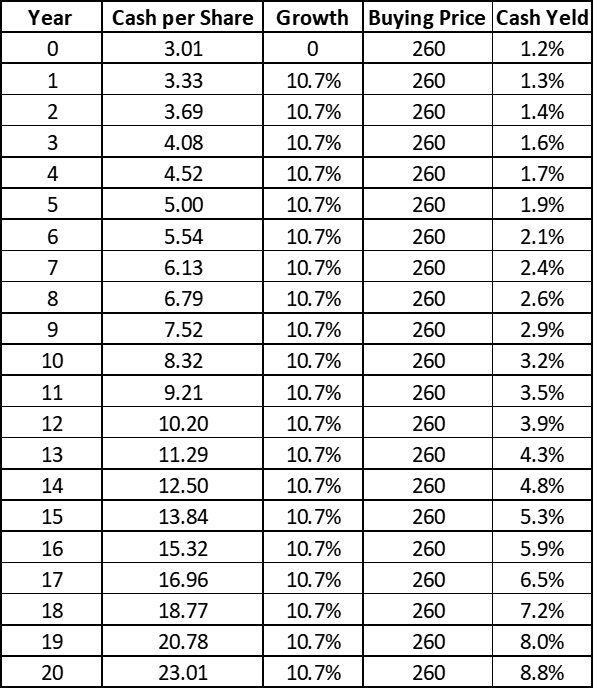
The low yield means that investors are paying for future growth and in this case, it will take 20 years of 10.7% growth in cash profits to get an 8.8% return on the $260 buying price.
As we can see, at the price of $260 the share is highly overvalued and requires a strong effort to believe that growth will be significant and sustainable in the long term.
Peer comparison
I compared the main metrics discussed in this article with the following companies:
Medtronic plc (MDT) – the market leader
Becton, Dickinson, and Company (BDX)
Boston Scientific Corporation (BSX)
| ISRG | MDT | BDX | BSX | Peer Median | ISRG vs Peer Median | |
| Operating Margin | 27.10% | 20.83% | 13.89% | 17.28% | 18.0% | 50.4% |
| ROCE | 13.8% | 8.5% | 5.8% | 7.6% | 7.5% | 82.5% |
| Capital Turnover | 0.51 | 0.41 | 0.42 | 0.44 | 0.42 | 21.6% |
As we can see Intuitive Surgical has the best Operating Margin with 27.1% vs 18% Peer Median. In terms of ROCE, the 13.8% recorded by Intuitive is 82% better than Peer Median. Also, The Capital Turnover tracks a better result of 0.51 compared to the 0.42 Peer Median.
If we analyze Intuitive Surgical in terms of Profitability and ability in the use of the Capital we can for sure affirm that the Company has the best grades and represent the best investment.
Risks
One of the main risks that the company can run is relating to the increase in the cost of raw materials also due to the inflationary context.
In the last company Report (Form 10-K) they also affirm:
Some of the components necessary for the assembly of our products are currently provided to us by sole-sourced suppliers or single-sourced suppliers.
It is an important constraint for any type of company as it heavily binds any commercial negotiation with suppliers and, in my opinion, represents a risk in terms of cost containment or even worse in terms of sales capacity.
With an ever-increasing inventory balance sheet, this risk could represent a contraction in terms of EBIT and potentially in Revenue.
From another point of view, new adoptions of the core Da Vinci system could suffer a slowdown due to the growing competitiveness. If we compare the Systems sales data of the last quarter Q3 with those of 2021, we notice how sales have gone from $1,223B to $1,229B, a figure that is almost the same. This could imply an increase in competitiveness precisely in Robotic Systems. In Q3 the other sectors of the company amply compensated for this suffering but the sign of a slowdown in System Revenue could represent a risk for future growth.
Bottom Line
Intuitive Surgical represents a solid, quality company with strong growth in sales in a booming niche market. The company is investing heavily in business growth with a reduction in margins growth. It is a solid strategy and well balanced by an important and consistent cash flow.
In terms of evaluation, quality comes at a high price and I prefer to wait for new signs of growth also in terms of margins before opening a long position. Buying at too high a price could be a serious mistake in terms of investment even in the long run. My rating, right now, is Hold.
Be the first to comment