

The article was first published to members of my service on September 26, 2022.
malerapaso
In all our future articles we will have a small intro presenting the yields of various asset classes so that the reader gets an idea of what is normal in the current environment. This includes the treasury yield curve, mortgage rates, corporate bonds, fixed-rate preferred stocks, and a number of instruments we find interesting and representative at the moment. We call this “the big picture”. After the big picture, we present our income idea in the shortest way possible hopefully without any fluff.
The Big Picture
US Treasury
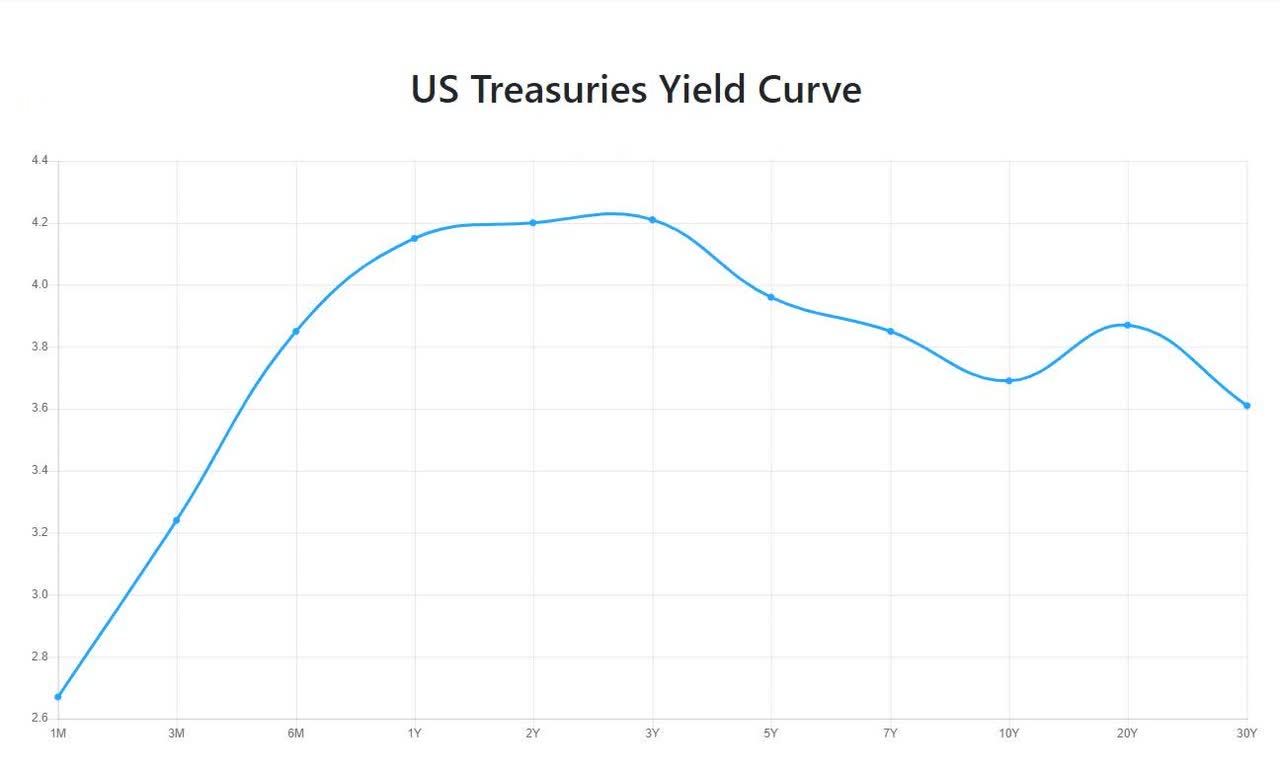
As we all know in the last weeks the US Treasury yields jumped to their highest levels in the last decade and the curve is now inverted:
US Treasury Yields (Investing.com) US Yield Curve (Fed Data)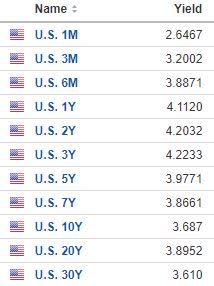
Fed Funds Rate
On September 21st last week The Federal Reserve raised rates by 0.75% and brought the benchmark to 3.25%. Fed officials have signaled their intention to keep increasing interest rates as much as needed to fight inflation. The market expectation can be seen below:
Fed Funds Rate Expectation (Cmegroup.com)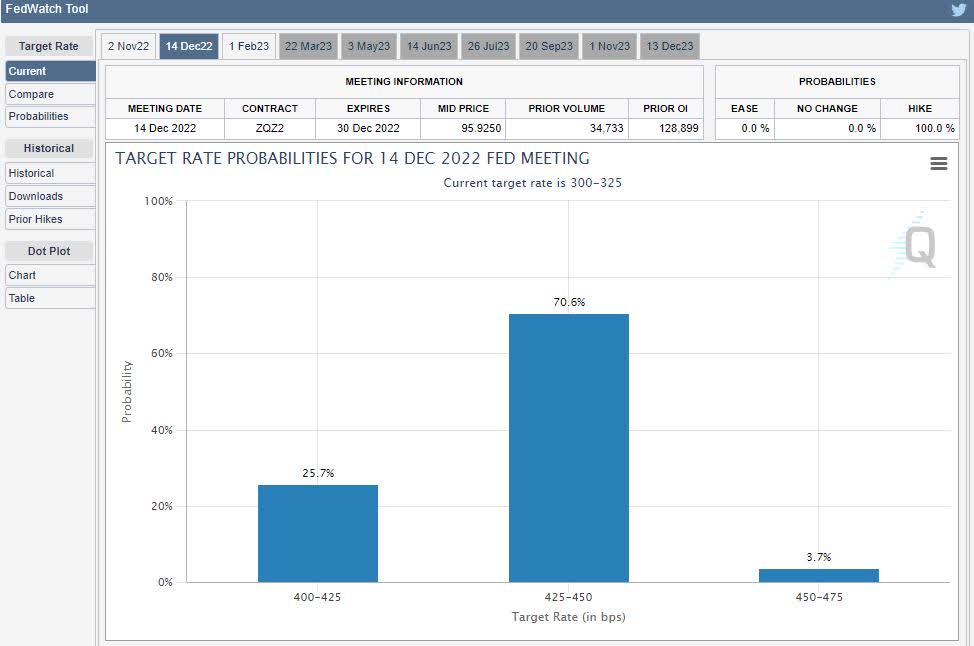
LIBOR
The London Interbank Offered Rate(LIBOR) is a benchmark interest rate at which major global banks lend to one another in the international interbank market for short-term loans. The current 3-month LIBOR Rate is 3.60%, while at the beginning of the year it was at levels around 0.2 – 0.3%. It is highly likely that LIBOR will continue to be higher than Fed Funds as it makes sense
Mortgages Rates
The average interest rate on a 30-year fixed mortgage is 6.7%, up from 3.3% at the start of the year. The average rate for a 15-year loan is 6% as of the time of writing
Corporate Bonds
To draw the yield curve we will use Back of America as a benchmark as it is supposed to be somewhat of a representative of an “A-” issuer in the corporate world
BAC Yield Curve (Interactive Brokers)
The yields are in the range of 4.5% to 6% and this is the typical yield curve for a company with such a rating
Fixed-Rate Preferred Stocks
We have over 100 fixed-rate preferred stocks with investment grade credit ratings by S&P or Moody’s. Some of them are qualified for lower tax rates some are not but in general, their yields are in the range of 5.7% – 6.5% depending on company specifics
Fixed-rate preferred stocks BBB- or higher (Proprietary Software)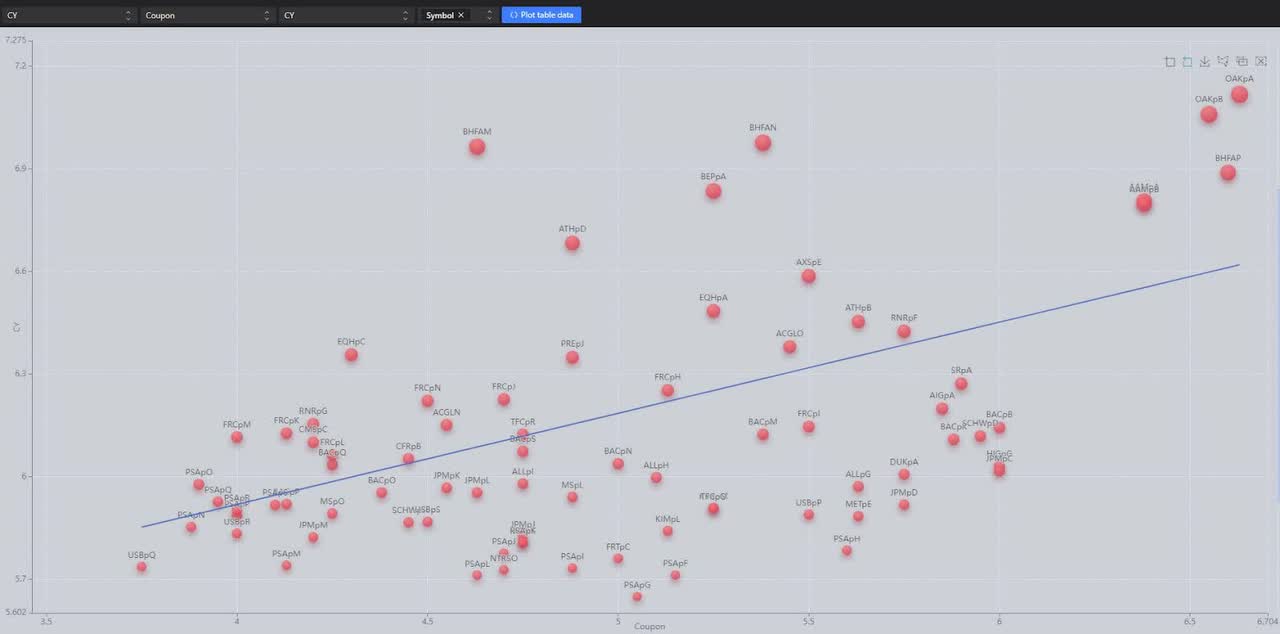
CEF’s Preferred Stocks
From a credit perspective, these are the safest preferred stocks on the exchange and their yields are in the range of 5.38% to 6.5% depending on the issuer and some tax differences.
CEF Preferred Stocks A- or higher (Proprietary Software)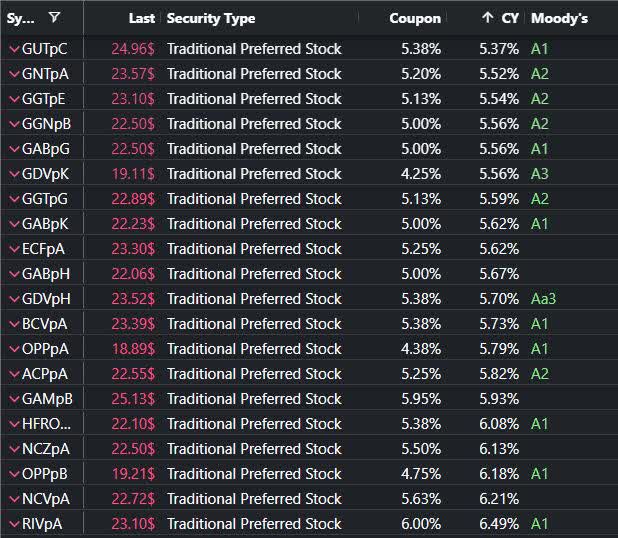
Today’s Idea
The stock that got our attention is Allstate Corp., 5.10% Fixed-To-Floating Rate Subordinated Debentures due 2053 (NYSE:ALL.PB). We believe that this is a fixed income investment that is both suitable from a credit risk perspective and from an interest rate risk perspective. It carries a BBB rating by S&P and at the start of 2023 will be floating which is supposed to fight interest rate risk
Description of ALL-B
ALL-B is a fixed-to-floating Rate Subordinated Debenture issued by Allstate Corporation (NYSE:ALL). This exchange-traded debt security pays a fixed dividend of $1.28 per year until it becomes floating-rate security on 1/15/2023, and matures on 1/15/2053. After the call date, ALL-B will either be redeemed at par or pay 3.165% above the 3-month LIBOR. As of the moment of writing this article, the stock trades at around $24.48.This security is rated BBB by S&P and Baa1 by Moody’s.
Possible Scenarios
The first possible scenario for ALL-B is to be redeemed. We think the redemption probability is quite high, considering the LIBOR rate. Let’s see the numbers in the graphic below.
ALL-B Basic Info (Proprietary Software)
ALL-B at a price of $24.48 has a Yield to call 16.17%. This is an enormous yield even in the current environment so this is the best possible scenario for an investor in ALL-B
The second scenario for ALL-B after its call date is to not be redeemed. That means ALL-B will become floating and its coupon rate will be 3.165% + 3 the month LIBOR. The 3-month LIBOR at the moment is at 3.60%, and as FED continues to raise rates it is supposed to raise as well. We will take a 4.15 % rate for the 3-month LIBOR at the call date. So the basic expectation for ALL-B if not redeemed is to have a floating rate of around 7.3% (4.15% + 3.165%). As long as the purchase price of ALL-B is below par, a possible redemption will always be positive that boosts return so the lower one can get at the moment is the floating 7.3%. Now we need to compare this to the yield curve of ALL and to its preferred stocks.
At the time of writing the fixed-rate perpetual ALL preferred stocks trade at around 6% current yield which is way lower than the expected floating current yield of ALL-B:
ALL family (Proprietary Software)
The Corporate bonds of ALL can be seen here:
ALL Corporate Bonds (Finra Website)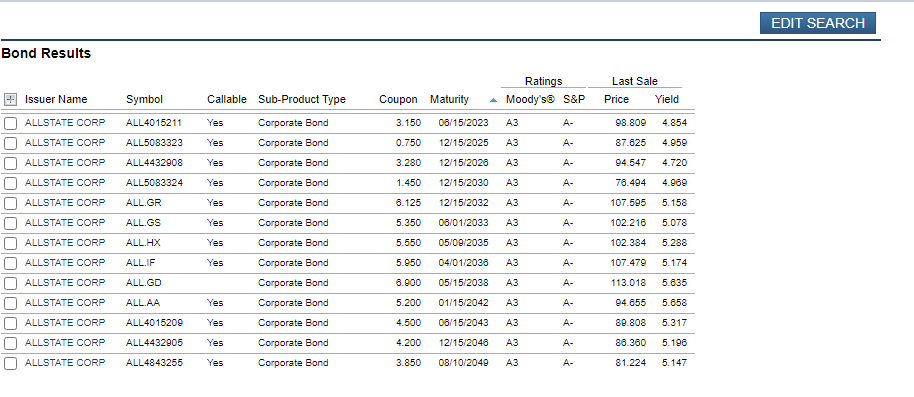
These bonds are 2 notches higher compared to ALL-B and it is up to the reader if the 2% yield spread is fair keeping in mind that ALL-B is a floating instrument with embedded protection from rising yields. To us, the comparison is very straight forward and we believe ALL-B is way superior to anything presented in the article.
What about the common stock
At the time of writing the article, the dividend yield of ALL is 2.75% and the forward P/E ratio of the company stands at around 11. The so-called earnings yield of the company may sound tasty to many investors but with the current market uncertainty the common stock lacks embedded interest rate risk protection of ALL-B and the bond is far superior from a credit perspective. We can use the price behavior of ALL as an early signal for worsening credit and at the time of writing the common is as solid as possible in such a market downturn:
ALL vs SPY 1 Year chart (Seeking Alpha)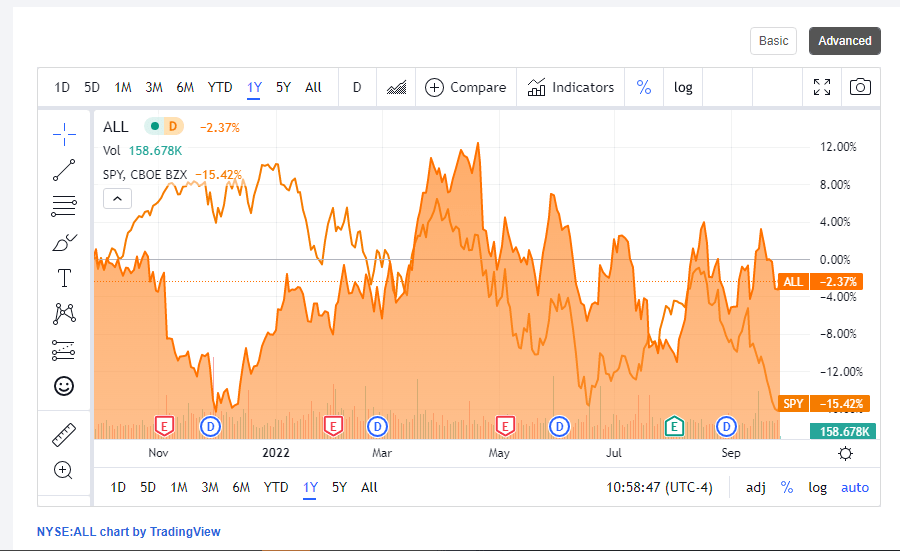
Conclusion
The fixed income sell-off brings some opportunities in the floating-rate space. Based on the logic presented above we believe that ALL-B has the potential to weather the storm and produce abnormal returns somewhere between 7.3% and 16% annualized while acting as a protection against rising yields.
Be the first to comment