

Chip Somodevilla
Thesis
Intel’s (NASDAQ:INTC) stock price has been brutalized in recent quarters. It has lost more than 50% of its price YTD due to both revenue decline and margin compression at the same time. However, its Q3 earnings report (“ER”) signals that the stock may have bottomed both in terms of prices and fundamentals. To wit, its gross profit margin (“GPM”) contracted to 45.9% during Q3. And as to be elaborated on later, this is the lowest level in a decade. Its EPS came in at $0.59, down by a whopping 59% YoY.
Looking ahead, the firm expects $63B~$64B of total revenues for the full year 2022 and a GPM of 47.5%. The GPM will admittedly still represent a 10.6 ppt contraction YoY. But will be a 160-basis points expansion from its Q3 GPM of 45.9%, representing a reversal of the trend.
Next, we will see that there are strong technical signals of a bottom after Q3 ER and also other metrics indicating reversals in business fundamentals.
Source: INTC Q3 ER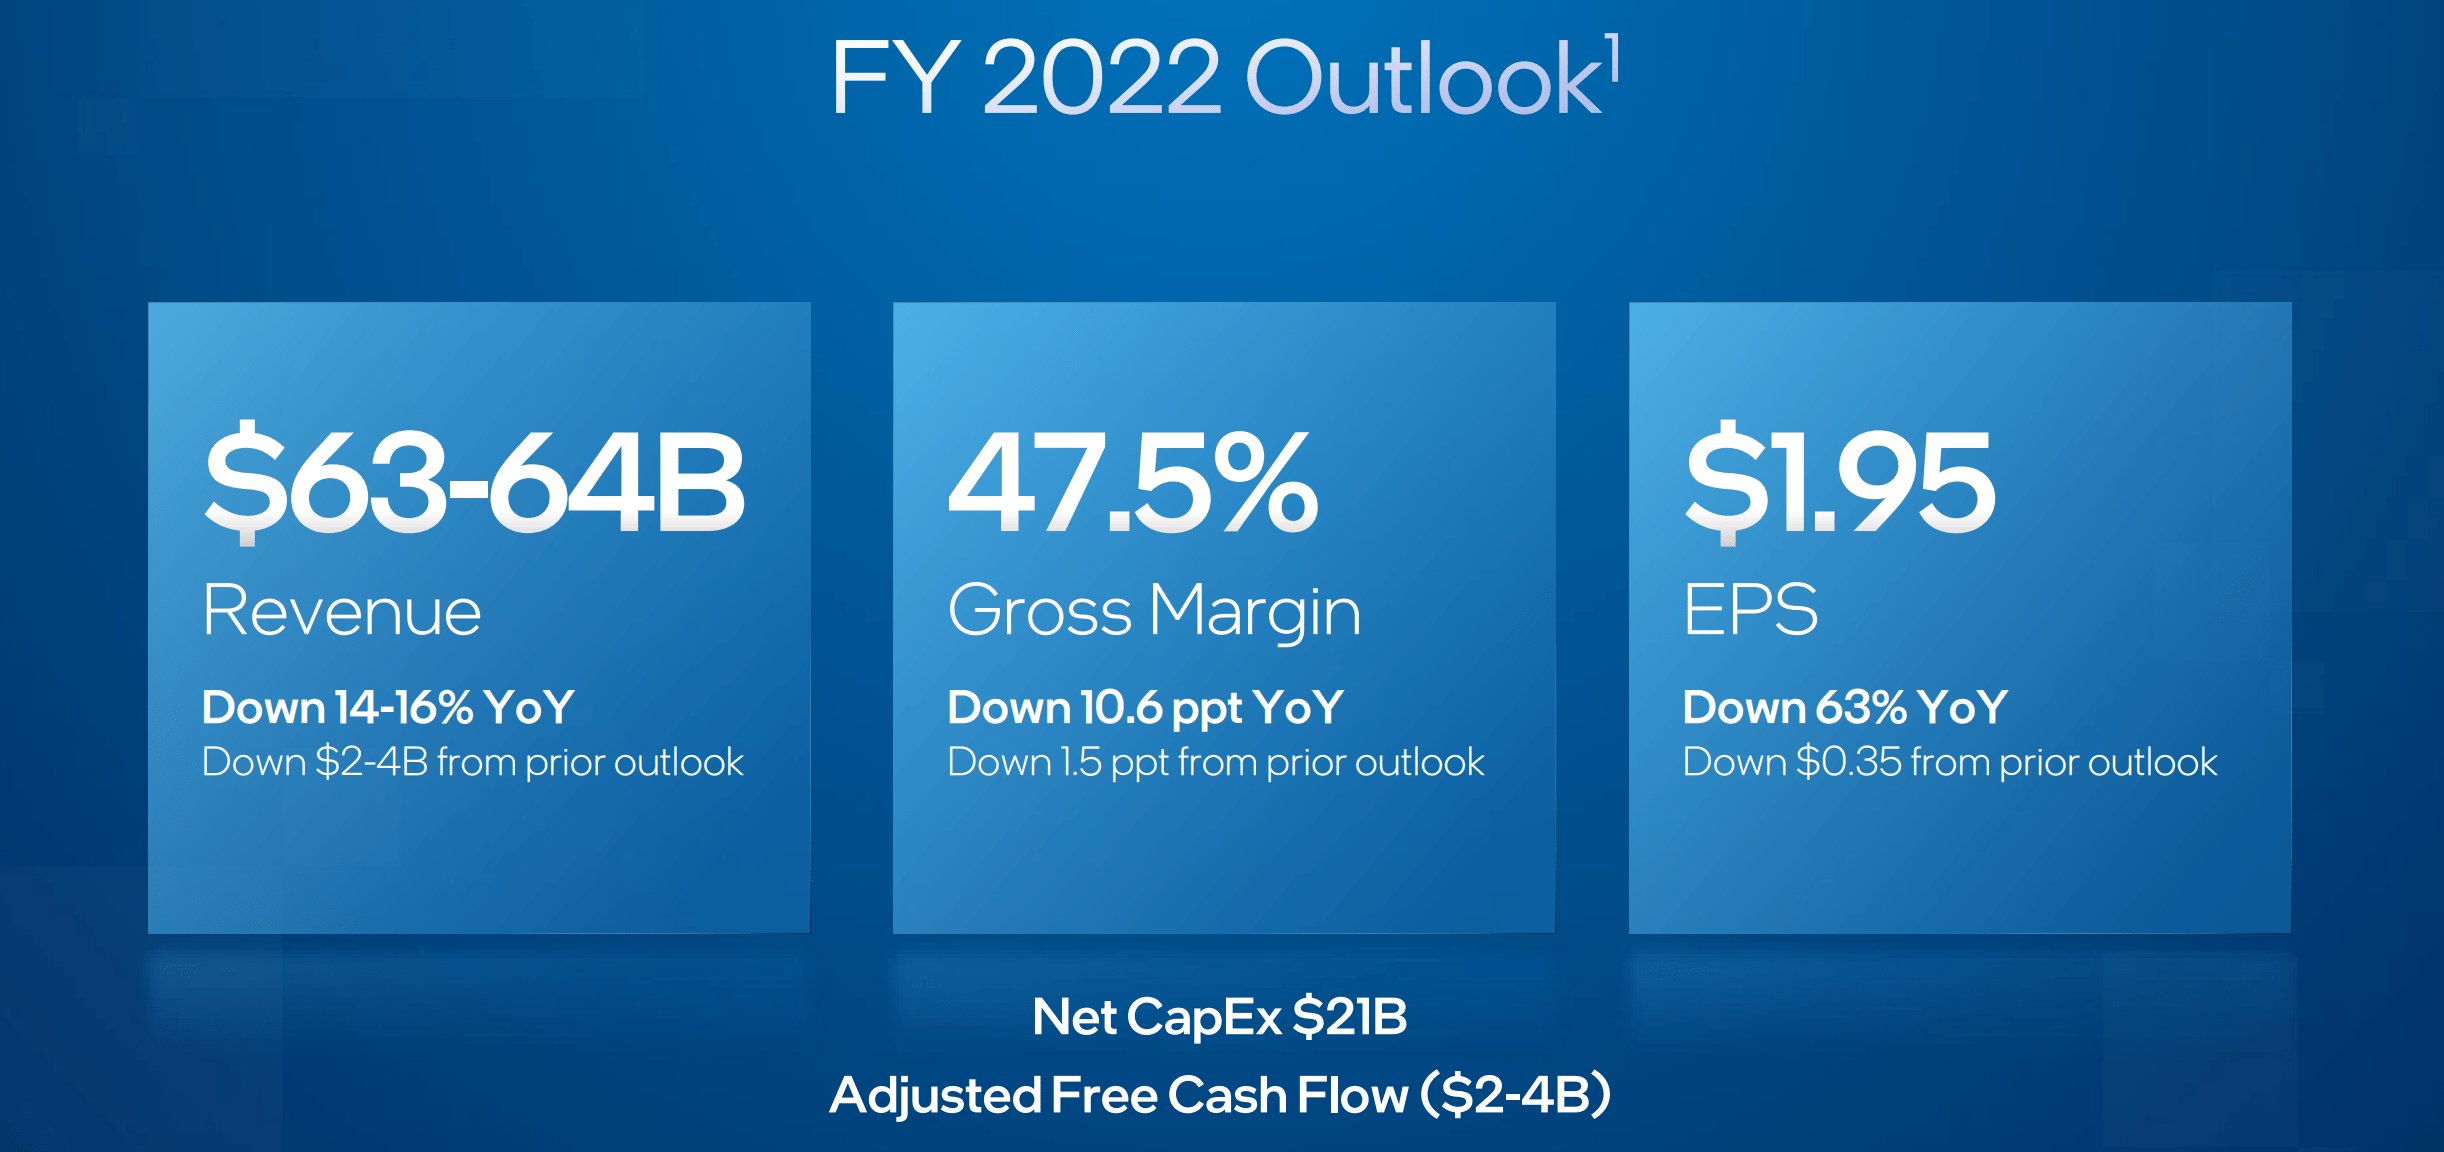
Strong technical signs
As aforementioned, the sentiment for INTC has been extremely negative in the past few quarters as you can see from the following chart. Although recently, there are strong technical signs indicating that the stock prices have bottomed. For example, on Oct 13, the stock price rallied from an open price of $24.7 to a close of $26.4 (by about 7%) in a single day on large volumes. And more notable, on Oct 28, the stock price rallied by more than 10.6% to a close of $29.0 on an even larger trading volume of 91.6 million shares. To put things under perspective, its average trading volume is about 42 million shares only over a 30-day period.
Source: Yahoo! data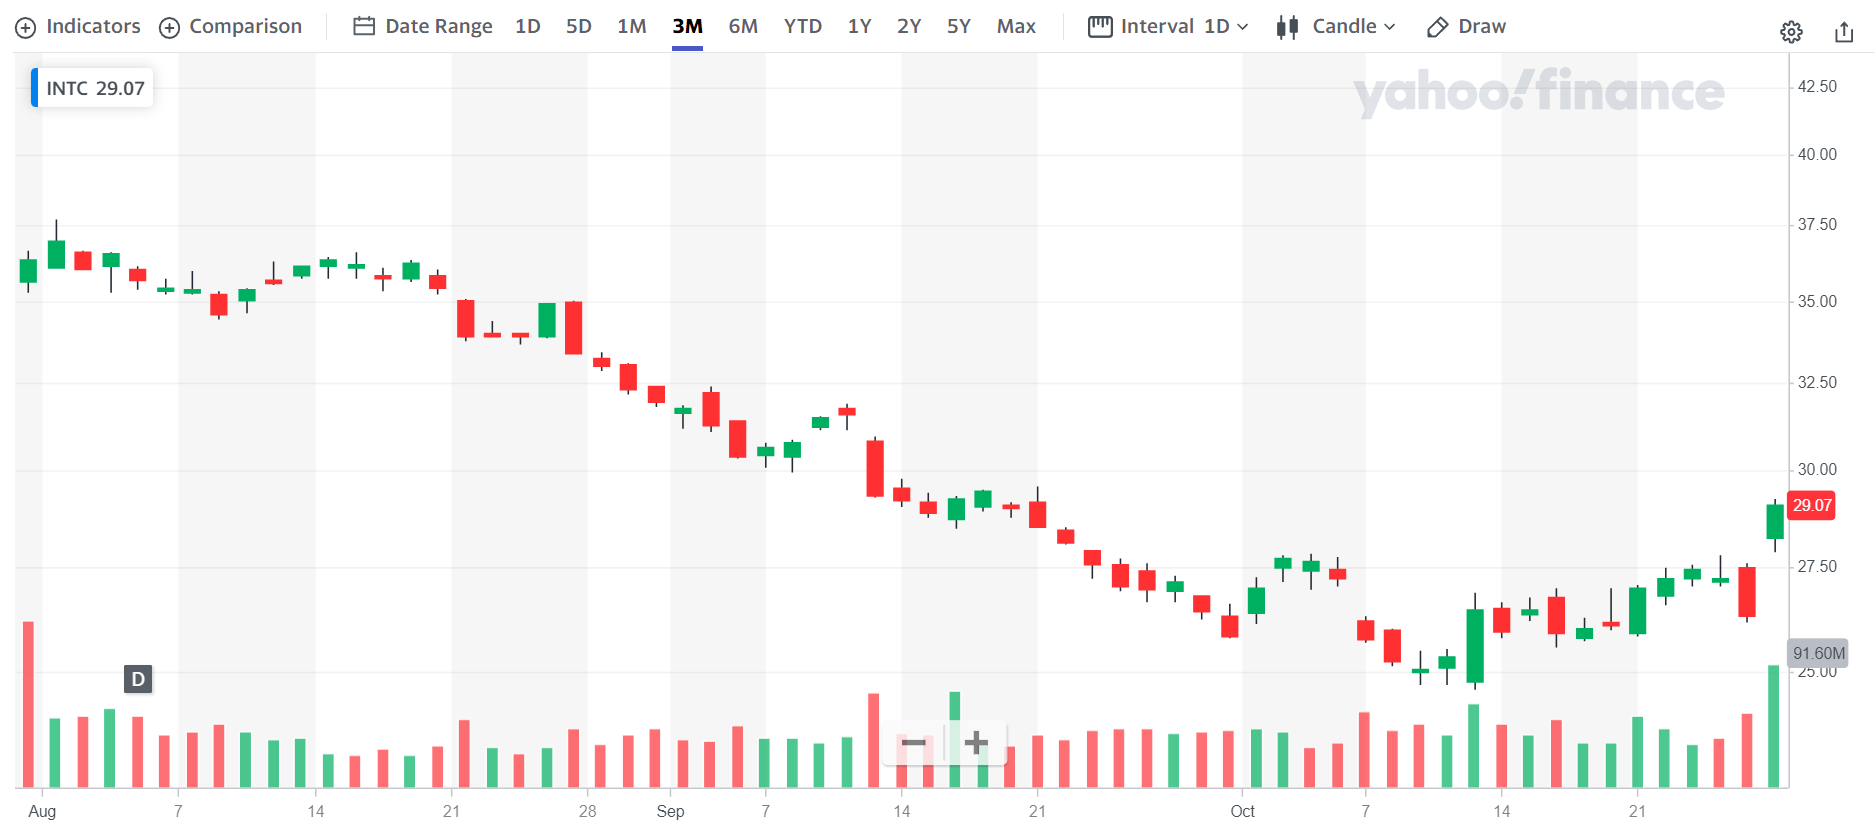
Margins
As aforementioned, INTC suffered a 12.4% gross margin contraction during Q3 compared to a year ago. With such a devastating contraction, its GPM was only 45.9% during Q3. The top panel of the following chart puts things under perspective and shows how large such a contraction is. As seen, its gross margin has been quite stable over the years until 2020. Before that, its GPM only fluctuated in a narrow range between about 55% and 65% with an average of 59.1%. And you can see the sharp contraction since 2020. Its current GPM is near the bottom level in about 10 years.
Source: Seeking Alpha data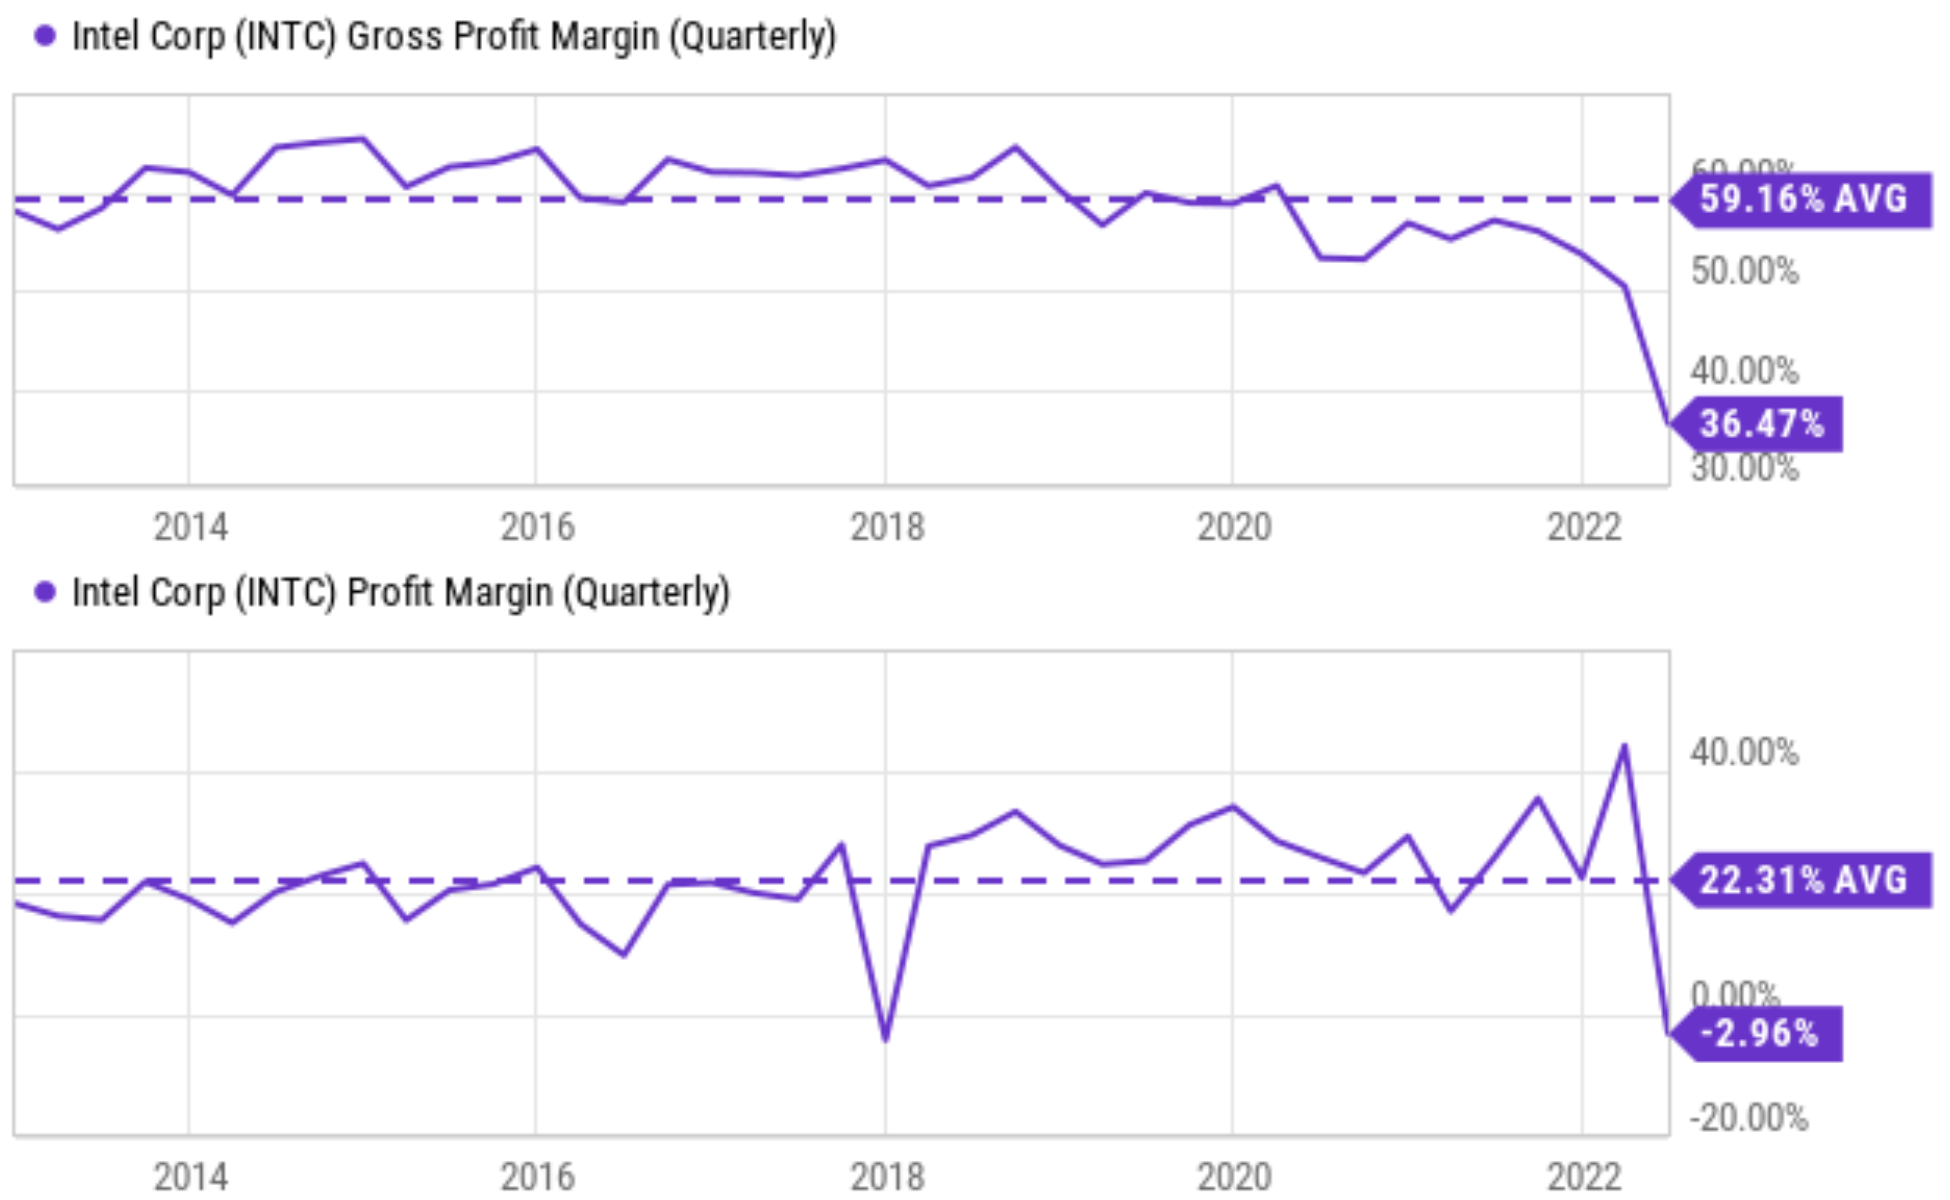
The picture for the net profit margin is even uglier as you can see from the bottom panel of the chart. Again, its net profit margin has been remarkably consistent and healthy over the decade years until the last quarter. Before that, its profit margin hovered around an average of 22.3% in a narrow range. To put things under perspective, the net profit margin of the overall economy is only about 10%, less than half of INTC’s average margin. Then you can see the sharp contraction in the last 2 quarters when its profit margin nosedived into the negatives (-2.96%), again at the bottom level in a decade.
Looking forward, management decided on several key actions to reduce both COGS and OpEx costs and improve both the GPM and net profit margins. To wit, INTC has identified structural cost reductions and efficiency drivers that could drive $3B savings in 2023, and $8-10B annually by end of 2025. In the near term, for the full-year 2023, it expects an EPS of $1.95. Assuming a share count of 4.1 billion shares, this translates into a total net profit of $8.0B. Further assuming it reaches its guidance revenues of $63B to $64B, such an earning would translate into a profit margin of around 12.6%. It is still a far cry from its historical average of 22.3%. But again, a profit margin of 12.6% would be better than the overall economy and represents a reversal of the trend for INTC.
Source: INTC Q3 ER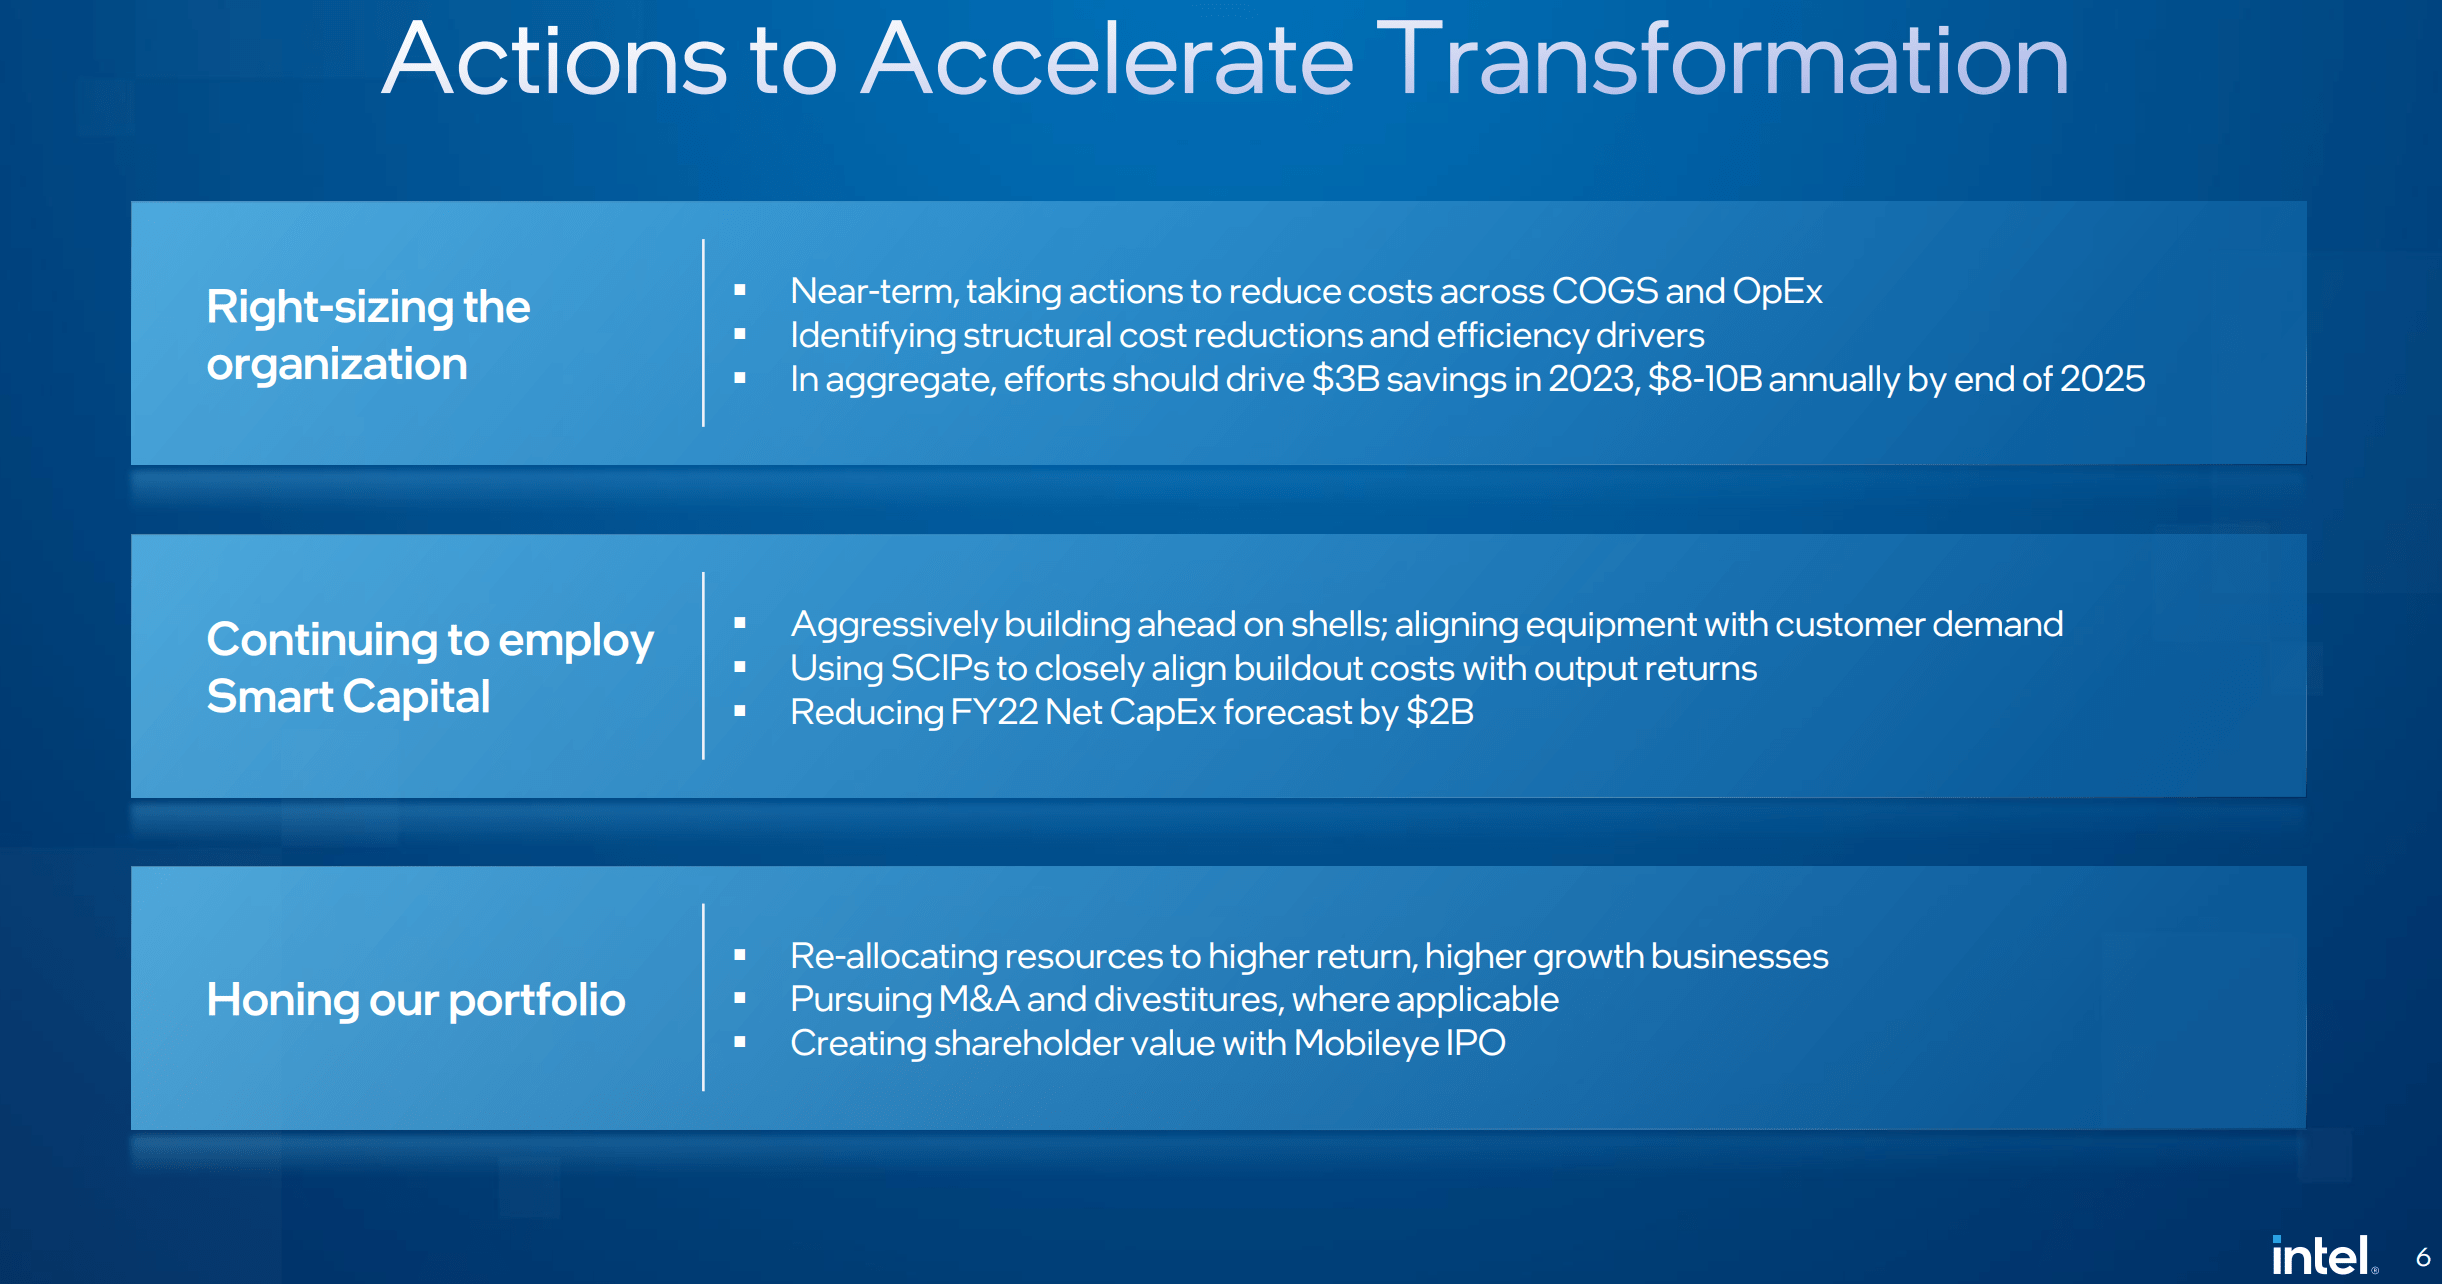
Capital allocation plans
Although its capital allocation remains under constraint. It expects Net CapEx of $21B for full year 2022 and an Adjusted Free Cash Flow in the $2 to $4B range. Even though the company still expects positive free cash flow (which is good news after its heavy capital spending), share repurchases and dividend policies could change.
Historically, the business has been systematically and quite generously returning capital to shareholders via share repurchases and dividends as you can see from the following charts. To wit, INTC has been paying a dividend yield that averaged 2.9% in the past decade, not the highest-yielding stock but quite generous. Furthermore, it has been buying back its own shares consistently over the years as you can see from the bottom panel. And its net common buyback yield has been on average 3.61% in the past decade. So, when the dividend yield and buyback yields are combined, the stock has been yielding a total of more than 6.5% in the past decade, quite impressive.
Looking forward, it is unlikely that the company will have the free cash to sustain such dividends and/or buybacks. As aforementioned, it expects full-year 2022 Adjusted Free Cash Flow in the range of $2 to $4B. Its TTM dividend obligation is already about $5.6B.
Source: Seeking Alpha data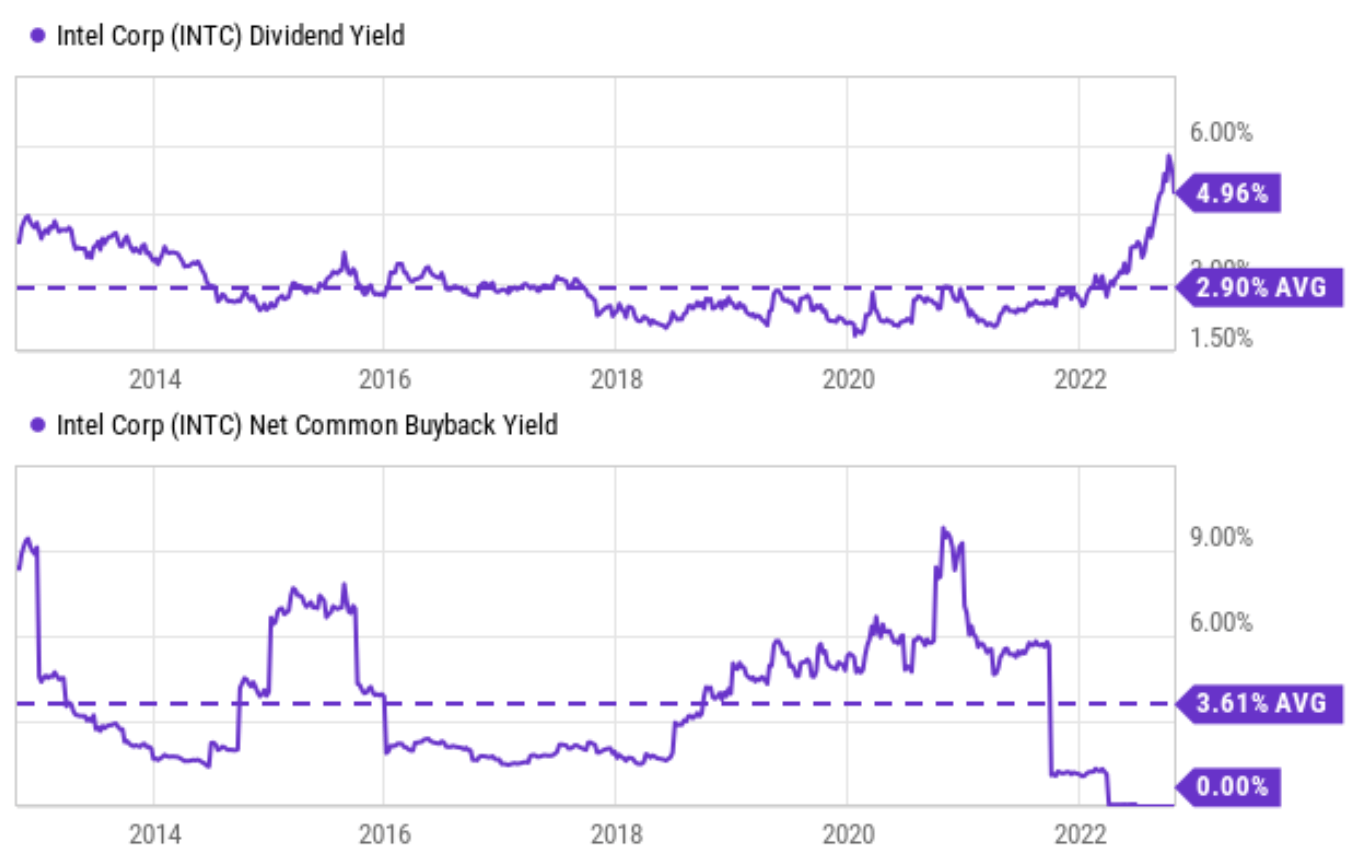
Final thoughts and risks
Its turnaround plan still faces many uncertainties. Macroscopic risks are certainly a concern in the near future, such as an overall economic recession and also the trade tension between the U.S. and China in the chip space. The sources of the fund for its large CPAEX spending also remain uncertain. The capital plan involves so many moving parts such as the specific allocation of the CHIPs Act, EU incentives, and also the timing of the spending et al. As its CEO Patrick Gelsinger commented during the ER (abridged and slightly edited by me):
… the net CapEx depends on how we access other pools of capital to be able to build that out in a very financially prudent way and those other approaches, EU, U.S. Chips Act, ITC skip give us a lot of flexibility, combined with the shell first strategy to be able to make sure we’re spending the capital, the more expensive equipment capital, more timed with the market demand clarity.
All told, after a few brutal quarters, INTC seems to have found a bottom in Q3 both in terms of stock prices and business fundamentals. Compressions in both gross and net profit margins seem to have reached an end and should recover from here on. Full-year GPM is expected to be 47.5% and net profit margin 12.5%, both far cry from its historical averages but an improvement/reversal from the Q3 results. The company has identified aggressive actions to reduce costs including job cuts. These actions are expected to further recover the margins and the market. These actions also seem to be approved by the market given the strong stock price rallies after the ER, which also provide strong technical indicators of a price bottom when combined with the large trading volume.
Be the first to comment