

PeopleImages/E+ via Getty Images
Investment Thesis
The Fall Of The Semiconductor Stocks
Ycharts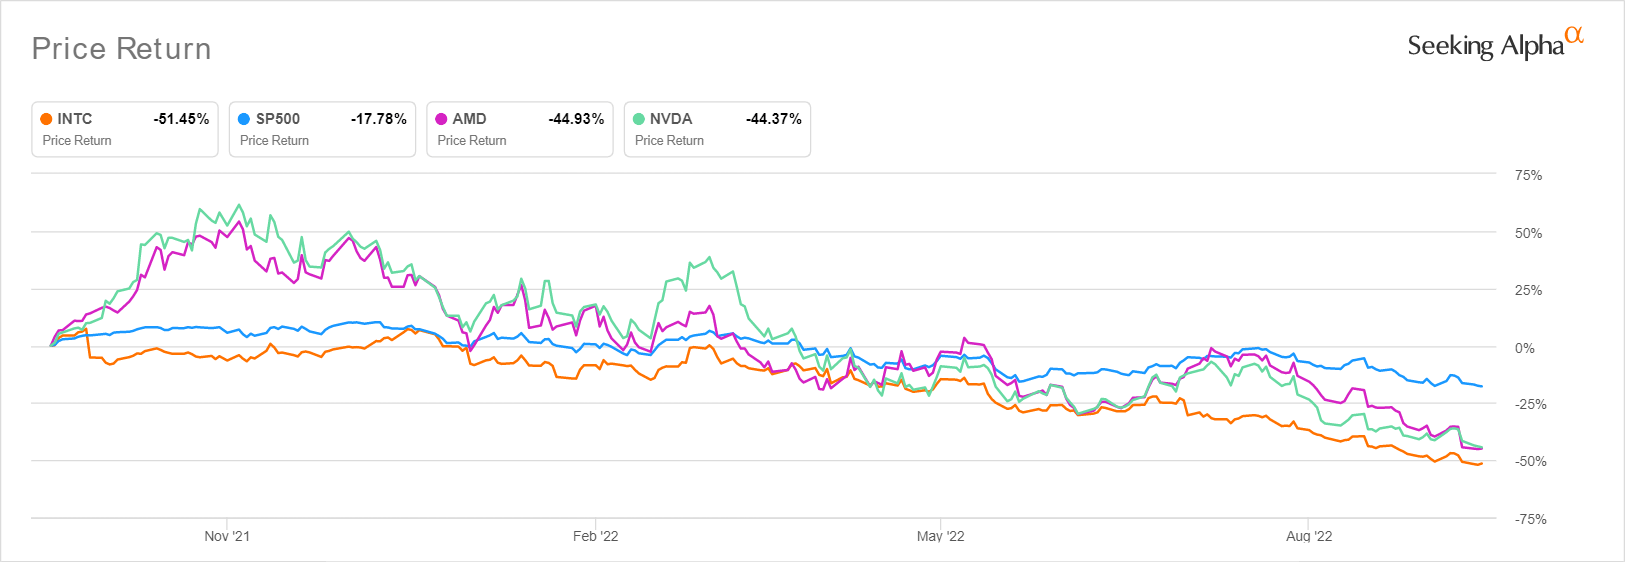
It is apparent by now that Intel Corporation (NASDAQ:INTC) was not able to catch any break, given the catastrophic plunge the stock has experienced in the past year. INTC has tragically declined by -51.45% in the last twelve months (LTM) attributed to the drastic market correction and PC weaknesses, compared to Advanced Micro Devices (AMD) at -44.93% and Nvidia (NVDA) at -44.37% at the same time. The S&P 500 Index has also plummeted below previous June lows to reach $3,577.03, indicating a massive fall of -18.03% in the LTM, or -25.43% YTD.
INTC’s stock recovery was further delayed by the robust US labor market in September, with payrolls growing by 263K and the unemployment rate declining by 3.5%. The September PPI Index also demonstrated sticky inflation rates, as the core PPI grew 0.3% sequentially and 7.2% YoY. In other words, we do not need a crystal ball to predict persistently elevated September CPI rates, which we will find out on 13 October 2022. Naturally, triggering Mr. Market’s worsening fears of the Fed’s raised terminal rate in 2023 to potentially 5% ( or more ), against the previous projection of 4.6%. Thereby, triggering more pain for the stock market in general, with 81.3% of analysts projecting another 75 basis point hike for the Fed’s November and, potentially, January meeting.
INTC Continues To Suffer From The Destruction Of Demand
S&P Capital IQ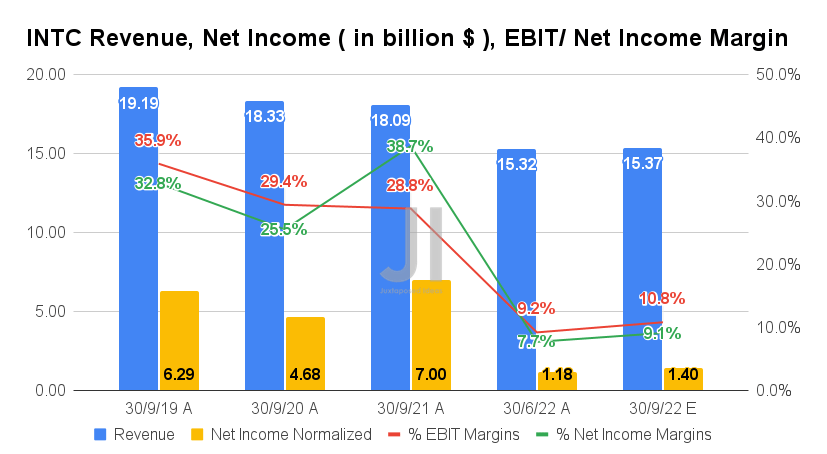
For its upcoming FQ3’22 earnings call, INTC is expected to report revenues of $15.37B and EBIT margins of 10.8%, indicating in line though a notable increase of 1.6 percentage points QoQ, respectively. Otherwise, a tragic YoY plunge of -15.03% and -18 percentage points, respectively, attributed to the destruction of demand in the PC segment similarly reported by AMD thus far in its preliminary FQ3’22 announcement. The latter had reported a -16.41% decline in FQ3’22 revenues against previous guidance, with a -53% QoQ fall in its client/PC segment.
In the meantime, INTC’s profitability remains underwhelming, with net incomes of $1.4B and net income margins of 9.1% for the next quarter. It will represent a modest QoQ growth of 18.64% and 1.4 percentage points, respectively. Otherwise, an eye-popping decline of -80% and -29.6 percentage points YoY, respectively. Thereby, explaining the stock’s continuous decline thus far, significantly worsened by the China restriction.
S&P Capital IQ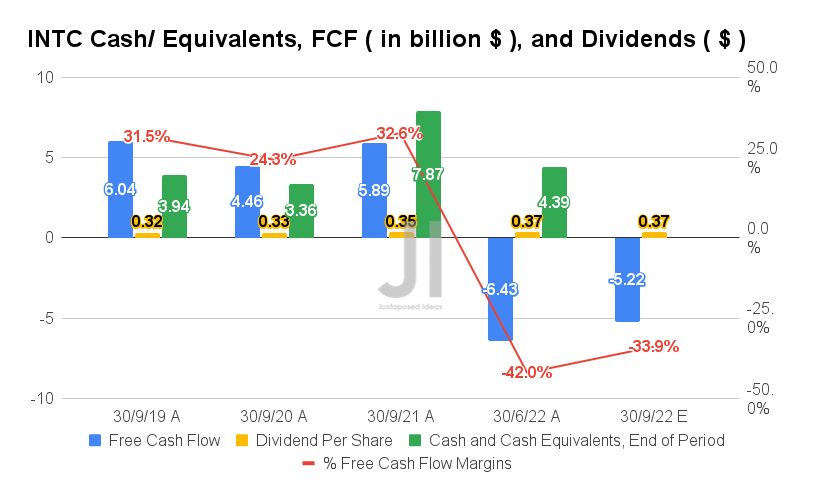
In the meantime, INTC’s Free Cash Flow (FCF) generation remains negative, due to its aggressive Foundry investments of $24.11B in capital expenditure over the LTM, indicating a massive increase of 50.59% sequentially. For FQ3’22, the company is expected to report FCF generation of -$5.22B and an FCF margin of -33.9%, indicating notable improvements QoQ by 18.81% and 8.1 percentage points, respectively. Otherwise, a massive YoY plunge from FQ2’21 levels of $5.89B and 32.6%, respectively. Naturally, this is assuming that INTC pulls through with its previous cost cuts promised in its FQ2’22 earnings call.
S&P Capital IQ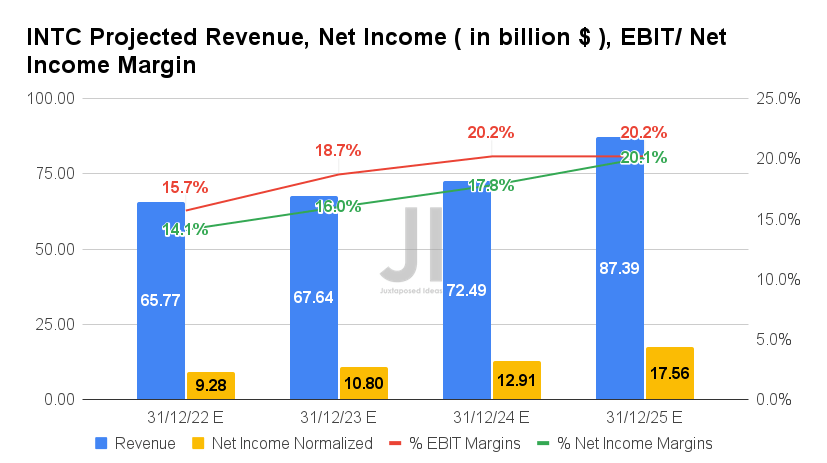
Over the next four years, INTC is expected to report revenue and net income growth at a CAGR of 2.55% and -3.03%, respectively. It is apparent by now that Mr. Market is extremely bearish on its forward execution, attributed to the continuous downgrade in its top and bottom-lines growth by -13.38% and -21.08%, respectively, from our analysis in May 2022. The demotion in its profitability is tragic as well, from EBIT/ net income margins of 31.2%/29.2% in FY2019, 27.9%/25.1% in FY2021, and finally to 20.2%/20.1% by FY2025.
In the meantime, INTC is expected to report revenues of $65.77B and net incomes of $9.28B in FY2022, representing a disastrous decline of -16.76% and -53.27% YoY, respectively, with things unlikely to recover in the next two years. No wonder its stock valuations have also bottomed.
S&P Capital IQ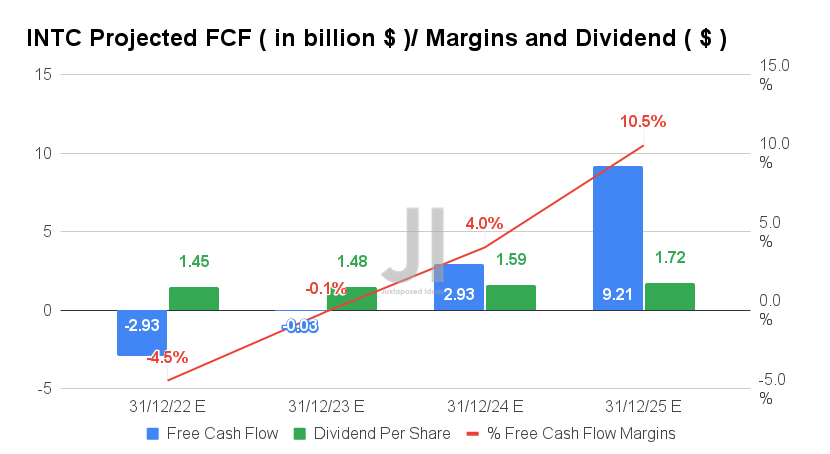
INTC’s ambitious foundry strategy is not helping matters as well, given the worsening macroeconomics, geopolitical climate, and rising interest rates. The company is not expected to report meaningful improvement in its FCF generation by FY2025, in comparison to pre-pandemic levels of $16.93B in FY2019. Its dividend payout will also experience slower growth as a result, at a CAGR of 5.86% compared to 6.04% between FY2016 and FY2019. We shall see if INTC continues its $0.365 quarterly dividend payouts moving forward, as the analysts continue to rate its dividend safety at an excellent B-.
Nonetheless, as INTC’s stock prices continue to decline, we are also seeing a very attractive dividend yield of 5.76% emerging at the moment. This number represents the stock’s highest dividend yield in the past ten years, benefiting bottom-fishing investors that load up at current levels. Nonetheless, this group of people should also prepare their iron hearts, owing to the massive volatility and downside from current levels.
In the meantime, we encourage you to read our previous article on INTC, which would help you better understand its position and market opportunities.
- Intel: Ugly Balance Sheet, Stock May Continue At Near-Bottom Levels
- Intel: Still The King Of The Jungle – But Is It A Value Trap?
So, Is INTC Stock A Buy, Sell, Or Hold?
INTC 10Y EV/Revenue and P/E Valuations
S&P Capital IQ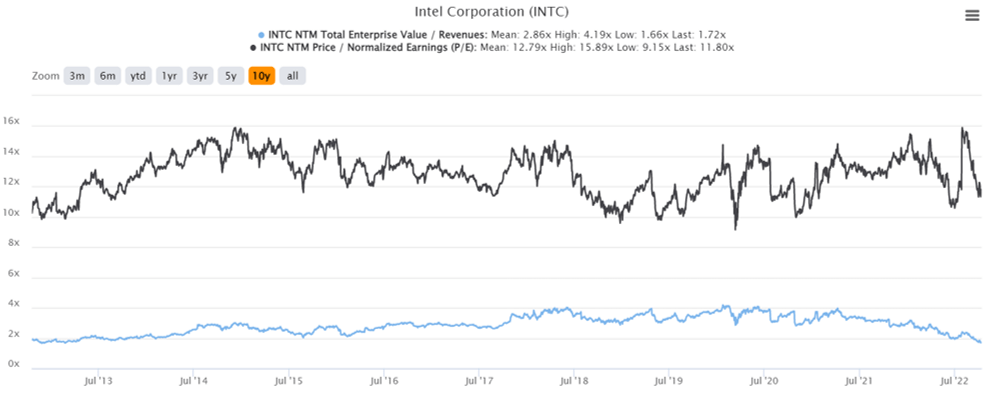
INTC is currently trading at an EV/NTM Revenue of 1.72x and NTM P/E of 11.80x, lower than its 10Y mean of 2.86x and 12.79x, respectively. The stock is also trading at $25.33, down -54.99% from its 52 weeks high of $56.28, nearing its 52 weeks low and 2014 levels of $24.66. Nonetheless, consensus estimates remain bullish about INTC’s prospects, with their price target of $36.09 and a 42.48% upside from current prices.
INTC 10Y Stock Price
Seeking Alpha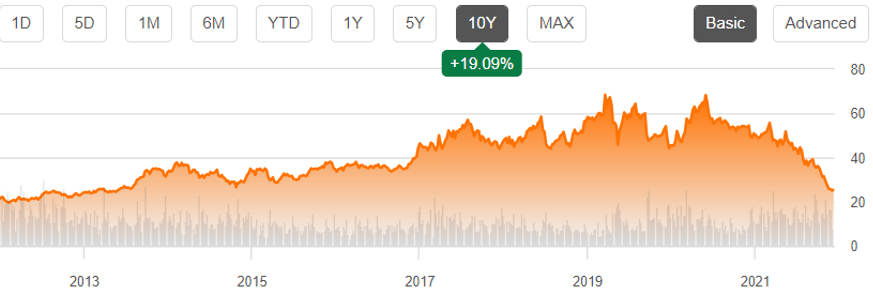
Due to the factors discussed above, we reiterate our Hold rating on the INTC stock. However, dividend hunters may possibly nibble at current levels, and load up the boat once the stock breaches $10 for stellar dividend yields of 14.6% or higher. Good luck, all.
Be the first to comment