

Chip Somodevilla
Thesis
By Buffett’s $1 test, a CEO should be able to grow a company’s market capitalization (“MC”) by at least $1 for every dollar of earnings retained. It sounds like an easy test to pass. After all, by simply hoarding cash on your balance sheet, your company’s net worth should go up in proportion. However, surprisingly, many companies (or their CEOs) do not pass this simple test. Plenty of them actually fails miserably for various reasons, some of their own making and some out of their control.
And Intel (NASDAQ:INTC), or its current CEO Pat Gelsinger, is, unfortunately, one such example. As you can see from the following chart, INTC has been creating an average of $1.27 of MC per $1 of earnings retained between 2012 and 2020. Then came Gelsinger in 2021, and the scorecard nosedived. INTC’s current market cap is back to where it was in 2012 (about $100B). In the meantime, it cumulatively retained a total of $110B of earnings during that period. All told, Gelsinger’s current score on the $1 test is a NEGATIVE $1.55.
Source: author and Seeking Alpha data. Source: author and Seeking Alpha data.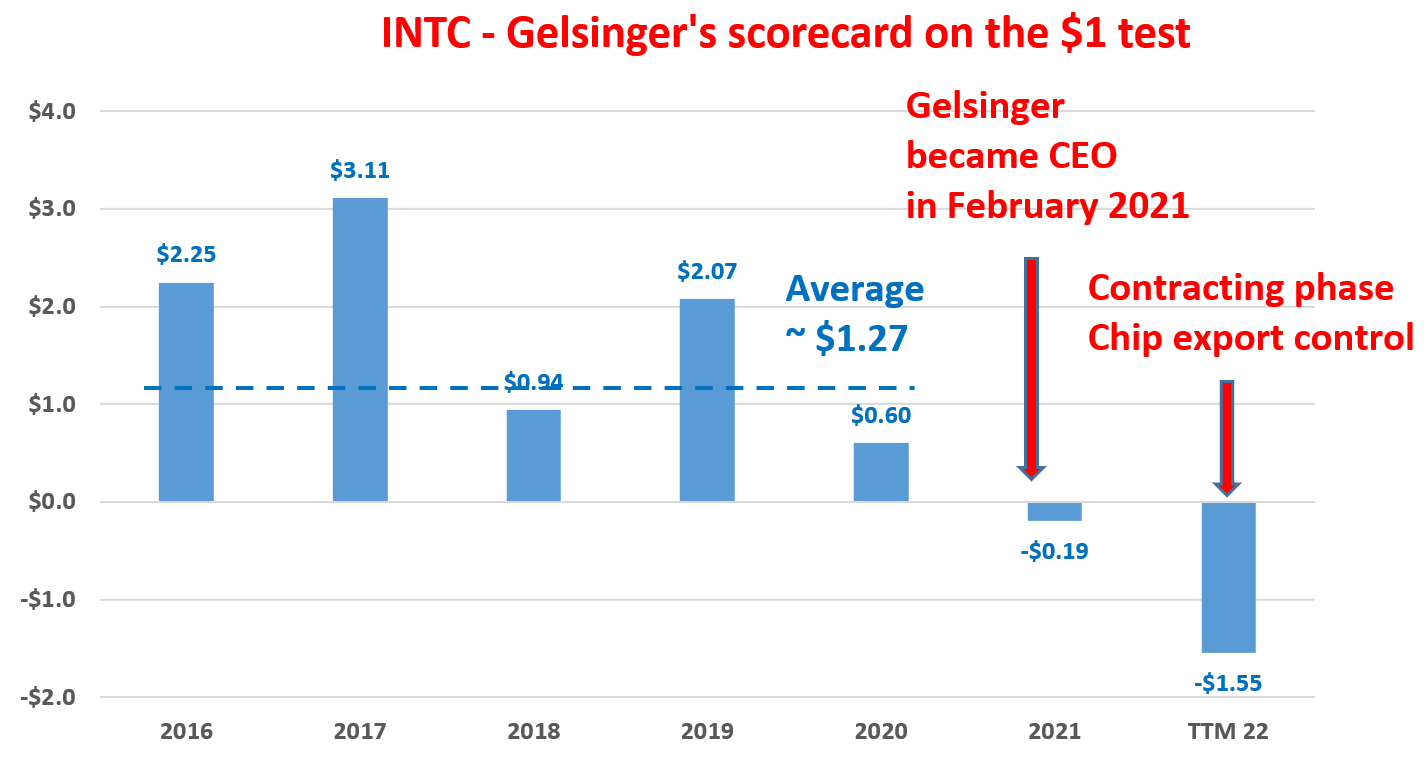
And the goal of this article is to analyze the root cause of the deterioration of the scorecard, based on which we can form an outlook for its future prospects. The main thesis is twofold.
- First, I will argue that the main issues that Gelsinger now faces are not his making, although it is his job to solve these issues. Among the multitude of issues he is facing, I see the main ones include the technological lag of its core CPU products, supply-chain challenges, inflationary pressures, and also the recent U.S. restriction on chip products export. The remainder of this article will comment on the impact of these issues on Gelsinger’s scorecard and INTC’s financial performance going forward.
- Secondly and more importantly, I will argue that Gelsinger is making the right calls to address these issues, although it will take time for his solutions to show effect. A few notable examples include his determination to rebuild INTC’s fab business, the Smart Capital Arrangement with Brookfield to fund its fab initiatives, and also the recent decision to reduce its marketing/sales headcount by 20% to control cost and improve efficiency. Finally, the recently-passed CHIPS act will provide a long-term secular tailwind to support Gelsinger’s main initiatives.
All told, I see a divergence between the scorecard that the market is assigning to Gelsinger and the scorecard that he should have been receiving. Such a divergence signals large mispricing in my view.
Gelsinger’s scorecard from the Market
Let’s first see the market’s scorecard for Gelsinger using Buffett’s $1 test. The $1 test is explained by Buffett himself (e.g., in his 1984 shareholder letter below, and the highlighted was added by me):
“Unrestricted earnings should be retained only when there is a reasonable prospect – backed preferably by historical evidence or, when appropriate, by a thoughtful analysis of the future – that for every dollar retained by the corporation, at least one dollar of market value will be created for owners. This will happen only if the capital retained produces incremental earnings equal to, or above, those generally available to investors.”
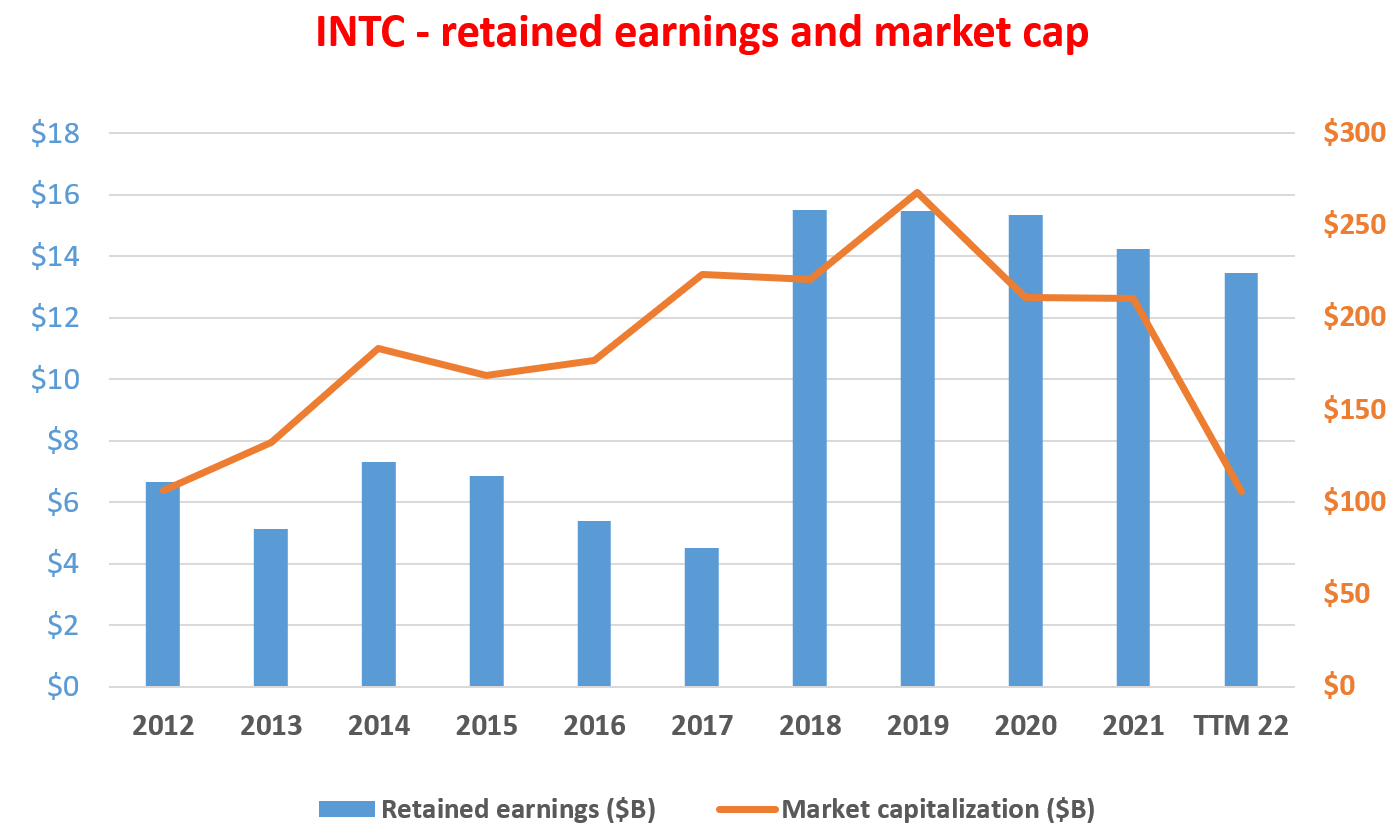
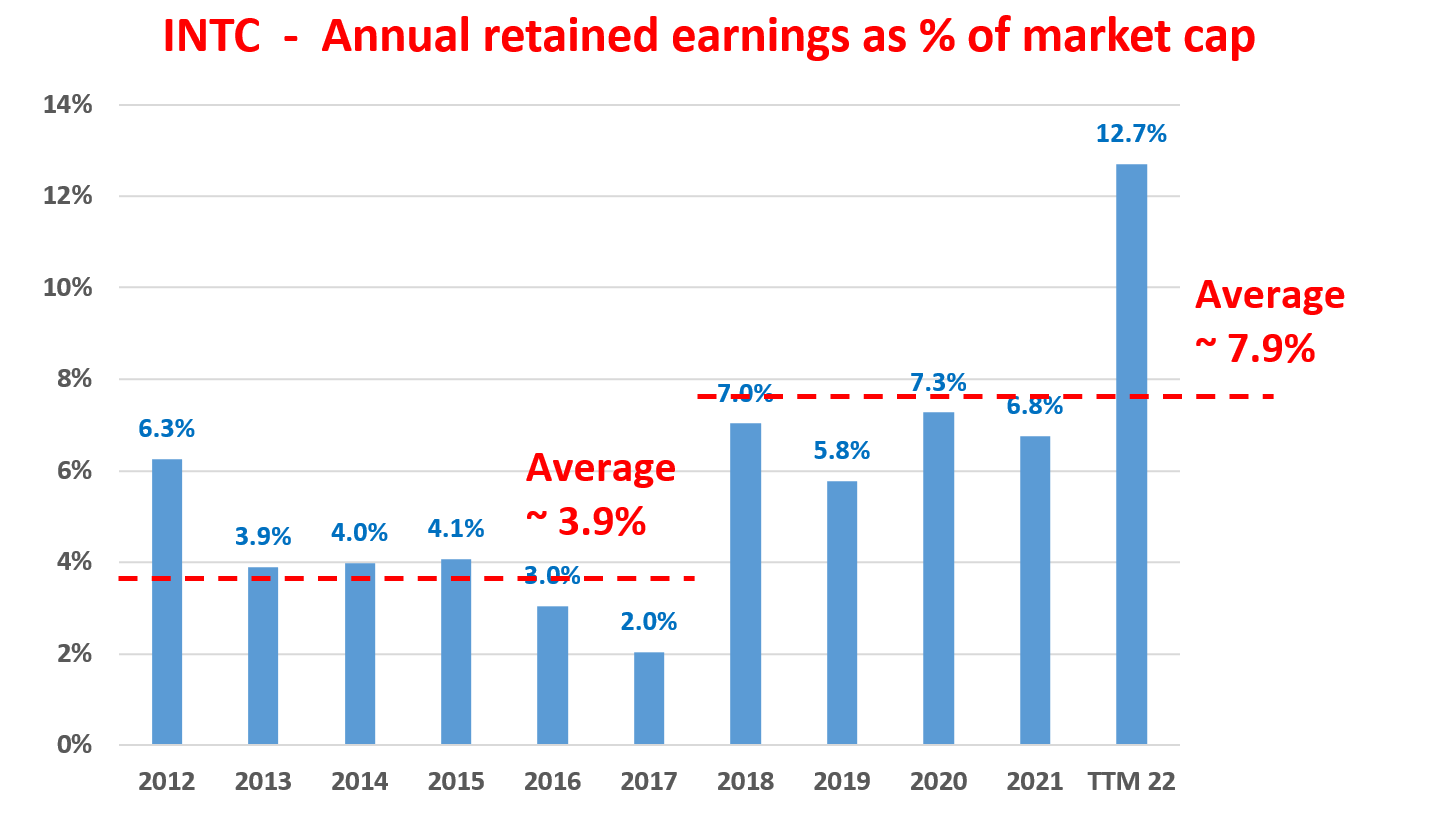
The following table and chart show the scorecard for INTC and Gelsinger. As you can see from the first row in the table, INTC has been consistently retaining a sizable amount of earnings over the years to fuel its growth and grow its book value. It has been retaining on average $5.98B per year from 2012 to 2017. Then it bumped up the retained earnings by more than 200% to an average of $14.8B per year since 2018. To put things under perspective, these amounts are about 3.9% and 7.9% of its average market cap during those periods (see the second chart below), respectively. So, INTC’s market cap should on average go up by about 3.9% to 7.9% a year during the past 10 years. But it did not. Instead, it actually lost about $0.4B of MC at its current price levels compared to the average market cap during 2012. At the same time, it has cumulatively retained a total of $109.9B of earnings during the past 10 years.
As a result, INTC’s scorecard on the $1 test turned from a healthy (actually superb) $1.27 for the 2012~2020 period to zero for the 2012~present period. And when the period of 2020~2021 is considered, the period since Geisinger took over, the scorecard is even uglier and it is in the negatives.
Next, we will discuss the causes of the deterioration of the scorecard to form an outlook for its future direction.
Source: author and Seeking Alpha data. Source: author and Seeking Alpha data.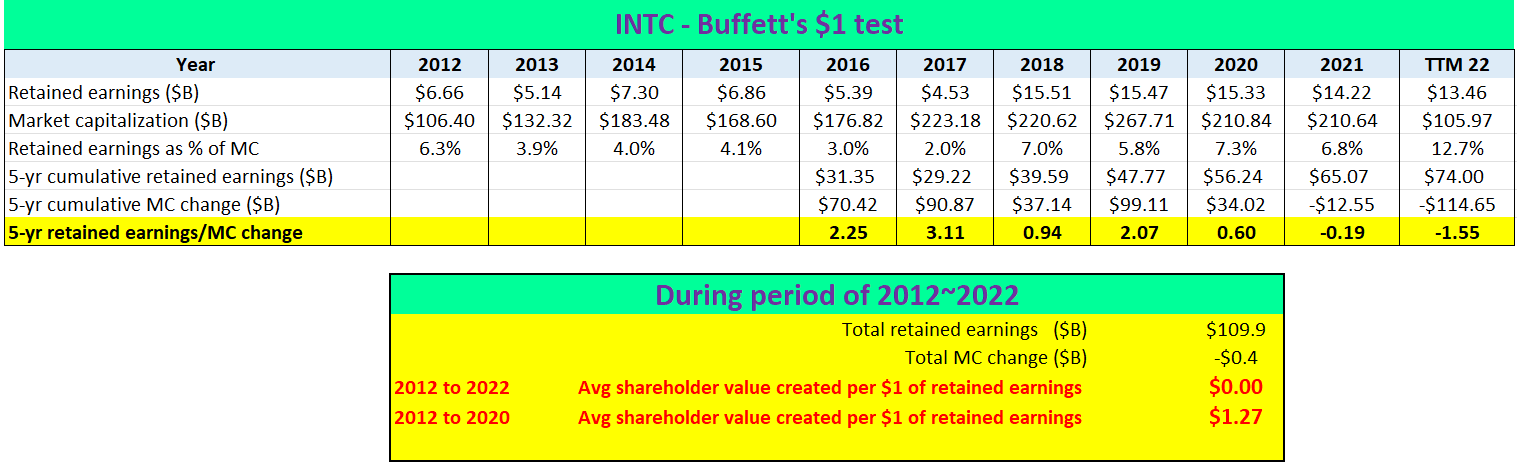
My scorecard for Gelsinger
As mentioned above, I view the 4 key issues that Gelsinger is facing to be the supply-chain challenges, inflationary pressures, technological lag of its core products, and also the recent U.S. restriction on chip products export. Each issue probably deserves its own standalone article. And to limit this article to being within reasonable length, I will leave out the first two issues here. I will focus on the third issue and make some brief comments about the fourth issue.
Let’s examine the technological lag of its products in more detail. There are certainly company-specific issues concerning its core products ranging from Client Computing, Data Centers, and also the AI Group. However, in my view, Gelsinger is doing all the right things on this front to catch up: aggressively recruiting top talent, maintaining a sharp focus on R&D, and investing in the fab future. Two particular examples are in point here. First, Gelsinger recently announced plans to reduce its marketing/sales headcount by 20%. Note the key here is that downsize will be concentrating on marketing and sales, not engineering or R&D. Second, the following chart shows a variation of the $1 test, applied on its R&D yield this time instead of its market cap. So it is more a fundamental test than a market popularity test. As detailed in my other articles:
This variation of the $1 test quantifies how many dollars of profit has been generated per dollar of R&D expenses. In this test, I used the operating cash flow as the measure for profit. Also, most R&D investments do not produce any result in the same year. They typically have a lifetime of a few years. Therefore, this analysis assumes a 3-year average investment cycle for R&D. And as a result, we use the 3-year moving average of operating cash flow to represent this 3-year cycle.
As you can see, this $1 test showed a different picture of Gelsinger’s leadership and execution. Since he took over the CEO position in 2021, INTC’s R&D yield has been on average $1.95 for every $1 spent on R&D. It not only passes the test with flying colors but is also substantially above INTC’s past record and its peers. To wit, INTC’s average R&D yield has been averaging around $1.55 between 2014 and 2018. And other chip makers, such as QCOM and NVDA, have been maintaining R&D yields in recent years around $1.2 to $1.3 on average.
Source: author and Seeking Alpha data.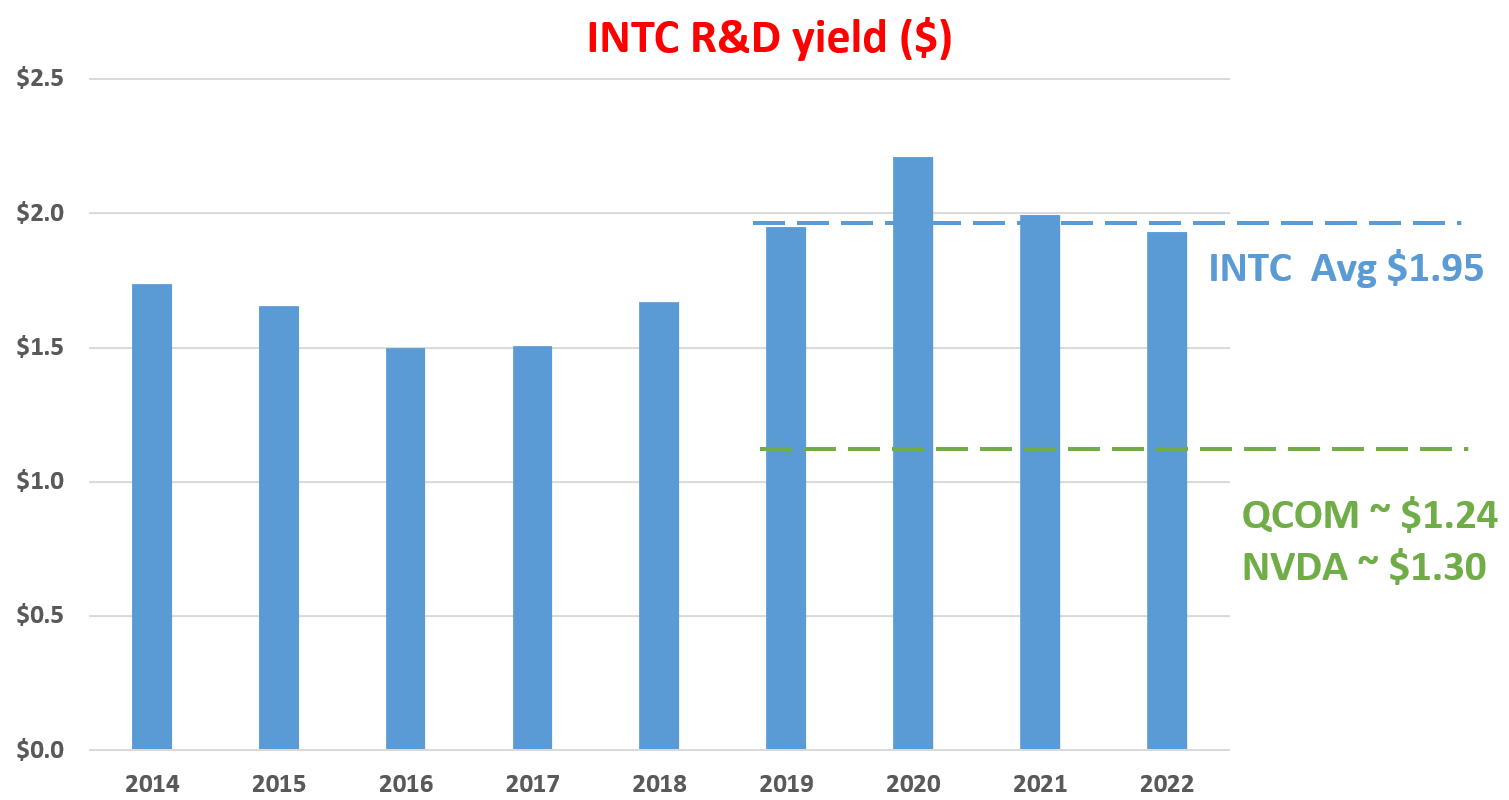
CHIPS act may be the silver lining
The next immediate issue is the U.S. restriction on the export of chip products to China, a major market for all the U.S. chip companies including INTC. Again, this is an issue large than any specific company, but it is Gelsinger’s responsibility nonetheless to deal with. And again, my view is that he has been making the right decisions. The fab initiative is a critical step in my mind. The US clearly wants an alternative to Asia-based foundries. And my view is that INTC is probably the ONLY player that could even conceivably get close to this national-level strategic goal. Furthermore, Gelsinger recently also announced plans to separate the decision-making process between its design and manufacturing teams, which is another good call in my mind for it to speed up the execution of its foundry initiative.
The impacts of the export control are still unfolding, but my overall feeling is that in the end, the support INTC receives from the CHIPS act will outweigh the headwinds created by the export control. Thanks to its fab initiative, INTC will be a major beneficiary from the CHIPS act, say compared to a pure design player like NVDA as shown in the table below. The act would help INTC in multiple ways. For example, the subsidies and tax credits can effectively and dramatically boost its reinvestment rates (from about 20% to 30% in my estimate). Given INTC’s ROCE (return on capital employed), such a boost can increase its growth rate by about 4% to 12% per annum. While in contrast, the impact on pure design players like NVDA will mostly be in the tax credits on its R&D expenses.
All told, I am projecting INTC to deliver an outsized return potential in the next 5 years given a such boost and its currently compressed valuation. My projected annual return is in the range of 20% consisting of more than 8% of owners earning yield and about 12% of growth as seen.
Source: author and Seeking Alpha data.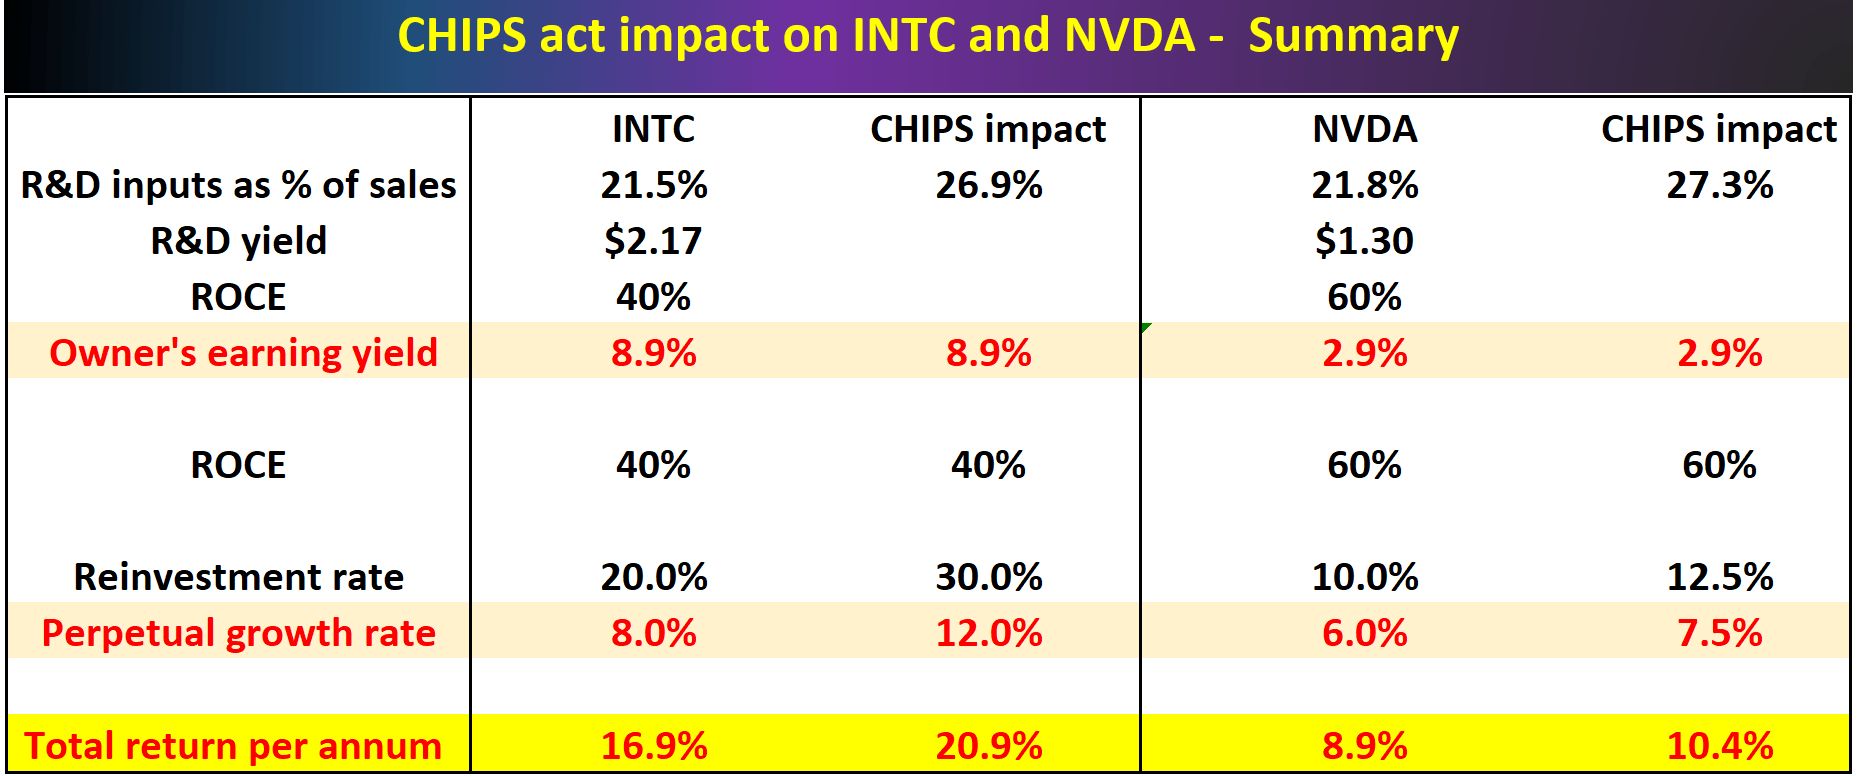
Summary of risks and final thoughts
To summarize, there is no lack of headwinds facing INTC in the near future. The major challenges include macroscopic issues like supply-chain congestion, inflationary pressures, and also the recent U.S. restriction on chip products export. On top of these macro risks, INTC’s own technological lag also creates another set of challenges. For example, its technological lag has largely kept it from breaking into the smartphone market, a key future market segment. At the same time, its PC and data center segments are under fierce competition from alternative solutions such as those provided by AMD and NVDA.
None of these are caused by Gelsinger even though his market scorecard is currently brutalized by these issues. In my view, he has been making all the right calls to address these issues by focusing on R&D, maintaining excellent R&D efficiency, pursuing the foundry initiative aggressively, and patterning with Brookfield Asset Management to ease the capital investment intensity in its Arizona manufacturing expansion. In other words, there is a large gap between the grade that the market is giving Gelsinger and the grade that he ought to receive. And such a large gap indicates significant mispricing of the stock and creates an asymmetrical opportunity in my mind.
Be the first to comment