

Viorel Poparcea
Investment summary
Here we demonstrate our long trade on Insulet Corporation (NASDAQ:PODD) seeking ~1,800bps over the coming 4-6 months. Here we illustrate a confluence of market, fundamental, technical and portfolio statistical factors that add bullish weight to the risk/reward calculus. We also demonstrate the near-term investment opportunity is more compelling, by estimate. Noteworthy is that PODD is set to present Q2 earnings as an earnings catalyst to promote post earnings announcement drift onto Q3 FY22.
The following series of charts are representative of our reasoning behind the position. Investors can visualize what’s caught our eye as justification for PODD into our global opportunities portfolio. On the culmination of these factors, we rate PODD a buy, 6-month price target of $284.
Exhibit 1. PODD 6-month price action
Crossed above EMA and SMA in late June; broke away in July after testing both MA’s once more
Data: Updata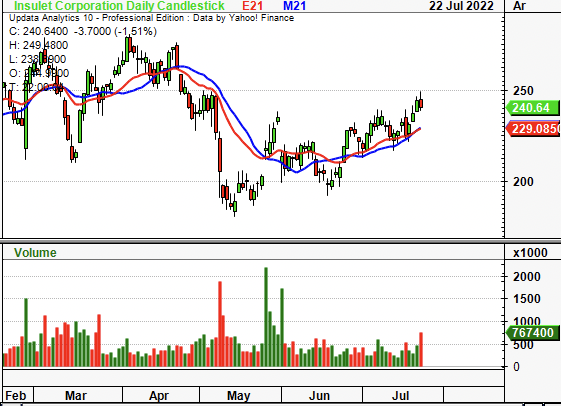
Market factors
The low-beta, growth/tech trade has been completely wound back in FY22 such that short growth still offers an effective equity hedge that remains in the money YTD. As such, low-beta, low-volatility plays have delivered payoffs as investors look to step up in quality and liquidity, whilst reducing equity duration. As seen in Exhibit 2, PODD’s covariance structure has shifted downwards since late February. This was instrumental in setting the scene for the gain in relative strength against the benchmark in May. The PODD share price caught a bid throughout June all whilst reducing equity beta at the same time. These are features investors are paying a premium for in FY22 and adds into our bullish thesis from the market’s reasoning.
Exhibit 2. PODD down-shifting covariance structure and reducing equity beta, investors chasing this premia
Data: Updata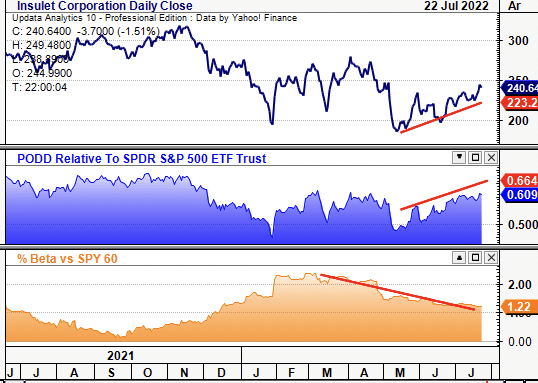
Furthermore, PODD has strengthened against the medical devices and health care equipment sector since May. It now trades back up at FY21 strengths relative to the sector, as seen below. This is incredibly important. Healthcare stocks have caught a bid in May-July and have outperformed. Hence, PODD appears to offer differentiated value against a strengthening sector, telling us it is set to outperform. With the stock gaining at pace versus the sector, we feel investors will begin to realize this, and eventually the trade will begin to revert to the mean. However, with earnings around the corner, this could extend the rally out into November (before Q3 FY22 earnings).
Exhibit 2. PODD gaining in strength relative to an outperforming sector. Bullish lead indicator, by estimation
Data: Updata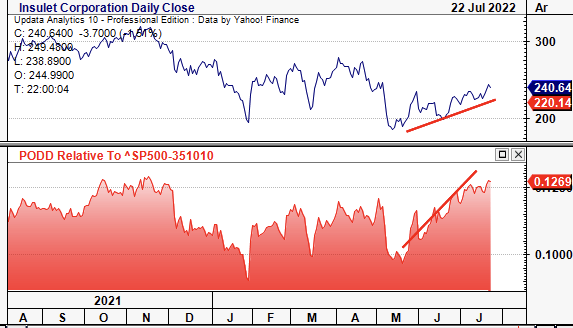
Fundamental factors differentiate PODD in macro regime
PODD has grown sales and gross profit sequentially over the past 7 years to date. It also printed $52 million in quarterly operating profit in Q1 FY22, a 147% YoY gain (but slightly off Q4 FY21’s $68 million). Moreover, as seen in Exhibit 3, the company has consistently compounded capital on its asset base, up from a net loss on ROA from FY15-FY20 to deliver a 2% net return last quarter. In total, revenue grew 21% YoY, with Omnipod DASH underlining ~90% of new starts in the US. Moreover, PODD also grew international revenue 12% YoY in a time when shortages, Covid-19, inflation, etc. had a large impact on global healthcare supply chains.
Exhibit 3. PODD continues to compound return and grow operating profit whilst net ROA compounds annually
Data: HB insights, Refinitiv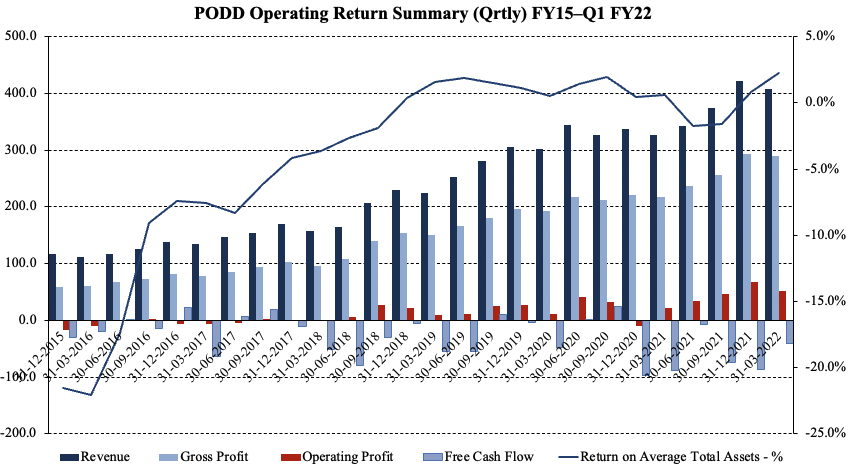
On the segment front, drug delivery grew 36% YoY and printed a 71% gross margin, up ~460bps YoY. This is impressive to us as it stems from efficiency at the revenue level in a time when costs are increasing substantially for vendors. In the same vein, operating margin was ~13% and gained ~630bps YoY. Again, we’ve taken serious note of this fact and believe the market will begin to as well. The operating profit carried down to $0.55 in EPS, more than 100% gain from Q3 FY21.
Exhibit 4. Margin expansion in time of inflationary headwinds for manufacturers, differentiating factor
Data: HB insights, Refinitiv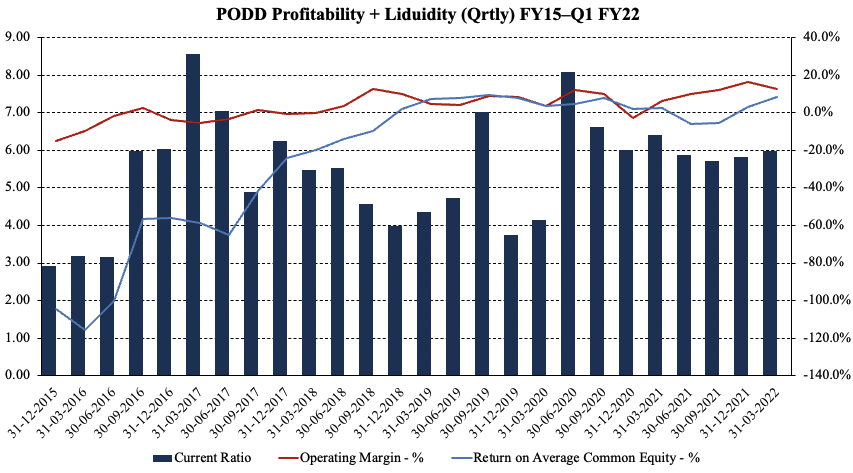
We note the company has printed a series of losses at the FCF level. In fact, FCF has been seasonal and averages a loss over the past 5-years to date on quarterly returns. It has also printed an annual FCF loss since FY15. Undoubtedly, FCF is the absolute lifeblood of an entities valuation. It measures the amount of funds a company has to meet ongoing obligations, and, how much cash it can distribute to its shareholders and creditors.
Importantly, is that negative free cash flow is not only fine, but is actually desirable when the return on investment easily outweighs the cost of capital, and that adequate liquidity is available. As seen in Exhibit 4, it has ample liquidity and short-term obligations are covered more than 6x from liquid assets. We estimate these trends to continue with $947 million on the balance sheet in Q1 FY22 and interest cover of ~5x. Hence, it turns to return on investment. We define PODD’s ROI as its net operating profit after tax (“NOPAT”) divided by last year’s invested capital. We prefer to use the previous year’s invested capital over average working capital as it allows us to see the ratchet effect of management’s investment decisions. We also call this operating leverage.
Basically, we’re looking to see how much NOPAT was generated from the previous year’s invested capital. In Exhibit 5, we note PODD generated ~38% ROI in our method. PODD has a WACC of 8.2% and therefore it is compounding capital at a rate far greater than the cost it paid for this. This asymmetry is yet to be fully reflected in the stock price, we estimate. However, with this kind of cash flow generated from management’s capital budgeting decisions, this is a heavily bullish factor in the investment debate.
Exhibit 5. Q1 FY22 return on capital summary – PODD able to ratchet up NOPAT based on capital budgeting decisions
Data: HB Insights, PODD SEC Filings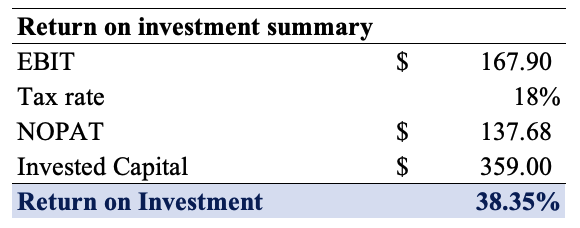
Valuation factors and price objective
The stock trades at ~30x book value, and this is actually below its historical mean. As seen in the chart below, the stock blew up in FY19, potentially distorting the long-term average. It also commands a substantial premium at ~15x sales, well above the GICS peer median’s 7.8x. However, we need to make some adjustments for PODD’s capital structure, in order to reflect the company’s true corporate value.
Exhibit 6. PODD trades below historical average book value, but average appears to overshoot
Data: Refinitiv Datastream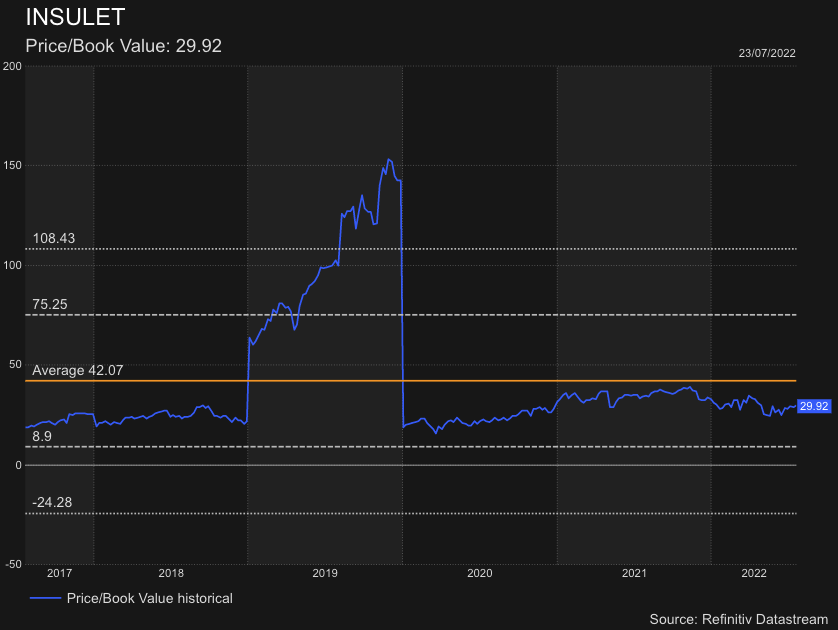
With ~$1.4 billion in debt and $709 million in cash we arrive at an EV of $17.65 billion for PODD. As such, it trades at just ~4x book value, far more respectable for investors to pay. In fact, as seen in Exhibit 7, if we were to pay 4x book value, there would be a substantial mispricing to the upside with an implied differential more than $215 EV level and ~$47 on market capitalization.
In order to evaluate alpha horizon period in our trade we look to see what kind of implied return we can expect based on what we pay, in terms of value (instead of price). In that regard, PODD’s ROE and ROE from FCF (“ROE[FCF]”) are substantially low (although, using FCF is not a clean measure in this case due to PODD’s return on investment strategy, as seen earlier). Hence, ROE is 8.6% for PODD. However, that is the ROE for PODD, not ours. We paid ~4x the book value, or 30x when just using market value. As such, our investor ROE is just ~2.2%, extending the equity duration on long-term company value to more than 30 years.
Exhibit 7. ROE on investors equity is thin and suggests upside is bias towards near to medium-term at present
Dat: HB Insights Estimates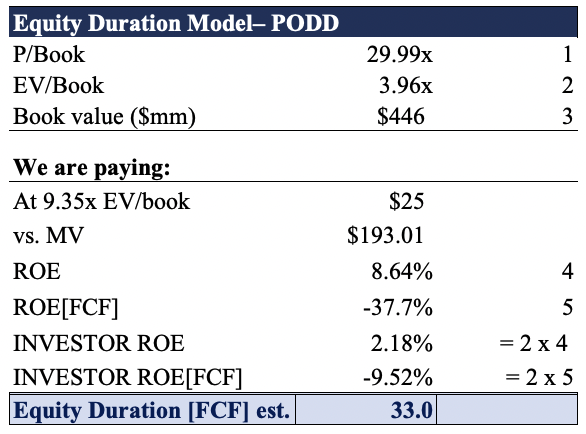
Therefore, the near-term investment thesis remains more compelling for PODD, in line with the greater findings in this report.
Technical drivers are supportive
On that note, we see bullish support at the technical level as well for PODD. This is incredibly important in the current investment landscape, to navigate market psychology and guide position sizing and timing (entry/exit). Point and figure charting reveals price action has broken above an outer resistance trend and formed two new uptrends off its bottom. As seen below, there are now multiple upthrusts from previous lows as a bullish indicator. Multiple price targets are now clustered around the $284 region and we look to see further upside based on this chart.
Exhibit 8. Multiple upside targets clustered to $284
Data: Updata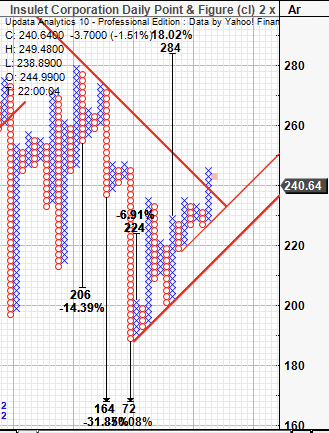
Moreover, tracing the fibs down from the previous high in April to the May low, we can see that it has already completed more than 50% move and is now testing the 61.8% mark. What is striking is the validation PODD has displayed to the fibs channels, as seen in the chart below. At each tab, prices have either completed a reversal or extended the most recent moves to the upside. We see this as key data in order to establish our price objectives moving forward. We are seeking a return horizon of ~4-6 months, and have entered in June on the 23.6% reversal. Investors can see the depth of the wick setting the bottom there and then a bullish engulfing candle to set the new uptrend. On this data, our price objectives are set at $255, and with support from there, we look to $275 as the next price objective, before a top at $284 to close the position.
Exhibit 9. Confirmation of reversals and extensions at multiple levels at the fib — price objectives to $255, $275 before $284
Data: Updata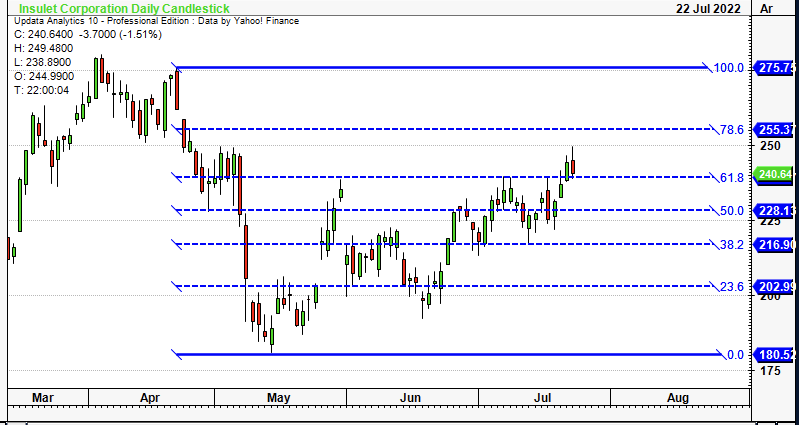
Adding further weight to the technical picture is the chart below. Shares have punched up above the cloud and are well above cloud support. The lag line looks to just about break through as well and this is prime bullish confirmation, in our estimation. If the lag line breaks through we are confident the trend is set to the upside. Moreover, OBV and momentum have both extended their upward run as well, seen in Exhibit 10. These trend indicators lead us to believe the lag line will break through the cloud and that the near-term uptrend will continue into our holding period.
Exhibit 10. Trading back above cloud support, lag line at the cloud, OBV and momentum both extending upward trajectory
Data: Updata
Portfolio statistical summary
Balanced portfolios with exposure to alternatives have outperformed in FY22. As seen in Exhibit 11, an equal weight, balanced portfolio (portfolio 2) as described has outperformed conventional 60/40 and so called ‘diversified/ risk parity’ portfolios on an equal weight basis. This is a high sharpe strategy in FY22 that’s seen a return of +0.59% YTD (alpha of ~20%), drawdown of just -3% and portfolio standard deviation of 6%. Both Sharpe and Sortino ratios are positive at 0.13 and 0.18 respectively, unlike all other instruments including the benchmark.
Hence, we set out to observe the effect of adding PODD to our equity risk budget and what this might do to forward looking returns. We see that, when backtesting from Jan-July 2022, allocating an equal weight of equity risk to PODD see’s us underperform the balanced setup (portfolio 3 vs. portfolio 2) but outperform both the 60/40 and benchmark portfolio (S&P 500). This trend continues all the way down to allocating PODD on a 2% basis, after which point the data becomes negligible.
As such, PODD justifies its inclusion into the overall managed equities/cross-asset strategy.
Exhibit 11. Portfolio statistical test summary
Data: HB Insights, Portfolio Vizualiser Data: HB Insights, Portfolio Vizualiser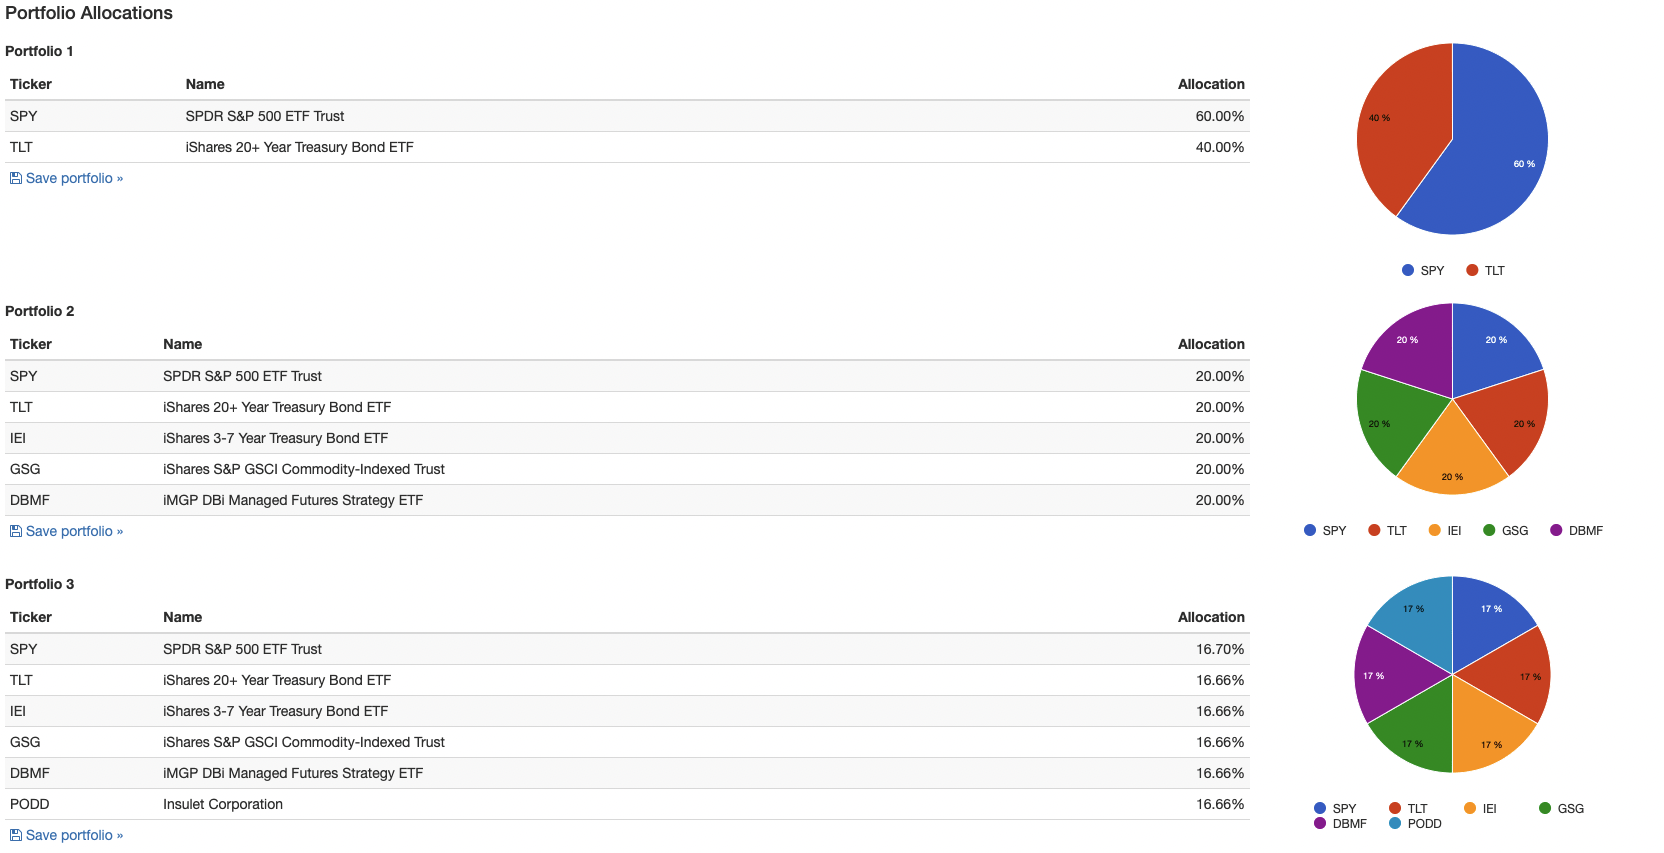

In short
We are seeking a near-term return objective of 18% of $40 per share in PODD. We define near-term in this instance as 4-6 months. The company has its earnings scheduled on 4 August and we envision it to print a strong result, promoting post earnings announcement drift. We see the confluence of differentiated market, fundamental and technical factors as a flavoursome recipe for us to feast on, and $40 per share within a 4-6-month time frame is a tidy return.
We look to three price objectives to ratchet up from $255, $275 and a final extension up to $284. We’ve derived these targets on a combination of technical and fundamental factors. Finally, we note PODD justifies its allocation of equity risk within the overall global opportunities portfolio. Rate buy PT $284.
Be the first to comment