Pgiam/iStock via Getty Images
Investment Thesis
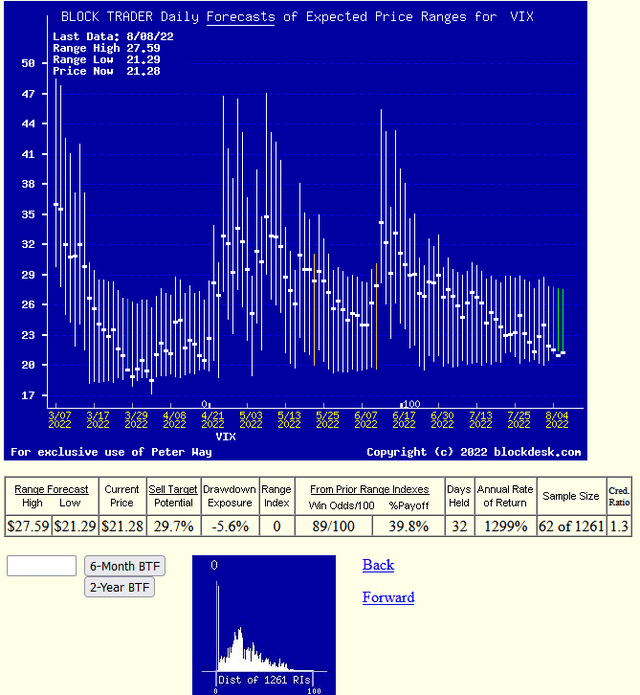
Figure 1 pictures volume equity transaction impacts on the overall market in the form of vertical line measurements of what potential price declines are being hedged against to make big-volume trades possible. The taller those verticals, the greater the uncertainty seen possible in market index prices.
What makes this worst for individual investors is they get scared at the worst possible time – just when their confidence is enough destroyed that they will sell their equities to institutional buyers. And then, having taken a loss from higher prices, stay out of the market fearful of losing more – somehow, in cash? They throw away the opportunity of riding the market higher with the institutional players.
Hence, the “fear index” label.
But the fearsome folks are not the big-volume buyers, whose billion-$ portfolios require big trades to have any management impact.
No, the Figure 1 picture needs to be read in an inverted manner. When the VIX is high markets are likely to decline; when it is low, so is the probability of markets going much lower.
Figure 1
(used with permission)
Figure 1 shows six months of repeated daily appraisals of the range of general market index uncertainty, with the day’s VIX-index calculated number as the heavy dot superimposed on the vertical range.
Presented this way, the greater fear of more price declines is shown by the size of the vertical below the dot. Measured as a percentage of the whole range, we name it the “Range Index [RI]”.
The current-day RI is the furthest range to the right, and its RI value is zero, emphasized by a zero-noted line in the small “thumbnail” picture below the row of data in Figure 1. The little one counts the number of market days in the past 5 years at each RI level.
That’s right, the market-making community of investing professionals who make continuous equity market transactions possible during open market hours, at the end of this NYC-market day were making some sizable bets that the next day’s markets were unlikely to see any opening price panic unlike the apparent calm present at the closing moment.
But communications technology improvements are making progress in 24-hour trading, and they know how to react quickly and effectively. Note that the scale on the left stops at 17, not zero. And also note, please that the slightly-ragged bottom edge of the daily progression of range bottoms has gradually worked slightly higher over the past 6 months.
It doesn’t strike us as worrisome.
Our regular readers recognize that this presentation of balances between opposite outcome possibilities is also usefully applicable to specific stock, ETF, and index vehicles. And we continue those in our articles and comparisons’. There we use the institutions’ fore-sights evident in hedging actions rather than the bulk of rear-sight history re-play “evidences”
Conclusion
It just seemed timely to respond to a continuing drum-beating crescendo of “near-certainty” of worse-yet ahead of us, and its “boogey-man” history stories. Coming market price prospects should have representation in both directions. But recognizing why so many individual investors fail to recover from market gyrations deserves and should benefit from recognition.


Be the first to comment