

hh5800
The global manufacturing PMI survey found average input costs rising at an increased rate for the first time in five months in September, hinting at stubbornly persistent inflation within the worldwide factory sector. The renewed upswing in price pressures is being driven by higher energy prices and currency fluctuations, and as such was principally focused on Europe and Japan.
Encouragingly, supply chain cost pressures and wage pressures eased, helping bring down factory cost inflation in the US, mainland China and many other economies.
Elevated input cost inflation
The input cost index from the JPMorgan Global Manufacturing PMI survey, compiled by S&P Global, edged higher in September, indicating a slightly faster rate of price increase.
Albeit only modest, the acceleration in price growth contrasted with slower rates of inflation in the prior four months, and leaves the index signaling persistent inflationary pressures at an elevated level. While down sharply compared to the peaks seen earlier in the year, the latest reading was among the highest seen since early 2011.
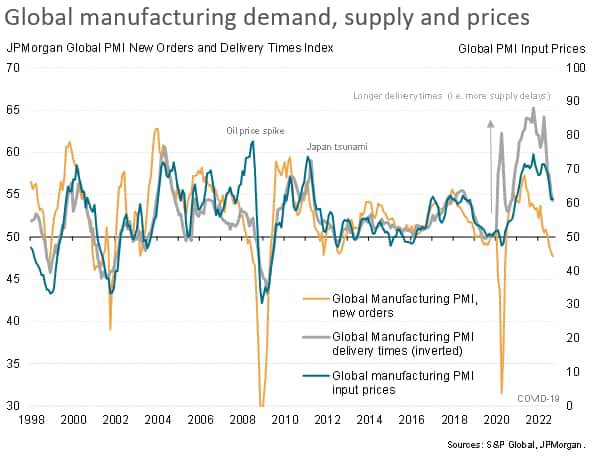
The failure of input cost inflation to moderate further occurred despite demand falling sharply during the month, and despite a sustained easing of supply side constraints. The PMI survey’s gauge of new orders indicated falling demand for a third successive month with the rate of order book loss accelerating to the fastest since April 2009, excluding pandemic lockdown months.
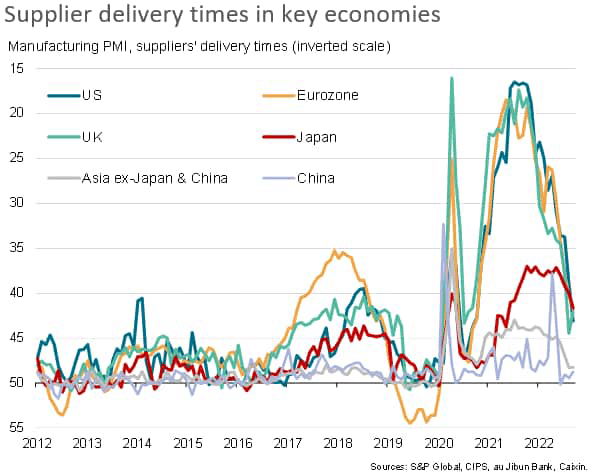
This cooling of demand helped to alleviate supply chain constraints. The survey’s supplier delivery times index showed the incidence of delays moderating in September to the lowest for two years.
Record energy price pressures
A deeper dive into the reasons provided by manufacturers worldwide for their costs to have risen also suggested supply chain price pressures have moderated, as have wage pressures. But energy-fueled cost increases have risen to a survey high.
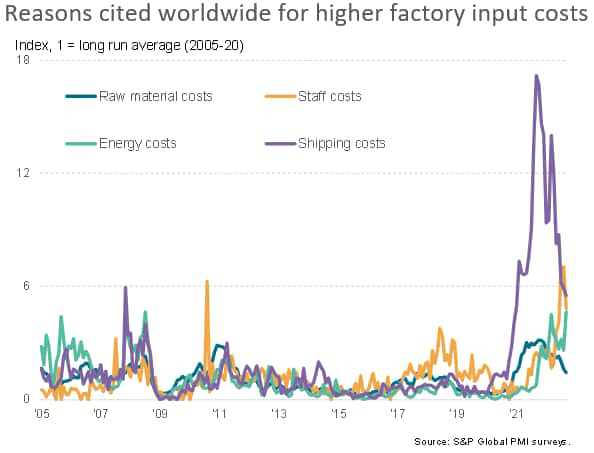
The number of firms reporting that costs had risen due to higher raw material prices has fallen to just 1.4 times its long run average. That’s down from 3.2 times the long run average a year ago.
With demand for inputs falling, shipping costs have meanwhile also dropped sharply. The number of manufacturers citing input prices to have been driven higher by shipping costs remains elevated at 5.5 times the long run average in September, but this compares favorably with a peak to 17.2 times the long run average a year ago.
Staff costs likewise remain an elevated factor in driving input prices higher on average globally, but September saw a welcome sign of these wage pressures cooling from August’s survey record high.
In contrast, the number of companies reporting average input costs to have been driven up by energy prices rose in September, jumping to 4.7 times the long run average – the highest seen since data were first available in 2005.
Cost pressures rise most in Europe and Japan
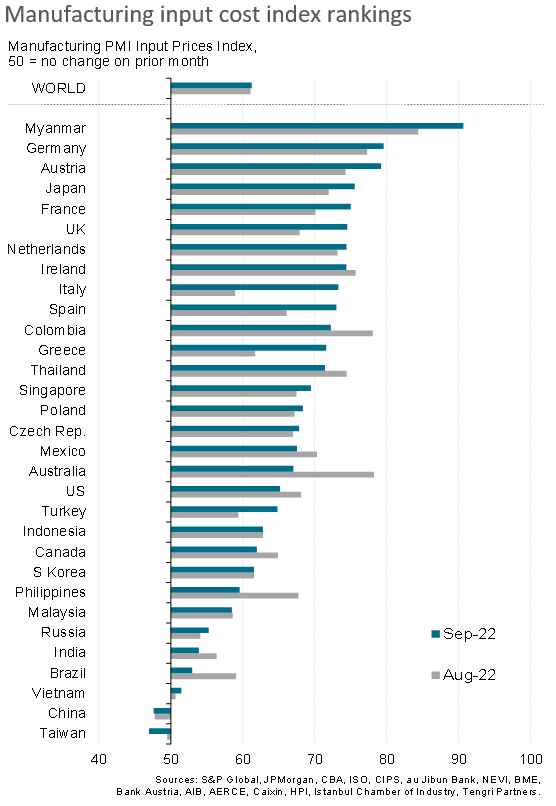
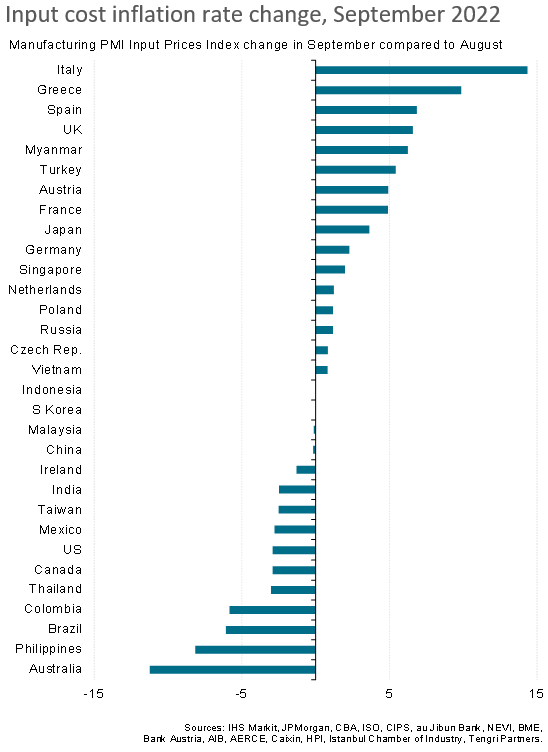
Europe accounted for eight of the top 10 countries with the steepest input cost rates, with Japan also seeing especially sharply rising costs (though Myanmar once again saw the steepest rise).
The biggest month-on-month upturns in price pressures were also recorded in Europe, with the increase in the rate of inflation led by Italy, followed by Greece, Spain and the UK. Strong upturns were also seen in Myanmar, Turkey, Austria, France, Japan and Germany. Currency weaknesses – notably against the US dollar – were often reported as having driven up import prices, though in Europe the biggest factor by far was the surging cost of energy.
At the other end of the scale, input costs fell in Taiwan and mainland China, often linked to weak demand amid ongoing COVID-19 containment measures.
While the strong dollar drove up import and energy prices in many countries, the surging greenback was notable in helping to moderate input cost inflation in the US.
Rates of increase also cooled markedly in Australia, the Philippines, Brazil, and Colombia, with more modest easings seen in Canada, Mexico, India and Ireland. In many cases, these softer rates of inflation reflected a combination of slowing demand growth and fewer supply chain constraints.
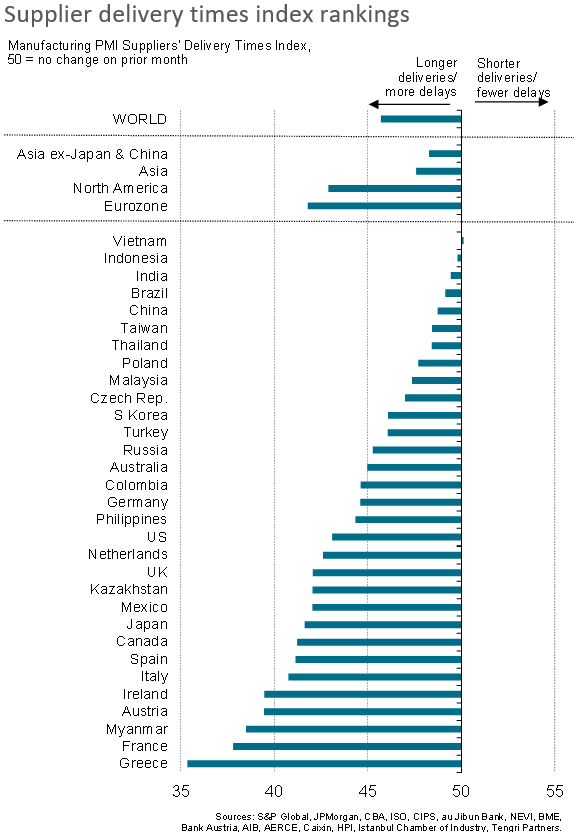
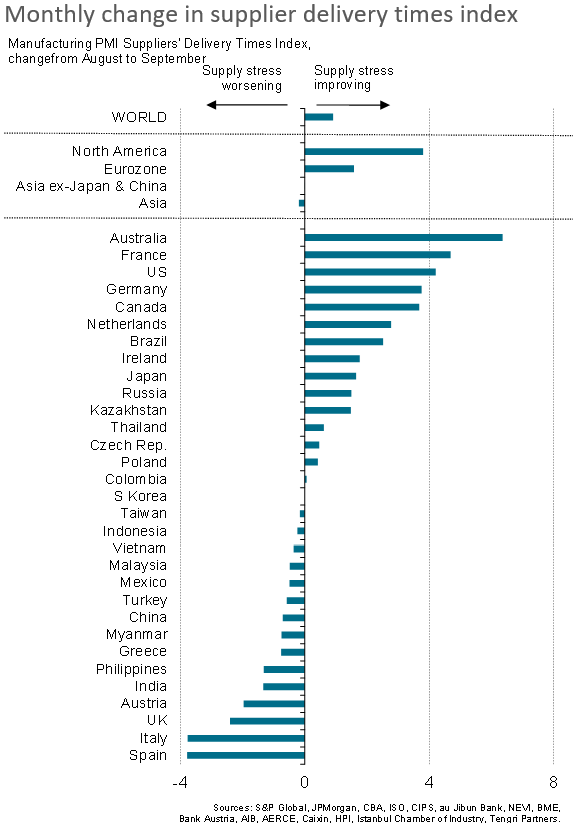
Supply delays at two-year low
Although energy costs have risen, the recent slump in demand for raw materials, in turn linked to lower new order inflows into factories, has taken substantial pressure off supply chains, with the incidence of delays worldwide falling to the lowest since September 2020.
The most significant easing of supply chain delays was seen in Australia, but marked reductions in the number of delays were also seen across North America and the eurozone, albeit with delays worsening considerably in Spain and Italy. The UK was also notable in seeing supply issues flare up again, often linked to port strikes and Brexit factors, but in all cases the incidence of delays remains far below prior pandemic peaks.
While several European countries saw production of inputs being constrained by energy shortages, this was often outweighed by the broader improvement in global supply and logistics conditions.
However, it should be borne in mind that this improvement in global supply is to a large degree a function of falling global trade flows and weakening demand, as explored further in our accompanying note on global manufacturing output and demand trends.
Editor’s Note: The summary bullets for this article were chosen by Seeking Alpha editors.
Be the first to comment