

Art Wager/E+ via Getty Images
When this year started, I expected Industrial REITs to outperform the REIT average. The year is not over, but at this point Industrials, with total returns of (-32.13)%, are lagging the Equity REIT index return of (-28.08)%, according to Hoya Capital Income Builder.
Hoya Capital Income Builder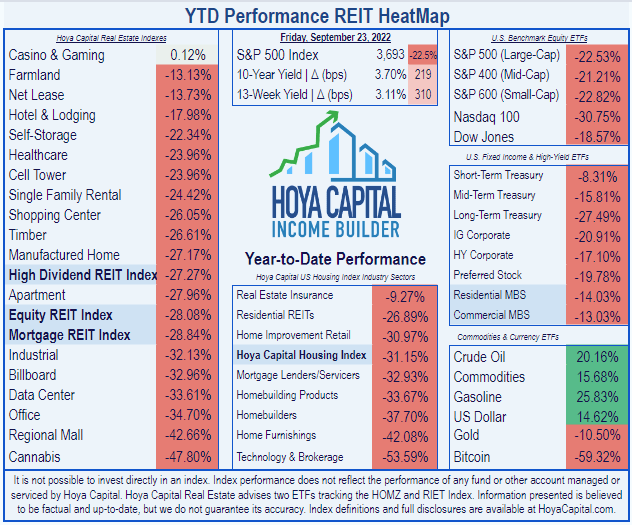
This has happened, even though Industrial REITs as a whole are delivering stellar operating performance, with demand for well-located logistics space still outstripping supply.
Hoya Capital
FedEx (FDX) warned last week that it will likely miss its full-year revenue target, due to anticipated weakness in Asia and challenges in Europe, and expects conditions to worsen in the quarter ahead, on weaker global volume. The prospect of a global economic slowdown has of course had a deflating effect on Industrial REITs, and the market in general.
However, on the Q2 earnings call for Prologis, CFO Tim Arndt remarked,
there’s frankly a stark difference between what one reads in headlines versus what is actually happening in our business.
That firm, the largest of all the Industrial REITs, still estimates that the market for industrial space is experiencing more than 800 msf (million square feet) of pent-up incremental demand, even with this pullback.
Industrial vacancy rates have declined to record-lows below 3%.
Hoya Capital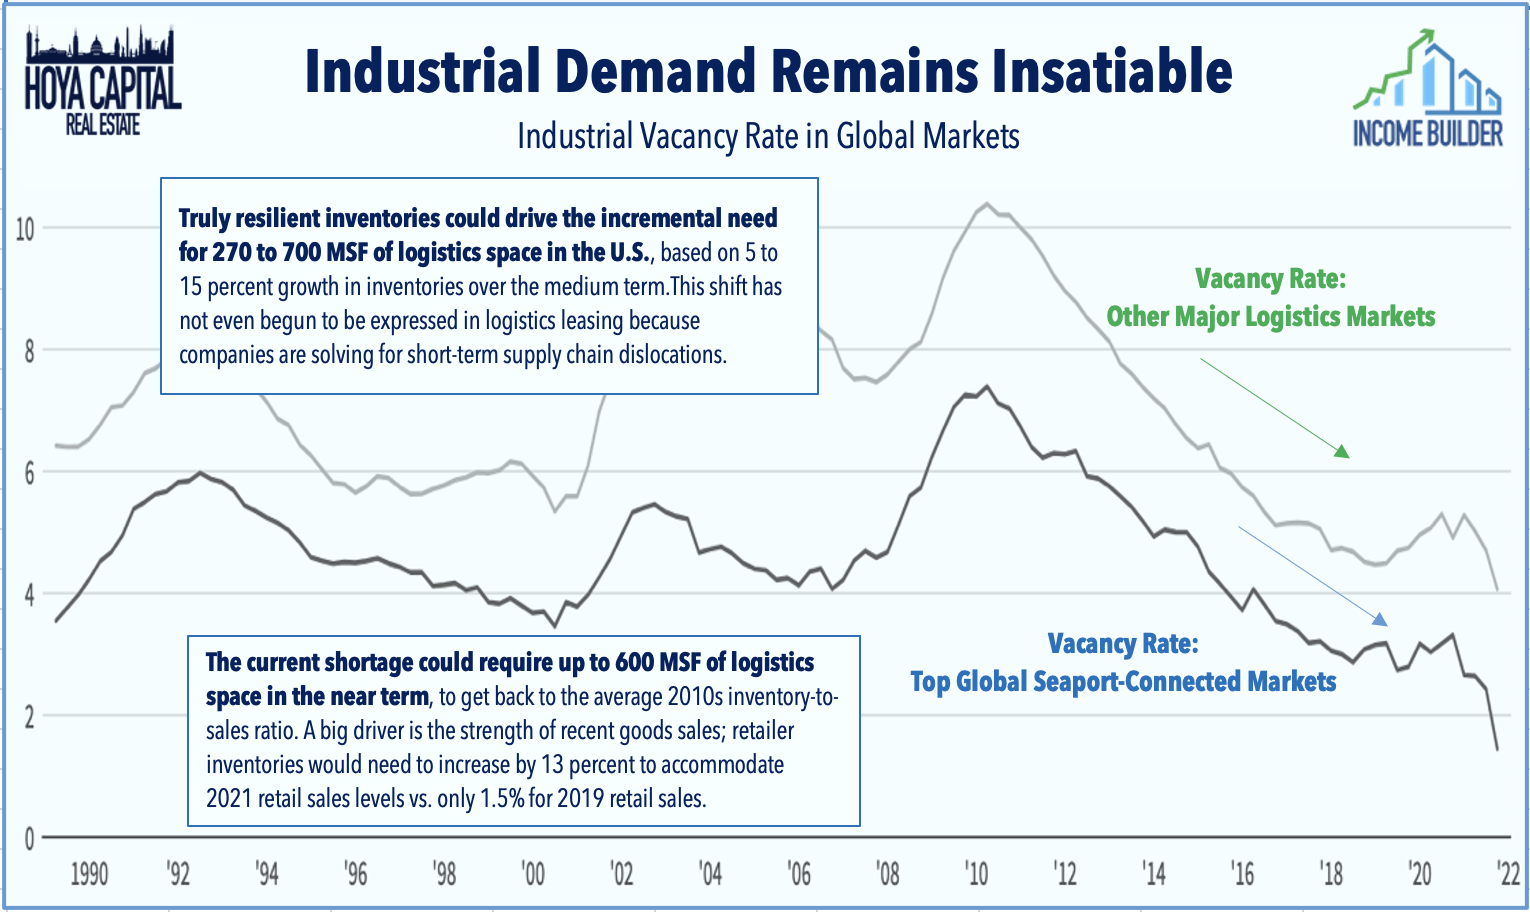
Meanwhile, rent growth surged 15%, and the Industrial sector as a whole reported record-high leasing spreads of nearly 30% last quarter.
Hoya Capital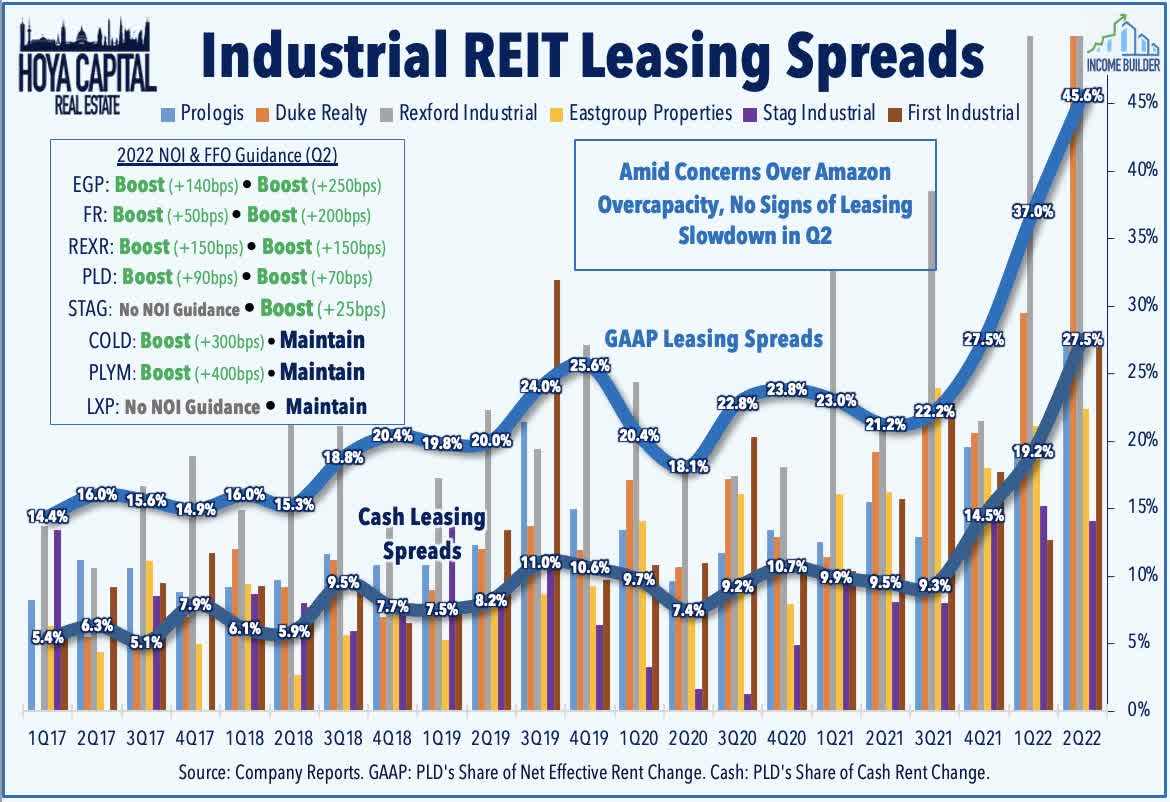
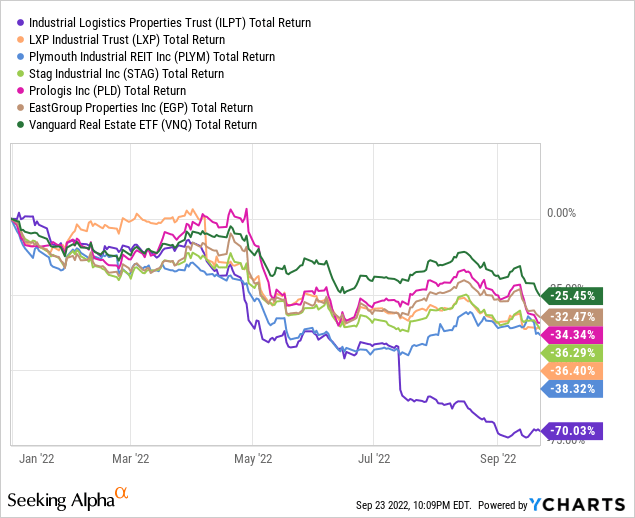
So the sector is performing well, but not being rewarded by investors, probably because of its below-average Yields. Amidst all this disappointing underperformance, Industrial Logistics Properties (NASDAQ:ILPT) has fared by far the worst, at (-70.03)%.
What is behind this precipitous drop, and is it likely to turn around?
Meet the company
Industrial Logistics Property Trust
Founded in 2017 and headquartered in Newton, Massachusetts, Industrial Logistics Properties owns 412 properties, totaling 60 msf, across 39 states, boasting 98.9% occupancy. The average remaining term on their leases is 9.2 years.
In February ILPT bought out Monmouth Real Estate for $21.00 per share in an all-cash transaction, valued at approximately $4.0 billion, assuming Monmouth’s debt of about $323 million. The acquired portfolio included 126 Class A, single tenant, net leased properties totaling over 26 msf, 99.7% occupied, with a weighted average lease term of approximately 8 years. This acquisition has almost doubled their rentable square footage, but has resulted in balance sheet challenges that will be discussed below.
Monmouth was very FedEx-dependent, so the ILPT tenant base is not very well diversified. FedEx alone accounts for 29% of the company’s annual revenue, and Amazon (AMZN) another 6.8%, while the top 10 tenants combine for 49.3%. With their top two tenants recently lowering guidance, the near term looks problematic for ILPT revenues.
Company investor presentation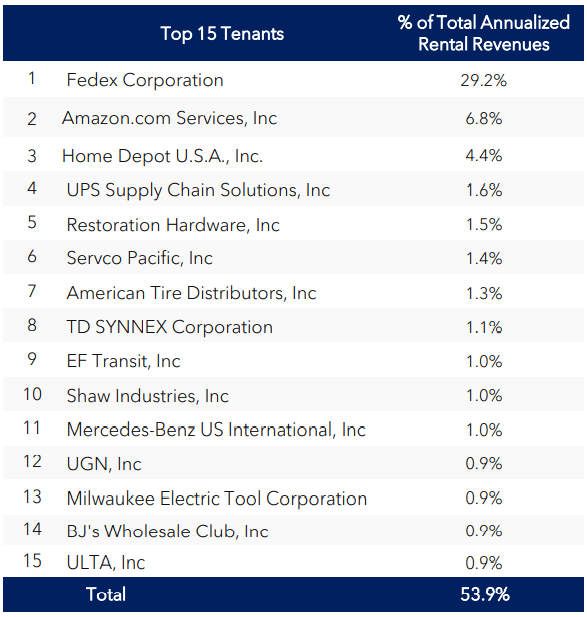
In spite of this concentration in two world market-cap leaders, less than 78% of ILPT revenue comes from investment grade tenants.
Company investor presentation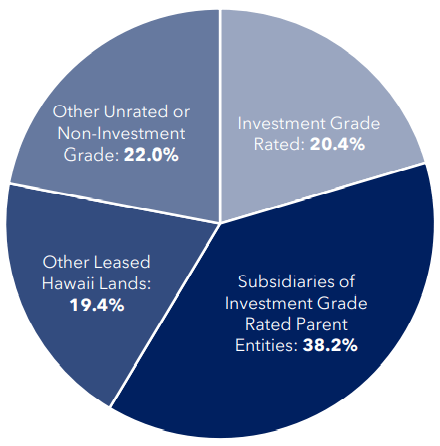
Though diversified across 39 states, ILPT is far more concentrated in Hawaii than anywhere else, with 29.8% of revenue derived from that state.
Company investor presentation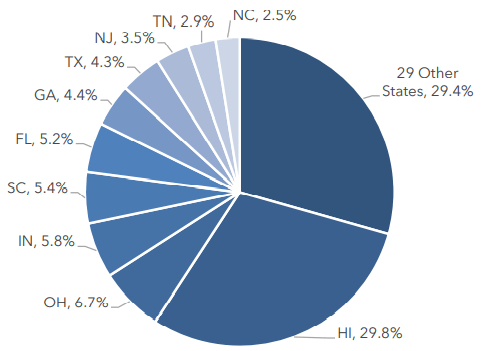
The 226 ILPT properties in Hawaii dwarf the number in any other state. Ohio ranks second, with just 20 properties and 6.7% of revenues.
Company investor presentation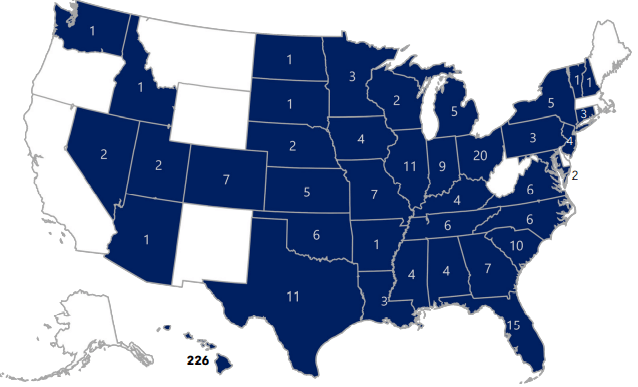
By far their largest installation is the Sand Island facility near the picturesque Port of Honolulu, comprised of 48 buildings and 2.45 msf.
Company investor presentation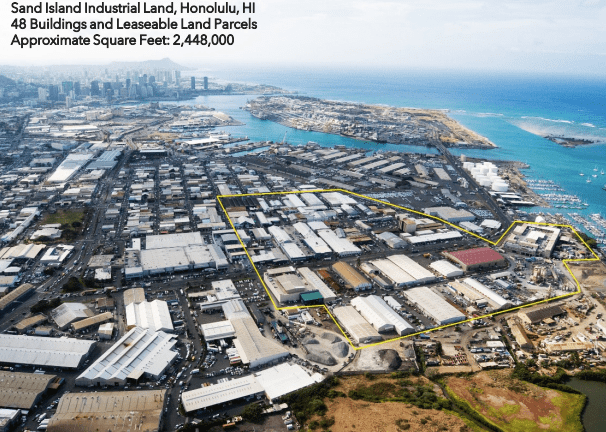
About two-thirds of annual revenues come from warehouse and distribution facilities. Another 29% comes from ground leases, with the remaining 6% from light manufacturing.
Company investor presentation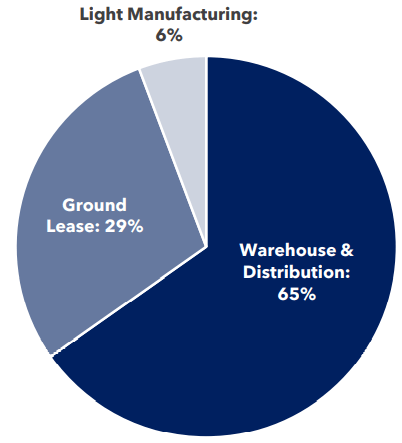
Leasing and rental rates are looking good. Over the past 12 months, ILPT has experienced a 39% roll-up in rent, on 7.1 msf of new and renewed leases. Lease expirations are nice and smooth, averaging just 5.4% of revenue over the next 5 years, before an 11.7% challenge in 2027.
Company investor presentation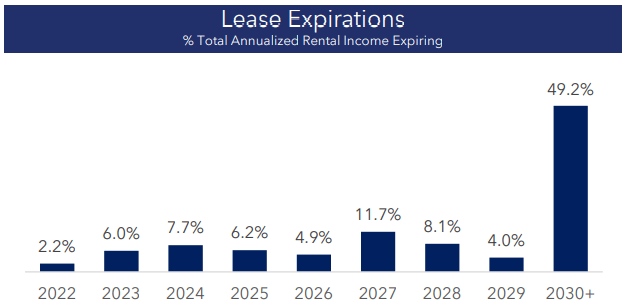
ILPT owns 61% of a joint venture with Mountain Industrial REIT LLC, that includes 93 properties and about 21 msf that brought in $28.3 million in EBITDAre in Q2. It also owns 22% of a joint venture with Industrial Fund REIT LLC, that includes 18 properties and about 12 msf that brought in another $11.3 million.
FFO for Q2 2022 was (-2.0) million, or $(-0.03) per share. For the first half, FFO was $6.1 million, or $0.09 per share, according to the company’s latest 10-Q. So the big gamble on acquiring Monmouth does not appear to be paying off just yet.
ILPT is externally managed by the RMR Group LLC.
Growth metrics
Here are the 3-year growth figures for FFO (funds from operations) and TCFO (total cash from operations).
| Metric | 2019 | 2020 | 2021 | 2022* | 3-year CAGR |
| FFO (millions) | NR | $121.0 | $122.1 | $92.6 | — |
| FFO Growth % | — | — | — | (-24.2) | NA |
| FFO per share | $1.76 | $1.86 | $1.89 | $1.42 | — |
| FFO per share growth % | — | 5.7 | 1.6 | (-24.9) | (-6.95)% |
| TCFO (millions) | $116 | $115 | $111 | $162 | — |
| TCFO Growth % | — | (-0.9) | (-3.5) | 45.9 | 11.86% |
*Projected, based on per share projections and 65.2 million shares outstanding. NR = not reported
Source: TD Ameritrade, CompaniesMarketCap.com, Seeking Alpha Premium, and author calculations
Because of the huge acquisition of Monmouth’s assets, total FFO and TCFO growth rates may be misleading, making growth appear better than it actually is. The per-share figures are a better guide to the company’s performance, and those have shown a sharp drop-off this year, following three years of rather stagnant performance.
Meanwhile, here is how the stock price has done over the past 3 twelve-month periods, compared to the REIT average as represented by the Vanguard Real Estate ETF (VNQ).
| Metric | 2019 | 2020 | 2021 | 2022 | 3-yr CAGR |
| ILPT share price Sept. 23 | $21.80 | $20.85 | $26.02 | $7.07 | — |
| ILPT share price Gain % | — | (-4.4) | 24.8 | (-72.8) | (-31.5)% |
| VNQ share price Sept. 23 | $93.60 | $76.31 | $106.62 | $83.44 | — |
| VNQ share price Gain % | — | (-18.5) | 39.7 | (-21.7) | ( -3.78)% |
Source: MarketWatch.com and author calculations
In terms of share price alone, ILPT, like most industrials, outperformed the VNQ in pandemic-stricken 2020, but underperformed a bit in 2021. Then it basically fell off the table this year. Investors who bought shares three years ago have taken annual losses of more than 30% on ILPT, while VNQ investors buying at the same time have lost “only” 3.78% per annum.
Balance sheet metrics
ILPT’s balance sheet is flashing a lot of red. Assets outweigh liabilities by only 1.17x. Debt ratio of 34% doesn’t look too bad, but it is significantly worse than the REIT average, and far worse than the Industrial REIT standard. The worst problem is that debt/EBITDA is a staggering 37.2. As the Monmouth assets continue to kick in their production, this number will definitely come down, but it has a long way to go, to get to healthy.
| Company | Liquidity Ratio | Debt Ratio | Debt/EBITDA | Bond Rating |
| ILPT | 1.17 | 34% | 37.2 | — |
Source: Hoya Capital Income Builder, TD Ameritrade, and author calculations
This company, with its $0.46 billion market cap, is holding $292 million in cash, but faces $4.5 billion in debts, at a weighted average interest rate of 4.2%. That includes $1.7 billion in fixed rate loans, $1.4 billion in its bridge loan facility, and another $1.4 billion connected to its two joint ventures.
Company investor presentation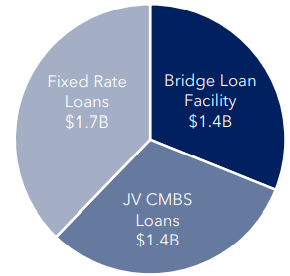
The debt maturity schedule as of June 30 was at emergency stage, with consecutive years of $1.4 billion payments due in 2023 and 2024.
Company investor presentation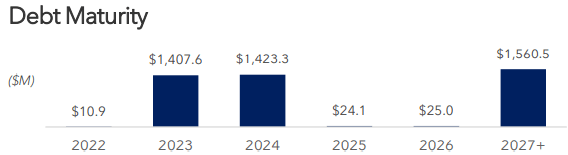
However, ILPT recently closed on a $1.235 billion debt financing deal, with a final maturity date in 2027, secured by a portfolio of 104 industrial properties totaling approximately 18.6 million sf across 31 states, 96.8% occupied as of June 30, 2022. The financing comes with a weighted average remaining lease term of approximately 10.5 years, and a hefty total weighted average interest rate of SOFR plus 3.93% per annum.
According to ILPT President and COO Yael Duffy,
This debt financing enabled us to fully repay our $1.385 billion bridge loan due in February 2023 with debt that has a final maturity date in October 2027 and excess cash. ILPT . . . maintains flexibility to repay significant debt and reduce leverage in the future through prepayment options.
The company will still have to do something about its $1.4 billion in payments scheduled for 2024, but this financing deal at least kicks that can down the road, and gives the company a fighting chance to earn their way out of the hole they have dug for themselves.
Dividend metrics
This is an especially bad time to be cutting dividends, but that is exactly what ILPT did after the Monmouth acquisition, slashing the payout from $0.33 per quarter, all the way down to one penny. The Yield of 0.57% is dismal, even for an Industrial REIT. Whereas most Industrial REITs are excellent at growing their dividends, and produce a competitive yield on cost within 5 years, the same cannot be said of this company. The good news is, they have virtually nowhere to go from here but up, as far as dividends are concerned.
| Company | Div. Yield | 3-yr Div. Growth | Div. Score | Payout | Div. Safety |
| ILPT | 0.57% | (-33.0)% | 0.17 | 0% | C- |
Source: Hoya Capital Income Builder, TD Ameritrade, Seeking Alpha Premium
Dividend Score projects the Yield three years from now, on shares bought today, assuming the Dividend Growth rate remains unchanged.
Valuation metrics
As you might expect, shares of ILPT are dirt cheap at the moment, selling at just 5.0x 2022 FFO, and a steep 35.7% discount to NAV.
| Company | Div. Score | Price/FFO ’22 | Premium to NAV |
| ILPT | 0.17 | 5.0 | (-35.7)% |
Source: Hoya Capital Income Builder, TD Ameritrade, and author calculations
This company would appear to be a case in point for why cheap REITs tend to stay cheap, as Hoya Capital has documented. While the game is far from over, ILPT is likely to continue trading at substantial discounts to FFO and NAV for some time to come.
What could go wrong?
The company would be in a world of hurt if another economic event like the pandemic were to crimp its expected revenues from the Monmouth acquisition.
With such a high concentration of assets in Hawaii, any unforeseen event or economic downturn in Hawaii could have an outsized impact on the company’s profitability.
As noted above, ILPT will need to address its scheduled 2024 debt repayment, as their revenues will not likely be adequate under even the rosiest scenario. The best options are a further refinance, or sale of low-performing properties, or both.
While I am not saying a civil war is going to break out in the next year or two, the odds appear to me to be increasing every day, and that looming possibility is something all investors would be wise to take into account. In the event of such a catastrophe, supply chain facilities would be prized by both sides, and could be subject to destruction or confiscation.
Investor’s bottom line
It’s hard to swallow the kind of substantial losses ILPT has recently incurred for investors. However, just because it has fallen so far does not mean it can’t go lower. I think it is likely the price will be lower 6 months to a year from now, but I don’t have a crystal ball. In the meantime, there are numerous better opportunities to pursue, while ILPT sorts itself out. I rate the company a Sell.
Seeking Alpha Premium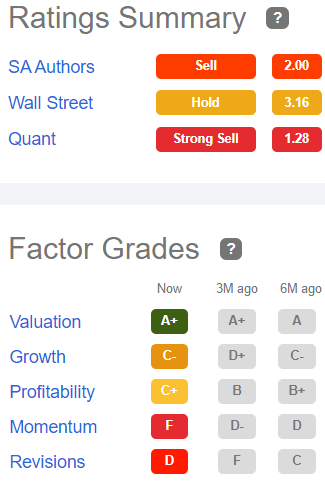
Five of the 6 Wall Street analysts that cover this company are more optimistic about it than I am, with 4 rating it a Hold, one a Strong Buy, and only one calling it a Sell. Even Revisions-sensitive Zacks recommends a Hold, and Tip Ranks is also Neutral.
The Street and Ford Equity Research both deem ILPT a Sell.
In the final analysis, the opinion that matters most is yours.
Be the first to comment