


Marcus Lindstrom
Thesis: Solid Company That’s Overpriced
INDUS Realty Trust (NASDAQ:INDT) is a small-cap (~$610 million market cap) real estate investment trust that owns, operates, and develops a portfolio of industrial and logistics properties.
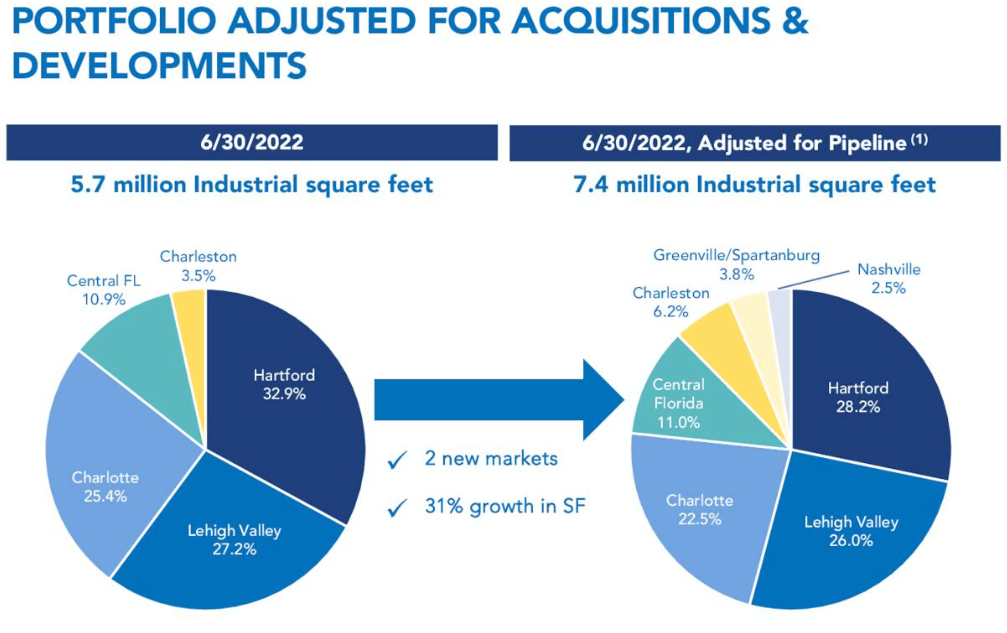
Recently, the REIT’s portfolio has experienced a high degree of turnover. Over 10% of INDT’s portfolio was added just since the beginning of 2022. There are still a few flex/office properties and parcels of land yet to be disposed, which will result in further turnover. After adding 520,000 square feet of space to the portfolio in the first half of 2022, management says they plan to add another 875,000 square feet in the second half of the year.
Though the company itself is firing on all cylinders, the issue with INDT relates to valuation. The stock price roughly doubled in the 2.5 years from mid-2019 to the end of 2021 and has since pulled back by some 25%.
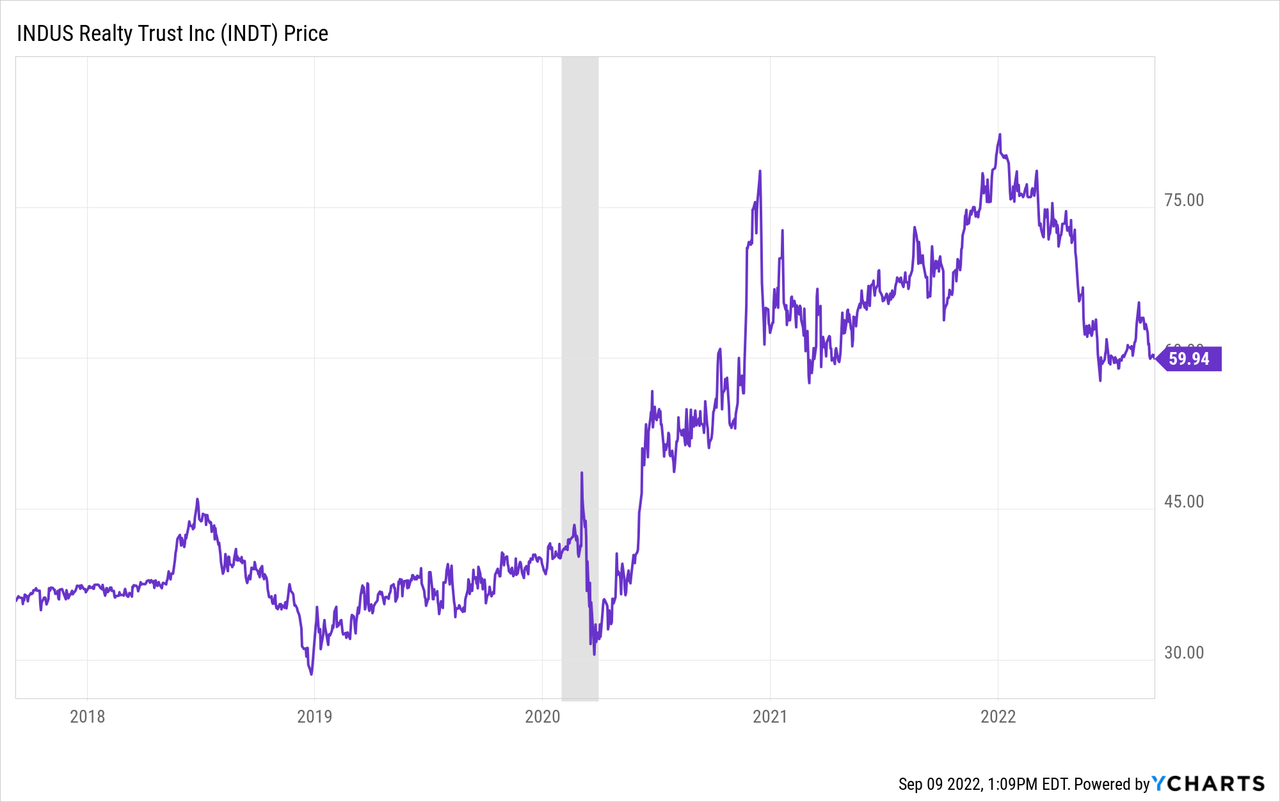
Even so, INDT still strikes me as overvalued.
My conservative estimate of AFFO per share for 2022 is $1.55, which would put INDT’s price to AFFO at about 39.3x as of this writing. Meanwhile, the analysts give a consensus estimate of $1.76 per share in FFO, which puts INDT at a price to FFO of 34.1x.
That is far higher than industrial REIT leader Prologis (PLD) with its 25x FFO multiple, despite only slightly lower growth rates from the larger peer. In fact, it is on par with Rexford Industrial Realty (REXR) with its 34.3x FFO multiple, despite REXR enjoying far higher growth rates than INDT (due largely to its trophy locations in Southern California).
INDT is trading at an AFFO yield of 2.6% and an FFO yield of 2.9%, which is a significant premium to its average property cap rate of around 4%. Though INDT is a solid company with attractive properties that are underleveraged, the stock is still too expensive.
But let’s get into the details of the REIT, and perhaps your opinion will differ from mine.
Overview of INDUS Realty
Though I normally start with a look at a REIT’s property portfolio before turning to performance, this time I want to highlight INDT’s recent per-share performance – namely, INDT’s AFFO per share growth of 12.5% year-over-year in the first half of 2022 and 14.7% in Q2 2022.
That is strong growth in profits! It underscores what a strong property type industrial assets have been in recent years.
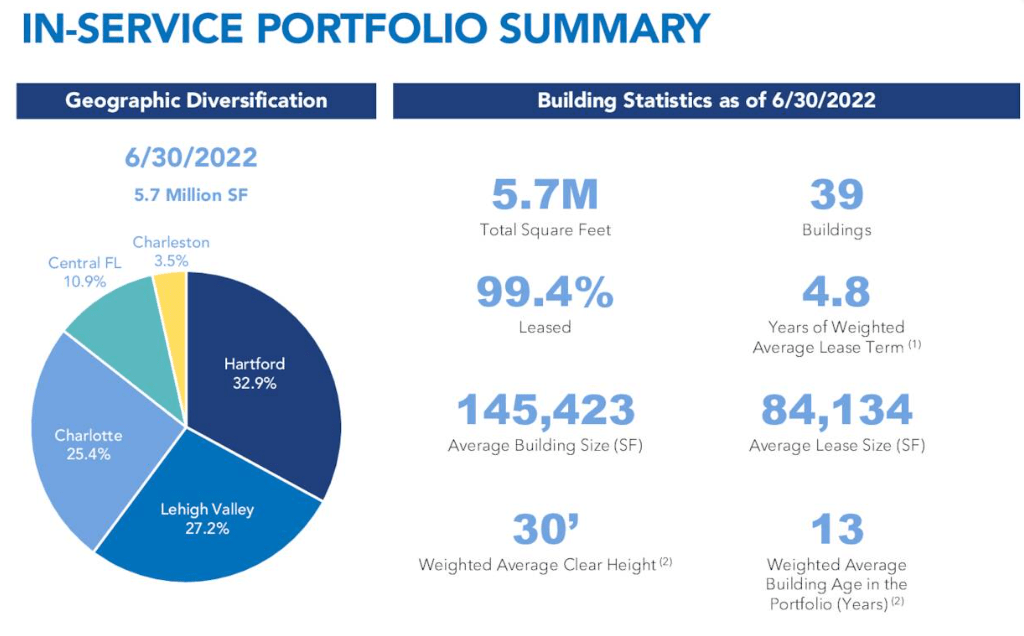
INDT’s portfolio consists of 39 buildings averaging 145,000 square feet each. For context, that’s a little smaller than the average Walmart supercenter footprint of about 180,000 square feet.
INDT Q2 Presentation
The portfolio is almost 100% leased, reflecting not just particular strength in INDT’s portfolio, but also the low single-digit vacancy rate of industrial properties in most of INDT’s markets.
The portfolio spans the East Coast, with most properties concentrated in Connecticut and Eastern Pennsylvania. But INDT also has a growing presence in Central Florida and the Carolinas.
Like other industrial REITs, INDT’s portfolio has plenty of exposure to e-commerce, with Amazon (AMZN) as its largest tenant by revenue and third-party logistics as its largest tenant industry by leased square footage.

INDT Q2 Presentation
About one-third of tenants by revenue are investment grade rated.
But in industrial, building specifications and location matter more than the credit of the tenant, because demand is incredibly high for these mission-critical assets.
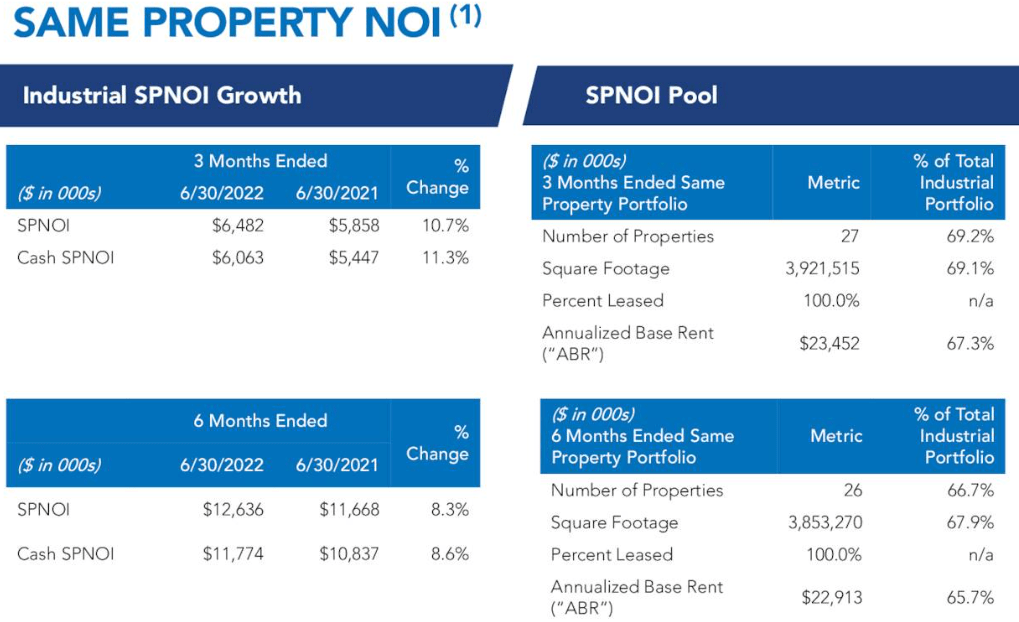
This demand can be measured by same-property net operating income growth. For INDT, SPNOI rose about 11% in Q2 and ~8.5% for the first half of 2022.
INDT Q2 Presentation
Though INDT has rent escalations built into its leases that ensure organic rent growth, the primary source of same-property NOI growth has been rent growth on new and renewed leases, which averaged around 30% in Q2.
As long as this strong lease-over-lease rent growth continues, INDT’s relatively short weighted average remaining lease term of 4.8 years will continue to be a major strength, as leases rolling over should continue to produce big jumps in rental revenue and NOI.
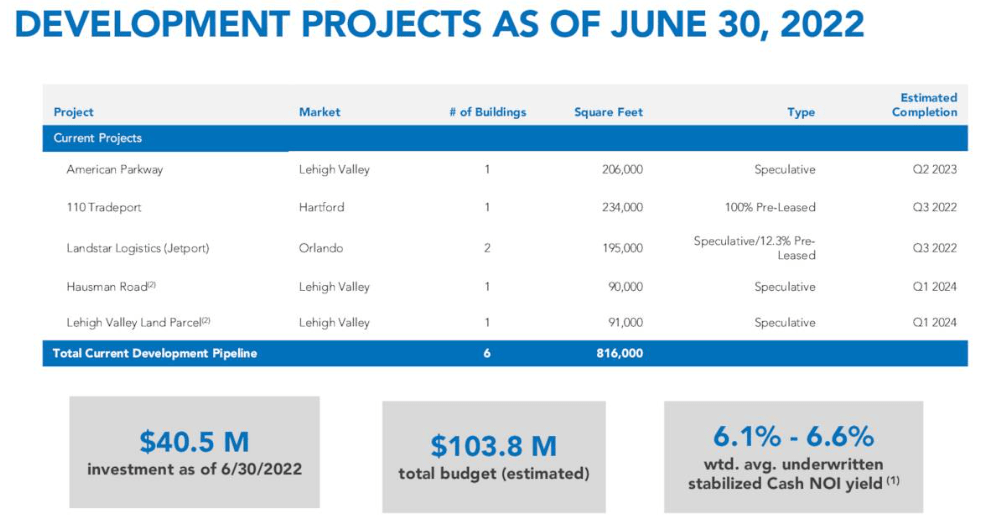
Another feature of INDT is that acquisitions are not the only method of inorganic growth available to it. The REIT also develops properties in-house from its fairly sizable land bank.
INDT Q2 Presentation
While most of these developments are on spec (constructed without a tenant in place yet), demand for space in its chosen markets is so high that there is little doubt the space will be leased.
Moreover, the ability to develop is a major advantage at a time when cap rates for stabilized properties is around 4%. This year, INDT has purchased existing properties at cap rates of about 4% to 4.5%, while it has the ability to develop new properties from the ground up at projected cap rates of 6.1% to 6.6%. That two-point spread is tantamount to millions of dollars of value creation.
Taking into account ongoing development projects and the pipeline of likely acquisitions, INDT’s geographic diversification should expand in the coming quarters.
INDT Q2 Presentation
In some ways, INDT might be considered the East Coast version of REXR (although far smaller), which is concentrated on the West Coast and specifically Southern California.
Balance Sheet
Like the portfolio, INDT’s balance sheet exudes quality and strength. The REIT is too small to have a credit rating, but the balance sheet certainly exhibits investment grade characteristics.
Though debt to Q2 2022’s annualized EBITDA looks rather high at 7.6x, that is a function of portfolio turnover resulting in a large cash position that has not yet been reinvested. Cash currently sits at 12.5% of INDT’s market cap. Net debt to Q2’s annualized EBITDA is much lower at 4.1x.

INDT Q2 Presentation
Long-term debt to gross real estate assets (at cost) sits at 23%, while debt to enterprise value is a touch lower at 22%.
Aside from a short-term construction loan maturing in 2023, INDT has no debt maturities until 2027. And that construction loan, upon stabilization of the property in question with a lease, should easily be replaced with a mortgage or equity issuance.
High G&A Costs
The biggest red flag I see with INDT is the company’s high general & administrative costs, which investors might consider the management fee.
G&A as a percentage of total rental revenue was 23% in 1H 2022, falling slightly to 20% in Q2 2022. Compare that to the G&A to revenue percentages for PLD of about 6.5% and REXR of about 10%.
Admittedly, PLD and REXR are much larger than INDT and thus enjoy more economies of scale. But look even at Plymouth Industrial REIT (PLYM), which is only a little larger than INDT in market cap (~$815 million). PLYM’s G&A to revenue is about 9%. Likewise, LXP Industrial Trust (LXP), with a market cap a little under $3 billion, has a G&A to revenue of about 10.5%.
Over half of this high G&A comes from cash compensation of employees and executives. Cash compensation alone represented 13.8% of revenue in 1H 2022 (up from 11% in 1H 2021) and 13.3% in Q2 2022 (up from 11.3% in Q2 2021).
Perhaps the company’s development arm necessitates a larger team and thus more compensation expenses that are worth it due to the value creation that in-house development brings. Even so, G&A expenses and especially cash compensation strikes me as being too high.
Bottom Line
Despite high G&A costs (perhaps from an overpaid management team), INDT strikes me as a solid REIT with the balance sheet strength and portfolio quality to continue generating high single-digit to mid-teens AFFO per share growth for the foreseeable future.
The problem is that all of this optimism is amply reflected in the stock price, which even after a ~25% decline year-to-date still sports a 34x FFO multiple and 39x AFFO multiple. That is a pretty rich valuation even for a strong company!
I haven’t even mentioned the dividend yet. That is because the $0.64 annualized dividend comes out to a yield of 1.07%. The payout ratio is only ~41% of AFFO and ~36% of FFO, which leaves room for the dividend to grow from here at a slightly faster pace than AFFO per share.
Even so, it would take significant dividend growth (without accompanying multiple expansion) to produce a dividend yield that would catch most dividend growth investors’ attention.
INDT will be on my radar going forward, but I find other options in the industrial real estate space far more attractive. For example, STAG Industrial (STAG) may not have the same portfolio quality or growth rate as INDT, but its 14.6x core FFO multiple and 4.6% dividend yield are far more attractive to me than INDT’s 34x FFO multiple and 1% dividend yield.
Be the first to comment