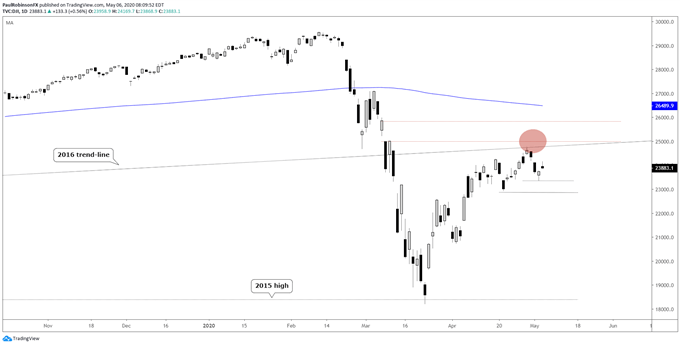
The Dow Jones recently pulled off from the underside of a trend-line from 2016 and has potential to post a lower-high if it can’t get into gear here soon. A breakdown below the Monday low at 23361 will give this idea some legs, with 22941 next up as support to watch. A drive higher won’t put the Dow in the clear should it do so, not only is there trend-line resistance from 2016, but also the gap from March 6/9. If US markets were to charge higher watch for any divergence that may develop between the Dow and S&P 500/Nasdaq 100. A higher high in the other indices without the Dow would be a solid warning sign, especially given the resistance it faces.

Recommended by Paul Robinson
Find Out the #1 Mistake Traders Make
Dow Jones Daily Chart (pulling off from 2016 trend-line)
Dow Jones Chart by TradingView
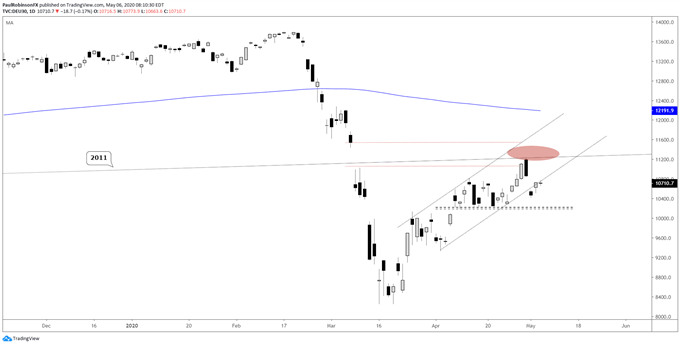
The DAX is not positioned real well here, with it having it hit its head on the underside of the 2011 trend-line and declining quickly after. The current bounce looks like it could result in a lower-high. If this is the case then support around 10200, which was tested numerous times for a couple of weeks last month, will become very pivotal to the outlook. A break below may quickly usher in a move towards 9550/350.


Recommended by Paul Robinson
Check out the mid-Q1 Equities update.
DAX Daily Chart (watch 10200 on selling)
To see all the charts we looked at, check out the video above…
Resources for Index & Commodity Traders
Whether you are a new or an experienced trader, DailyFX has several resources available to help you; indicator for tracking trader sentiment, quarterly trading forecasts, analytical and educational webinars held daily, and trading guides to help you improve trading performance.
We also have a series of guides for those looking to trade specific markets, such as the S&P 500, Dow, DAX, gold, silver, crude oil, and copper.
—Written by Paul Robinson, Market Analyst
You can follow Paul on Twitter at @PaulRobinsonFX


Be the first to comment