

BargotiPhotography
(This article was co-produced with Hoya Capital Real Estate.)
One of the decision points facing investors when constructing their portfolios is the question of active vs. passive investing.
In short, passive investing suggests that the best option for an investor is to simply to buy the market. As a result of trailblazing work by legends such as John C. (“Jack”) Bogle, founder of The Vanguard Group, low-cost index funds are now a staple of the investment landscape. As just two examples, for an ultra-low .03% expense ratio, Vanguard S&P 500 ETF (VOO) tracks the S&P 500 index, comprised of large-cap stocks. Vanguard Total Stock Market ETF (VTI) offers even more diversification, as a proxy for the entire investable U.S. market.
In contrast, active investing suggests that one can beat the market by investing in funds run by investment professionals that utilize some methodology to select subsets of stocks that prove superior to the overall market.
Following my last article, in which I reviewed ProShares S&P 500 Dividend Aristocrats ETF (NOBL), I decided to take a look at another ETF that offers an interesting approach in an attempt to offer market-beating returns. This is VanEck Morningstar Wide Moat ETF (BATS:MOAT).
Let’s start by digging into the very interesting approach taken by this fund, and the specific mechanics used to implement the approach. Following that, we will take a look at how this particular active approach has matched up against a passive approach over the past decade, as well as my personal outlook for the year or so ahead.
VanEck Morningstar Wide Moat ETF – Digging In
At this point in time, MOAT has established a solid track record that we can analyze. With an inception date of 4/24/2012, it is well into its 11th year of operation. VanEck’s webpage for the fund currently shows an assets under management (“AUM”) of $6.6 billion, a very solid number. It sports an expense ratio of .46%, and an average trading spread of .03%. In the opening of the article, I mentioned that VOO and VTI have expense ratios of a mere .03%. Further, due to the tremendous number of shares traded daily in these funds, their average trading spread is .01% or less.
So what are investors getting for their money, in terms of slightly higher ongoing expenses? As it turns out, an interesting method of selecting securities for inclusion.
As the aptly-named symbol for the exchange-traded fund (“ETF”) implies, MOAT is comprised of stocks that Morningstar’s research team determines to have wide moats.
In the old days, a literal moat was a deep and wide trench around a fortified place (such as a castle) that was usually filled with water. Typically combined with a rampart, or fortification wall, from the top of which soldiers could fire various forms of missiles, the goal was to make it extremely difficult for an enemy to breach the desired target.
Applied to investing, the goal is to find and invest in companies that have, as it were, a moat or barrier that makes it hard for challengers to compete with them. In a white paper, Morningstar lists its 5 sources of moat:
- Switching Costs – Switching costs give a company pricing power by locking customers into its unique ecosystem. Beyond the expense of moving, they can also be measured by the effort, time and psychological toll of switching to a competitor.
- Intangible Assets – Though not always easy to quantify, intangible assets may include brand recognition, patents and regulatory licenses. They may prevent competitors from duplicating products or allow a company to charge premium pricing.
- Network Effect – A network effect is present when the value of a product or service grows as its user base expands. Each additional customer increases the product’s or service’s value exponentially.
- Cost Advantage – Companies that are able to produce products or services at lower costs than competitors are often able to sell at the same price as competition and gather excess profit, or have the option to undercut competition.
- Efficient Scale – In a market limited in size, potential new competitors have little incentive to enter because doing so would lower the industry’s returns below the cost of capital.
Here is just one example from the above-linked white paper that really caught my eye, in terms of one of these “sources of moat” at work. The company in question is Stryker Corp. (SYK).
Here are Morningstar’s comments:
Stryker Corp. is a top-tier competitor in a number of medical markets. These include orthopedic implants, surgical equipment, endoscopy, and neurovascular devices. Since switching costs can be significant for surgeons when it comes to orthopedic implants, this is, according to Morningstar, one of Stryker’s “moatiest divisions” in support of the company’s wide economic moat. Morningstar adds, “Relative to other specialists, an orthopedic surgeon’s skill and experience can play an outsize role in the clinical outcome for the patient. These factors leave surgeons reluctant to train and master multiple instrumentation systems.” (Bold mine, for emphasis)
Other examples include Starbucks (SBUX), where Morningstar observes that the power of its “brand intangible asset” allows it to “generate excitement and traffic” while “spending less on marketing than category peers.”
In both cases, I think you see the point. Morningstar has identified something unique about the featured company that serves as a meaningful barrier impeding would-be competitors.
Let’s now talk a little about fund structure and mechanics. Once these “wide moat” stocks have been identified, Morningstar then ranks them to identify those trading at the lowest current market price to fair value ratios. Next, and similar to NOBL, MOAT takes an equal-weighting approach. As I commented in my recent review of NOBL, I am a fan of this approach at this particular point in time, when certain high-flying stocks have become very heavily weighted in funds that take a market-weighting approach.
Finally, an interesting approach is taken with respect to rebalancing. The index has a staggered rebalance in which it is divided into two sub-portfolios, each with 40 stocks. One sub-portfolio reconstitutes in December and June; the other in March and September. Effectively, then, a portion of the fund is updated every 3 months.
With that, let’s take a look at MOAT’s current Top 10 holdings.
MOAT: Top 10 Holdings (VanEck.com)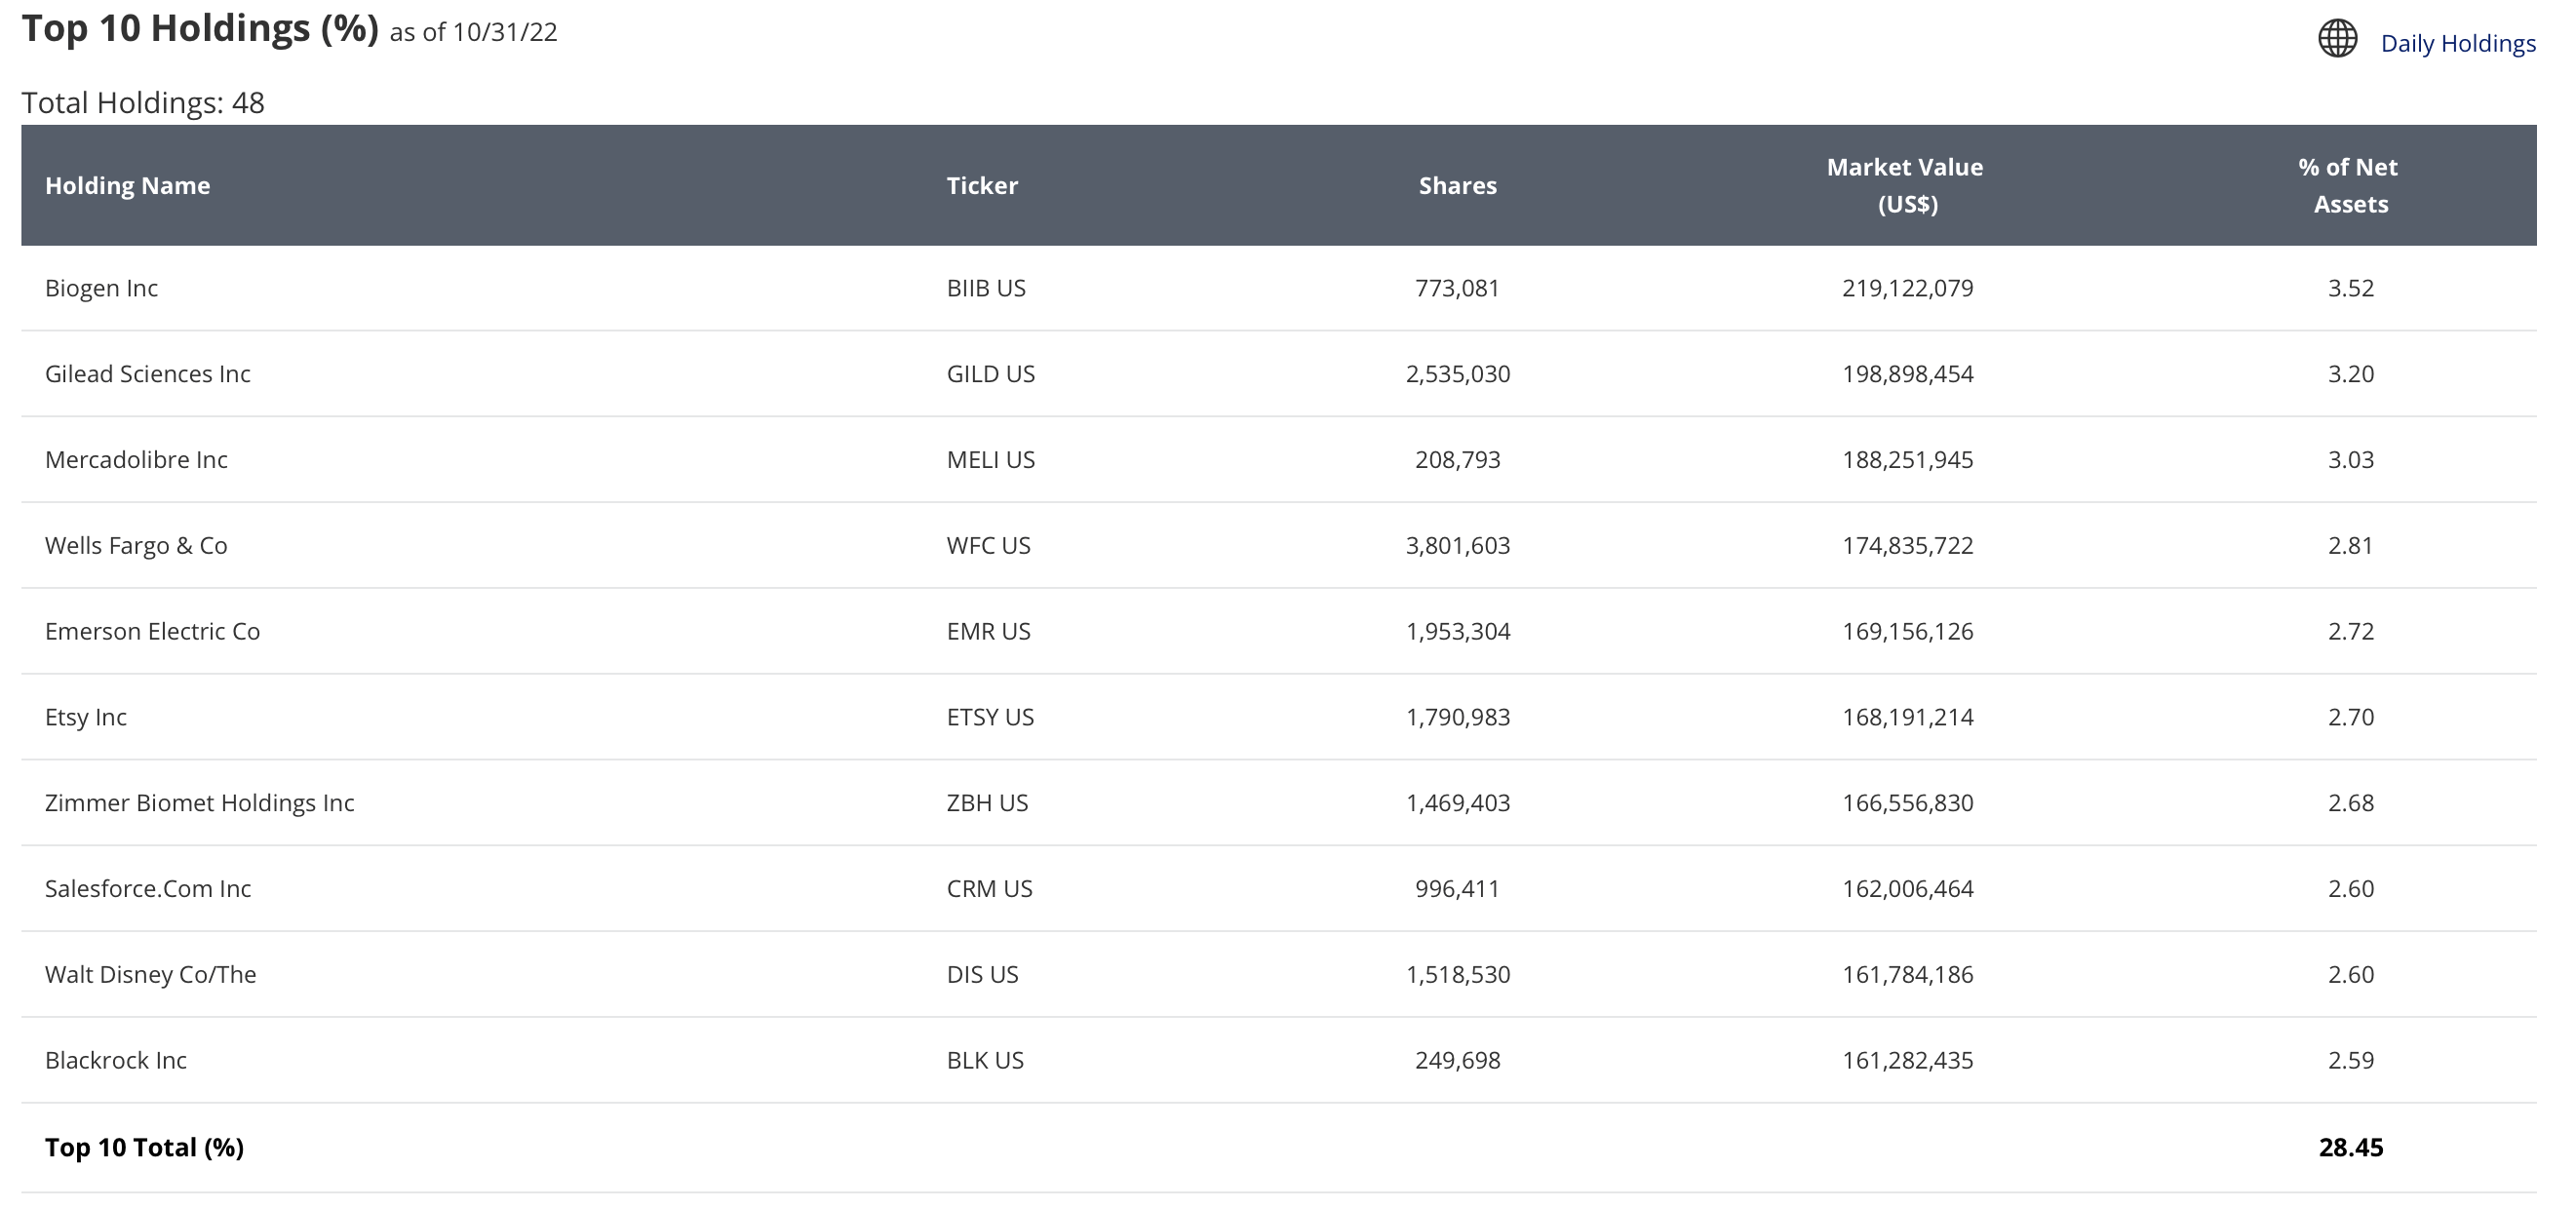
Currently, MOAT only has 48 holdings. Even so, this equal-weighting (at time of reconstitution) approach keeps the Top 10 holdings at a reasonable 28.45% of the fund.
In terms of sectors, here is where we stand at the moment.
MOAT: Sector Weightings (VanEck.com)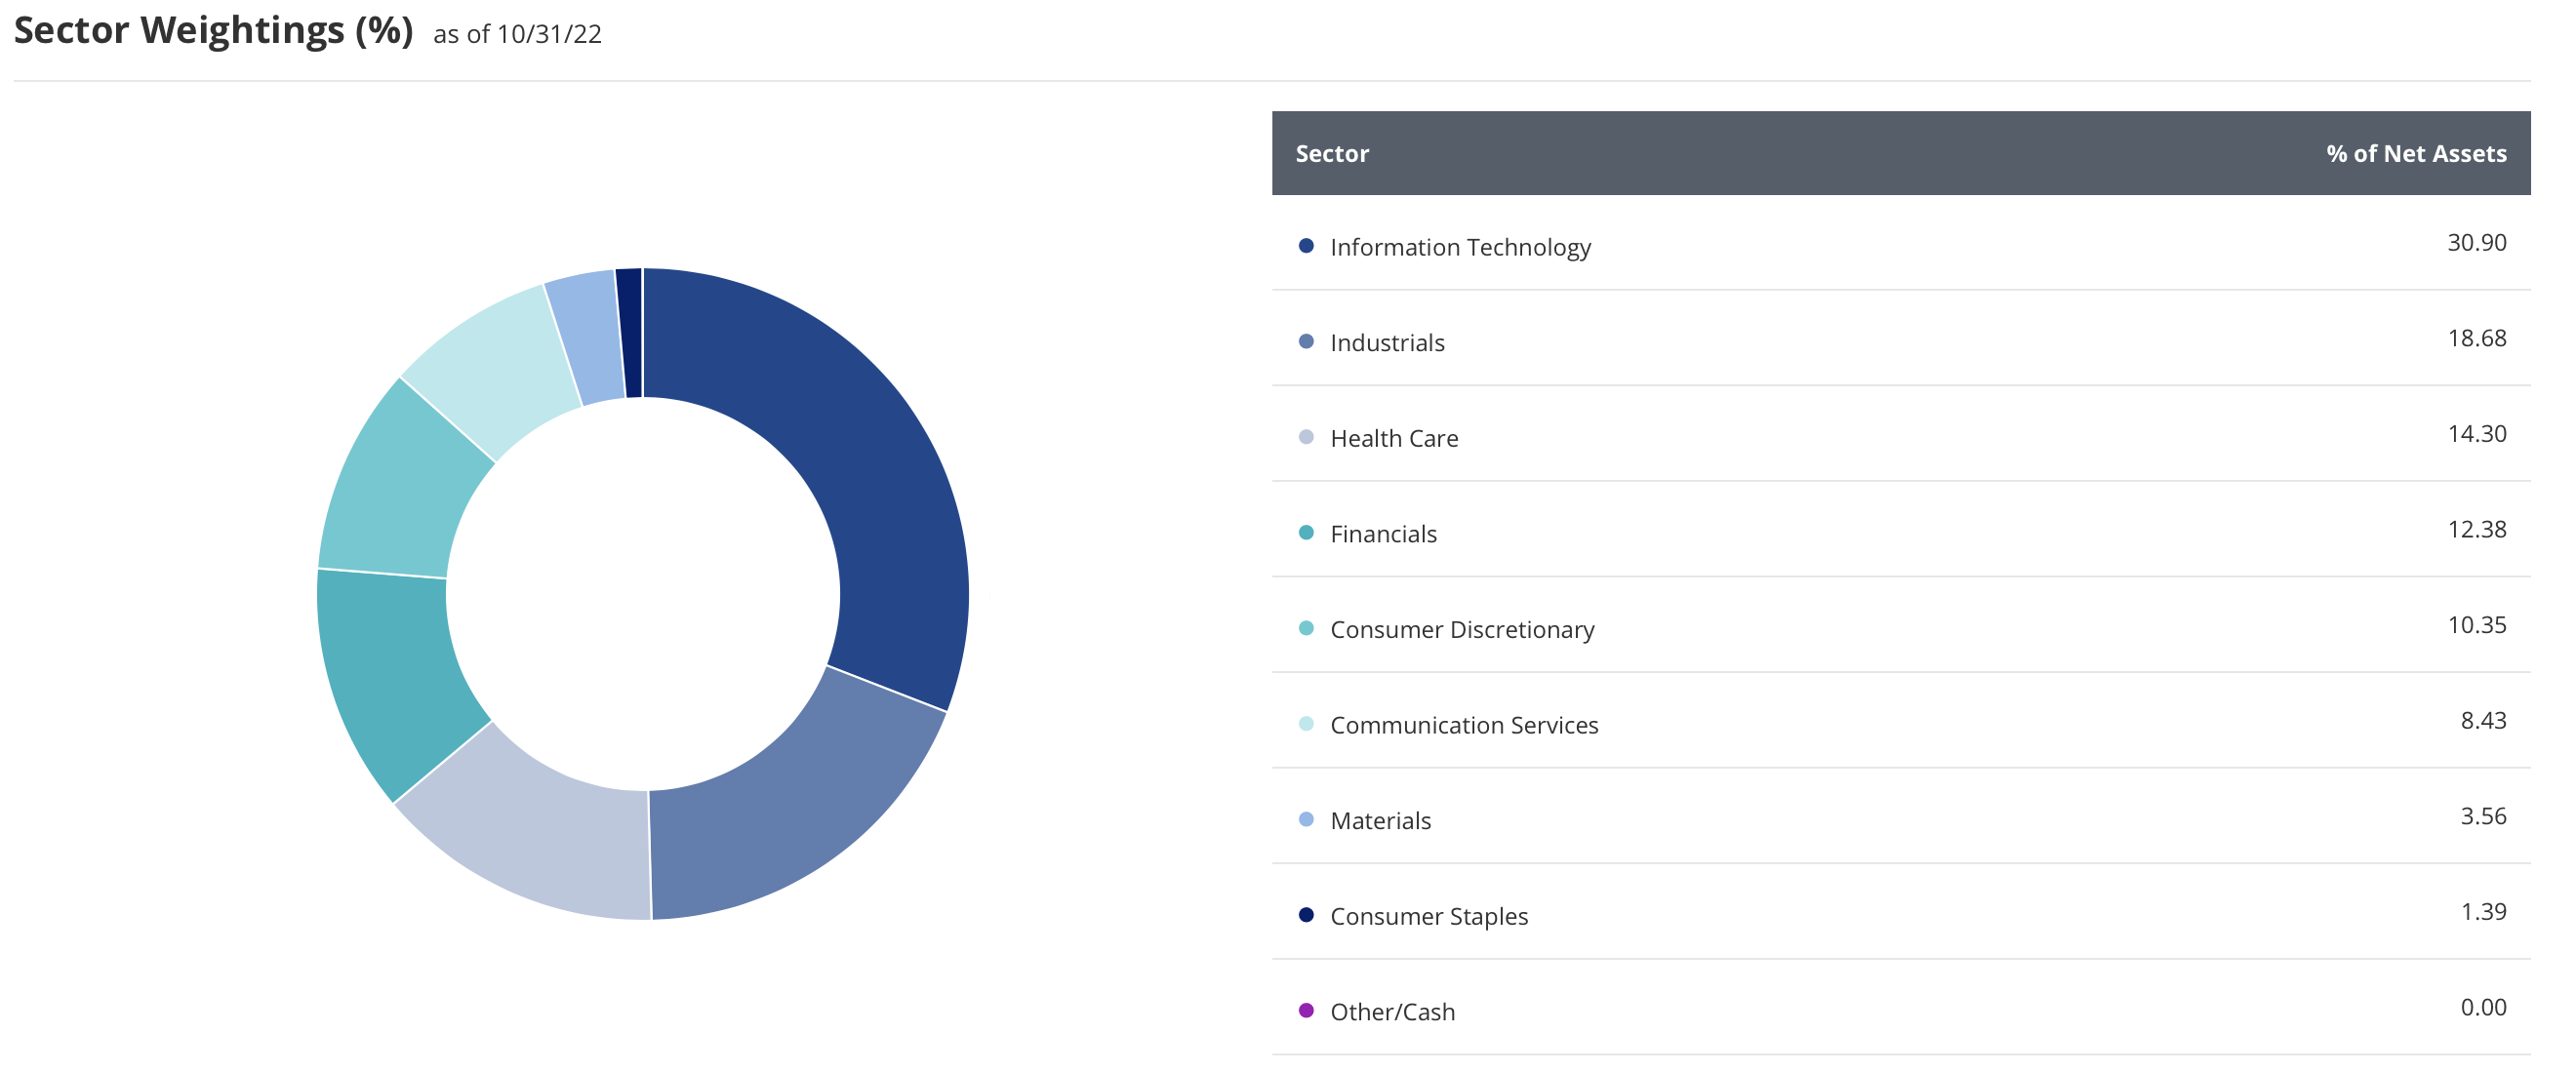
For now, please notice the heavy weighting in the Information Technology sector. I’ll get into that a little more in the next section.
To conclude this section, however, an observation. In terms of an active strategy, certainly this approach would seem one that could consistently outperform the market, would it not?
And Yet . . .
Before we go any further, here is something I always bear in mind when evaluating the question of selecting passive vs. active funds.
SP Global puts out annual scorecards commonly referred to as SPIVA (S&P Indices Versus Active funds). As the name implies, these scorecards measure the performance of active funds against benchmark indexes. To ensure the accuracy of the comparisons, as opposed to comparing all funds to, say, the S&P 500, funds are measured against the returns of a benchmark appropriate for that particular investment category. So, large-cap active funds are measured against a large-cap index, small-cap funds against a small-cap index, and so on.
Here is the 2022 exhibit for large-cap funds.
SPIVA Scorecard: Domestic Large-Cap Equity Funds (SP Global)
Interestingly, in terms of historical averages 2022 has actually been a good year for large-cap active funds, with “only” 51% underperforming the S&P 500 index. However, as can clearly be seen, over the past 20 years that number has averaged roughly 65%. In other words, roughly 2/3 of active large-cap funds have underperformed the S&P 500 index.
While the numbers vary slightly for other categories, in the biggest of pictures the results are consistent. The same report referenced above concludes its overview section with this statement.
[O]ver a 15-year horizon, more than 70% of actively managed funds failed to outperform their comparison index in 38 out of 39 categories.
As it happens, in spite of what would appear to be an ideal strategy for picking superior stocks, it turns out that this is also the case with MOAT.
Using Portfolio Visualizer, I was able to run a backtest comparing the performance of MOAT against both NOBL (as an example of another active strategy) and VOO, Vanguard’s ETF that tracks the S&P 500 index. The back-test covers the period between 2014-2022, limited by NOBL’s inception date. All dividends are tracked and reinvested.
MOAT vs NOBL vs VOO: 2014-2022 Backtest (PortfolioVisualizer.com)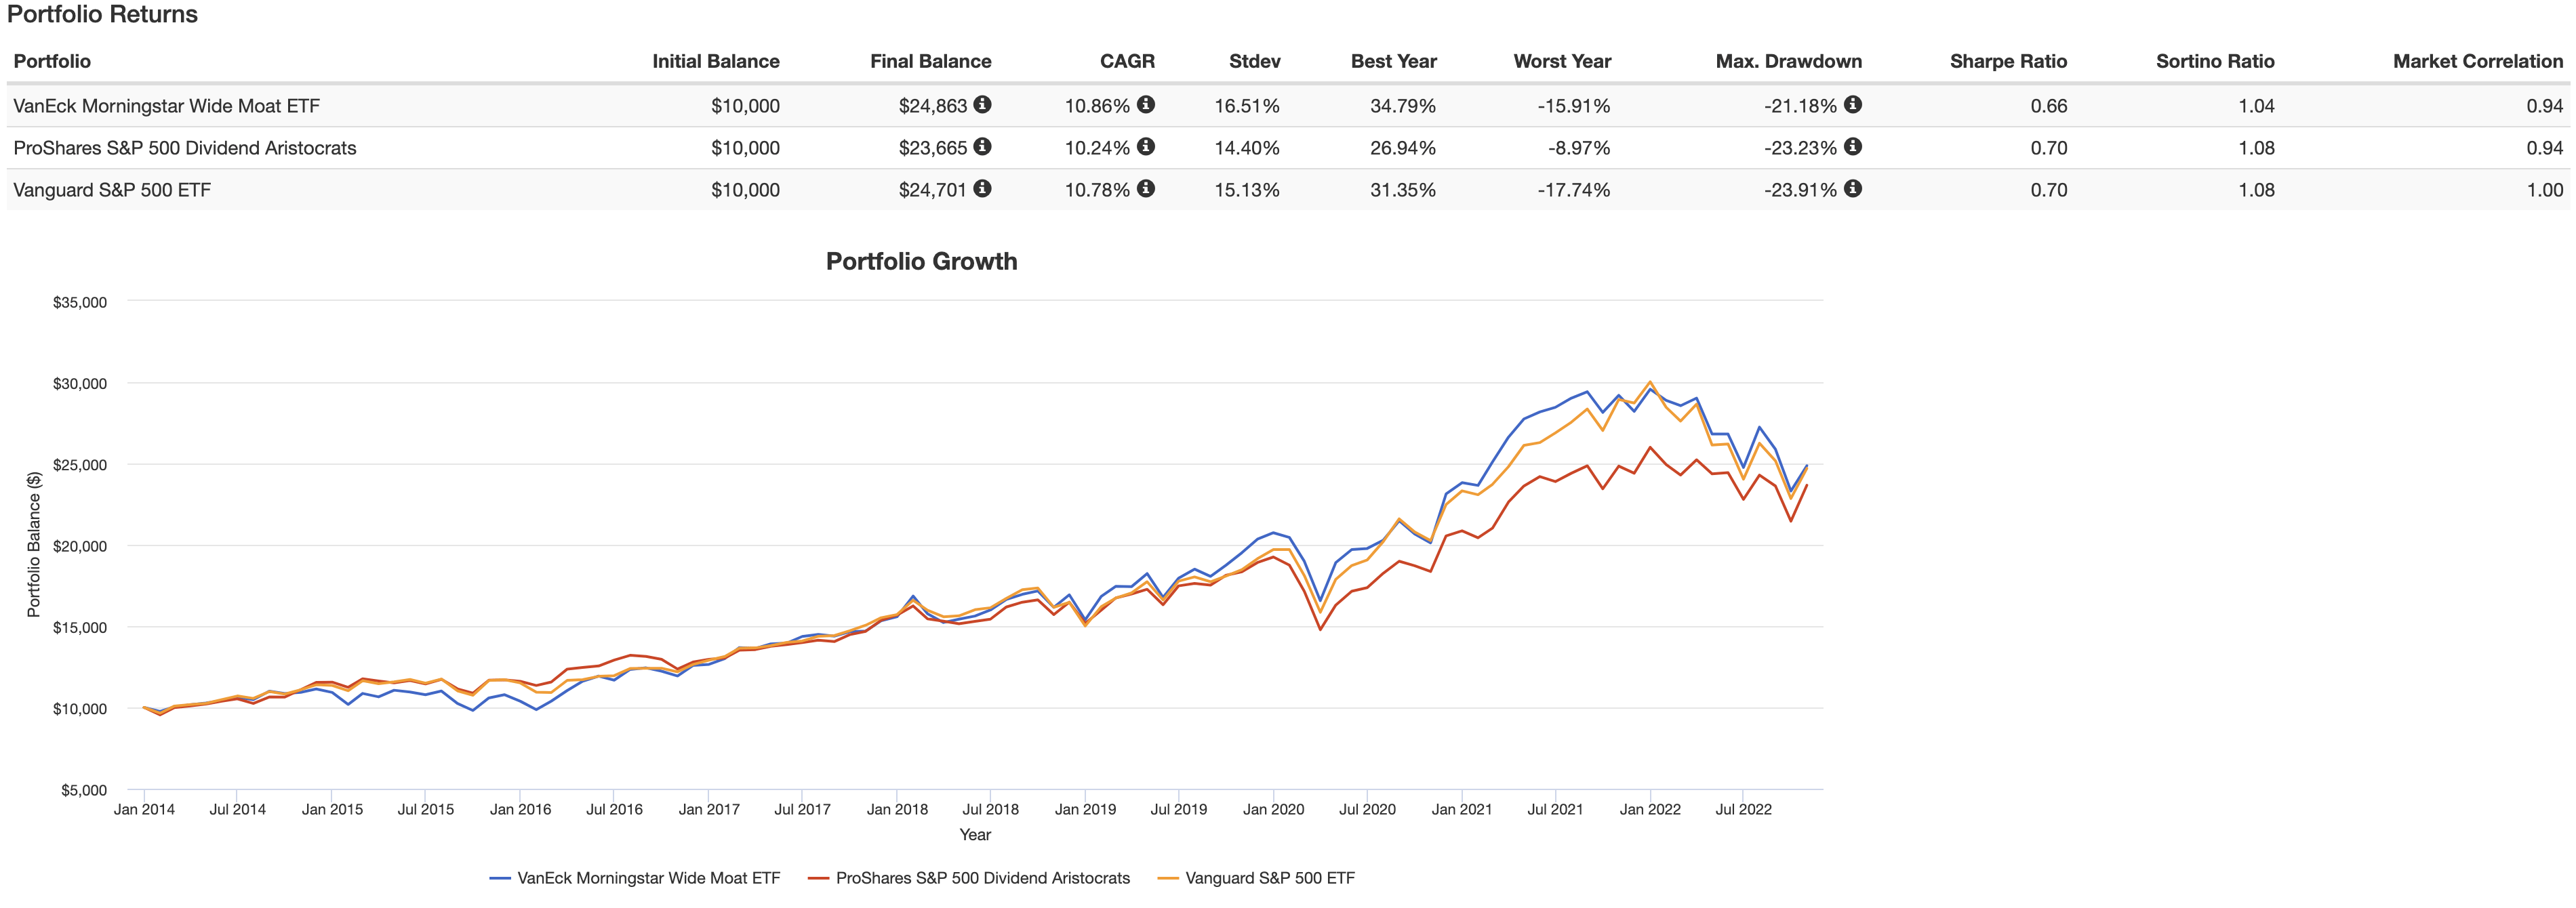
In short, while the results were extremely close over this period, both NOBL and VOO slightly edged out MOAT in terms of risk-adjusted return. Focusing on VOO, as this ultra-low-cost ETF tracks the S&P 500, we find the total return over this roughly 9-year span to be roughly the same as MOAT, but with slightly lower volatility.
And that brings me back to the title I selected for the article, namely that MOAT appears to be an interesting case study in the challenges of selecting an active ETF that will beat an index ETF over a lengthy period of time.
What, though, about the near term? Might MOAT’s unique structure prove advantageous over the next year or so, a period in which it appears almost certain we are in for a recession?
As I compare MOAT’s sector weightings in particular against those of the S&P 500, I am not convinced that this will prove to be the case. Let me feature just two sectors. At almost 31%, MOAT’s weighting in Information Technology exceeds VOO’s by almost 5%. Conversely, VOO carries weightings of roughly 7% in Consumer Staples and 3% in Utilities, sectors which are almost nonexistent in MOAT.
Given the Fed’s current expressed position of rates being “higher for longer,” I’m not sure the additional 5% weight of the Information Technology sector in MOAT will lead to it outperforming an S&P 500 ETF over the near term. As a consequence, I’m not sure why I would incur MOAT’s .45% expense ratio over VOO’s .03%. If anything, were I to try to play things conservatively over the next year, I might select NOBL over MOAT.
What do you think? I’d love to hear your thoughts, and even critique, in the comments section below.
Be the first to comment