


Sean Pavone
Earnings of Independent Bank Corp. (NASDAQ:INDB) will most probably continue to surge through the end of 2023. The interest rate hikes of 2022 will boost the net interest margin for next year. Further, subdued loan growth will offer some support for the bottom line. Overall, I’m expecting Independent Bank to report earnings of $5.63 per share for 2022, up 62%, and $6.44 per share for 2023, up 15% year-over-year. Compared to my last report on the company, I’ve increased my earnings estimates for both years mostly because I’ve raised the margin estimates following the third quarter’s surprisingly good performance. Next year’s target price suggests a moderate upside from the current market price. Therefore, I’m maintaining a hold rating on Independent Bank Corp.
This Year’s Rate Hike to Boost Earnings Next Year
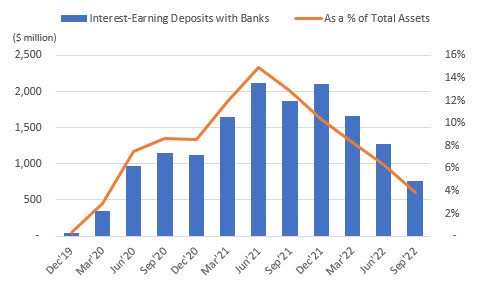
Independent Bank’s net interest margin surged by 37 basis points in the third quarter following the 18-basis points growth in the second quarter of this year. The third quarter’s performance beat my estimates given in my last report on the company. Part of the margin expansion was attributed to the deployment of excess cash into higher-yielding assets. The cash position is now almost back to normal; therefore, this factor will no longer contribute toward margin expansion in upcoming quarters.
SEC Filings, Author’s Calculations
Nevertheless, the margin outlook remains bright because of the 425 basis points fed funds rate hike this year and its lagged impact on the margin. Independent Bank’s loans are slower to reprice than the deposits; therefore, the margin stands to benefit more in the second year of a rate hike than the first year. The management’s interest rate simulation model shows that a 200-basis points hike in interest rates could boost the net interest income by 4.0% in the first year and 18.1% in the second year of the rate hike, as mentioned in the 10-Q filing.
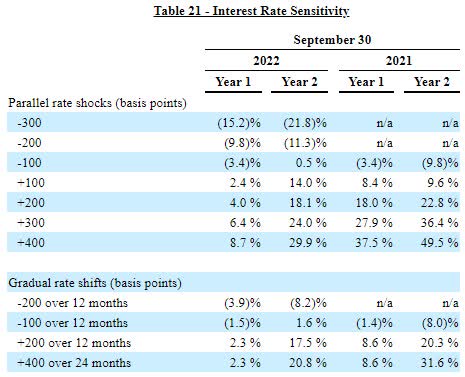
3Q 2022 10-Q Filing
Considering these factors, I’m expecting the margin to grow by 5 basis points in the last quarter of 2022 and 30 basis points in 2023. Compared to my last report on Independent Bank, I’ve raised my margin estimates for both years because of the third quarter’s performance which exceeded my previous expectations.
Revising Downwards the Loan Growth Estimate Following the Third Quarter’s Disappointing Performance
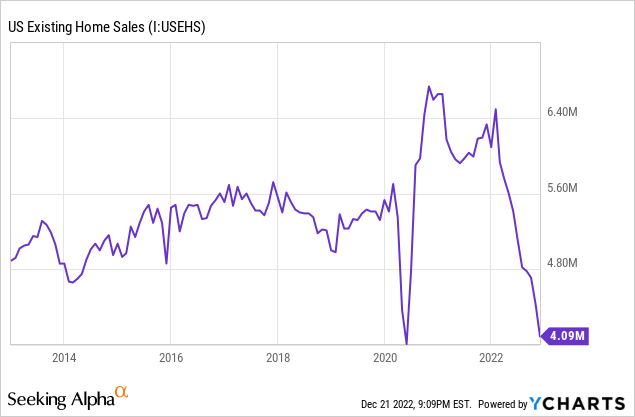
Independent Bank’s loan portfolio grew by only 0.2% in the third quarter, which missed my expectations. The outlook for residential mortgages and home equity loans is bleak due to the high interest-rate environment. Residential loans are an important focus area for Independent Bank as they made up 22% of total loans at the end of September 2022. Due to high-interest rates, U.S. home sales have plunged this year, as shown below.
However, the outlook for commercial loans remains positive. Independent Bank mostly operates in Massachusetts, whose existing economic activity is in a better condition than the national average.
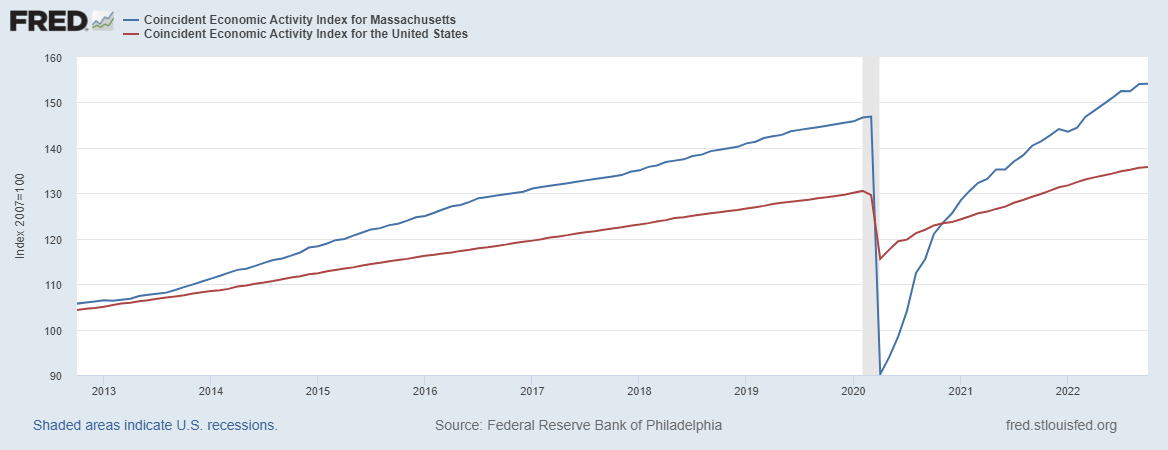
The Federal Reserve Bank of Philadelphia
Considering these factors, I’m expecting the loan book to grow by 0.75% in the last quarter of 2022, taking full-year growth to 1.6%. For 2023, I’m expecting the portfolio to grow by 3.0%. Compared to my last report on the company, I’ve reduced my loan growth estimates following the third quarter’s below-expected performance.
Meanwhile, I’m expecting deposits to grow somewhat in line with loans. The following table shows my balance sheet estimates.
| Financial Position | FY18 | FY19 | FY20 | FY21 | FY22E | FY23E |
| Net Loans | 6,842 | 8,806 | 9,279 | 13,440 | 13,655 | 14,069 |
| Growth of Net Loans | 8.7% | 28.7% | 5.4% | 44.8% | 1.6% | 3.0% |
| Securities | 1,075 | 1,275 | 2,348 | 4,789 | 3,935 | 4,015 |
| Deposits | 7,427 | 9,147 | 10,993 | 16,917 | 16,462 | 16,961 |
| Borrowings and Sub-Debt | 259 | 303 | 181 | 152 | 114 | 115 |
| Common equity | 1,073 | 1,708 | 1,703 | 3,018 | 2,563 | 2,558 |
| Book Value Per Share ($) | 38.8 | 49.7 | 51.5 | 74.8 | 55.9 | 55.8 |
| Tangible BVPS ($) | 29.0 | 34.1 | 35.5 | 49.6 | 33.8 | 33.7 |
| Source: SEC Filings, Author’s Estimates(In USD million unless otherwise specified) | ||||||
Expecting Earnings to Surge by 15%
The anticipated margin expansion and subdued loan growth will drive earnings through the end of 2023. On the other hand, heightened inflation will push up operating expenses, which will restrict earnings growth. Further, the tight labor market will boost salary expenses, which will also hurt the bottom line.
Meanwhile, I’m expecting the provisioning for expected loan losses to remain near a normal level. Non-performing loans were 0.41% of total loans, while allowances were 1.08% of total loans at the end of September 2022. Although this coverage is not high, it seems sufficient for a possible economic recession. Overall, I’m expecting the net provision expense to make up 0.06% of total loans in 2023, which is the same as the average for 2017 to 2019.
Considering these factors, I’m expecting Independent Bank to report earnings of $5.63 per share for 2022, up 62% year-over-year. For 2023, I’m expecting earnings to grow by 15% to $6.44 per share. The following table shows my income statement estimates.
| Income Statement | FY18 | FY19 | FY20 | FY21 | FY22E | FY23E |
| Net interest income | 298 | 393 | 368 | 402 | 607 | 686 |
| Provision for loan losses | 5 | 6 | 53 | 18 | 3 | 8 |
| Non-interest income | 89 | 115 | 111 | 106 | 111 | 108 |
| Non-interest expense | 226 | 284 | 274 | 333 | 373 | 398 |
| Net income – Common Sh. | 122 | 165 | 121 | 121 | 258 | 295 |
| EPS – Diluted ($) | 4.40 | 5.03 | 3.64 | 3.47 | 5.63 | 6.44 |
| Source: SEC Filings, Author’s Estimates(In USD million unless otherwise specified) | ||||||
In my last report on Independent Bank, I estimated earnings of $5.29 per share for 2022 and $5.81 per share for 2023. I’ve raised my earnings estimates mostly because I’ve increased my margin estimates.
My estimates are based on certain macroeconomic assumptions that may not come to fruition. Therefore, actual earnings can differ materially from my estimates.
Maintaining a Hold Rating
Independent Bank is offering a dividend yield of 2.6% at the current quarterly dividend rate of $0.55 per share. The earnings and dividend estimates suggest a payout ratio of 34% for 2023, which is below the five-year average of 43%. As Independent Bank has only recently increased its quarterly dividend, I’m not expecting another dividend hike in 2023.
I’m using the historical price-to-tangible book (“P/TB”) and price-to-earnings (“P/E”) multiples to value Independent Bank. The stock has traded at an average P/TB ratio of 1.92 in the past, as shown below.
| FY19 | FY20 | FY21 | Average | |||
| Tangible BVPS ($) | 34.1 | 35.5 | 49.6 | |||
| Average Market Price ($) | 77.8 | 66.4 | 80.0 | |||
| Historical P/E | 2.3x | 1.9x | 1.6x | 1.9x | ||
| Source: Company Financials, Yahoo Finance, Author’s Estimates | ||||||
Multiplying the average P/TB multiple with the forecast tangible book value per share of $33.7 gives a target price of $64.8 for the end of 2023. This price target implies a 23.5% downside from the December 21 closing price. The following table shows the sensitivity of the target price to the P/TB ratio.
| P/TB Multiple | 1.72x | 1.82x | 1.92x | 2.02x | 2.12x |
| TBVPS – Dec 2023 ($) | 33.7 | 33.7 | 33.7 | 33.7 | 33.7 |
| Target Price ($) | 58.1 | 61.4 | 64.8 | 68.2 | 71.5 |
| Market Price ($) | 84.7 | 84.7 | 84.7 | 84.7 | 84.7 |
| Upside/(Downside) | (31.5)% | (27.5)% | (23.5)% | (19.5)% | (15.5)% |
| Source: Author’s Estimates |
The stock has traded at an average P/E ratio of around 18.9x in the past, as shown below.
| FY19 | FY20 | FY21 | Average | |||
| Earnings per Share ($) | 5.03 | 3.64 | 3.47 | |||
| Average Market Price ($) | 77.8 | 66.4 | 80.0 | |||
| Historical P/E | 15.5x | 18.2x | 23.1x | 18.9x | ||
| Source: Company Financials, Yahoo Finance, Author’s Estimates | ||||||
Multiplying the average P/E multiple with the forecast earnings per share of $6.44 gives a target price of $121.9 for the end of 2023. This price target implies a 44.0% upside from the December 21 closing price. The following table shows the sensitivity of the target price to the P/E ratio.
| P/E Multiple | 16.9x | 17.9x | 18.9x | 19.9x | 20.9x |
| EPS 2023 ($) | 6.44 | 6.44 | 6.44 | 6.44 | 6.44 |
| Target Price ($) | 109.0 | 115.5 | 121.9 | 128.4 | 134.8 |
| Market Price ($) | 84.7 | 84.7 | 84.7 | 84.7 | 84.7 |
| Upside/(Downside) | 28.7% | 36.4% | 44.0% | 51.6% | 59.2% |
| Source: Author’s Estimates |
Equally weighting the target prices from the two valuation methods gives a combined target price of $93.4, which implies a 10.2% upside from the current market price. Adding the forward dividend yield gives a total expected return of 12.8%. In my opinion, this return is not high enough; therefore, I’m maintaining a hold rating on Independent Bank.
Be the first to comment