

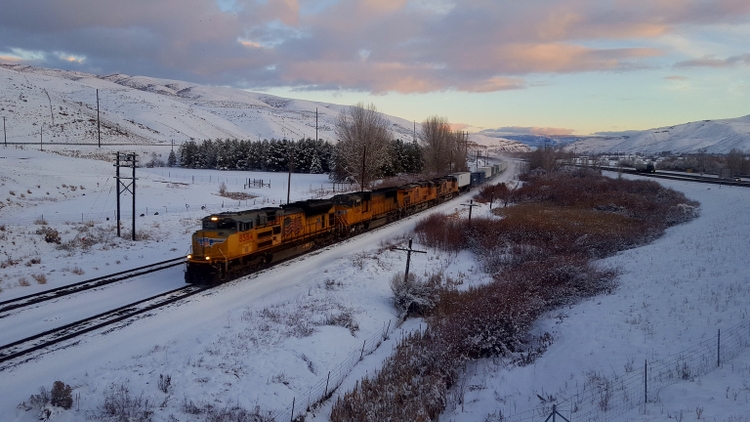
Kathleen Dallmann/iStock via Getty Images
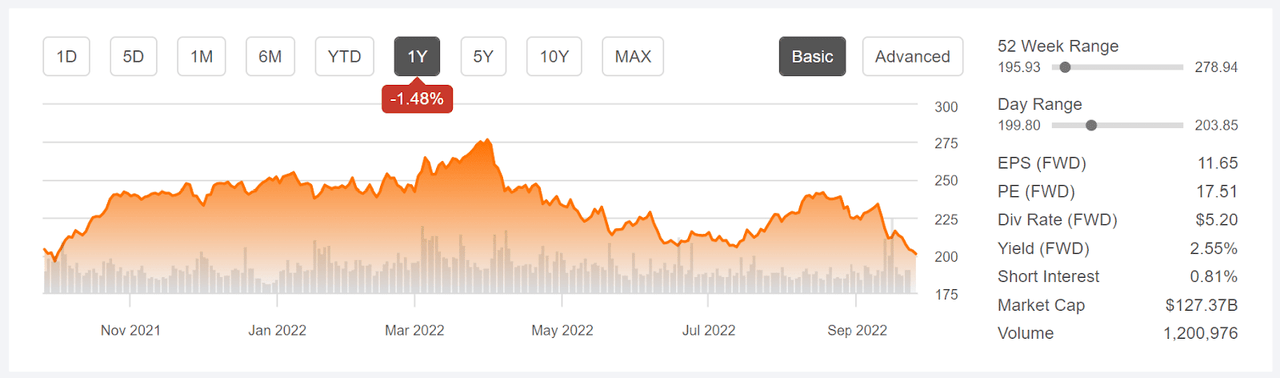
Union Pacific (NYSE:UNP) closed at a 12-month high of $276.69 on March 30, but has since declined 27% to reach the current share price, $201.43. UNP’s YTD and 12-month total returns are -17.5% and +3.6%, respectively, as compared to -21.6% and -15.7% for the S&P 500 (SPY) over the same periods. After bouncing off the YTD lows, the shares have been in decline since mid August, in tandem with the broad sell-off in the S&P 500 over the same period. UNP has also had some negative news over the month or so, which has exacerbated the decline. First, ongoing labor disputes increased the potential for a strike, although a tentative agreement has been reached. Second, UNP was downgraded by Bernstein because of risks associated with inflation. Third, U.S. weekly railroad traffic was reported to have dropped by 2.9% YoY for the week ending Sept. 17. The YTD U.S. rail traffic was down 2.7% as compared to the same period in 2021.
Seeking Alpha
12-Month price history and basic statistics for UNP (Source: Seeking Alpha)
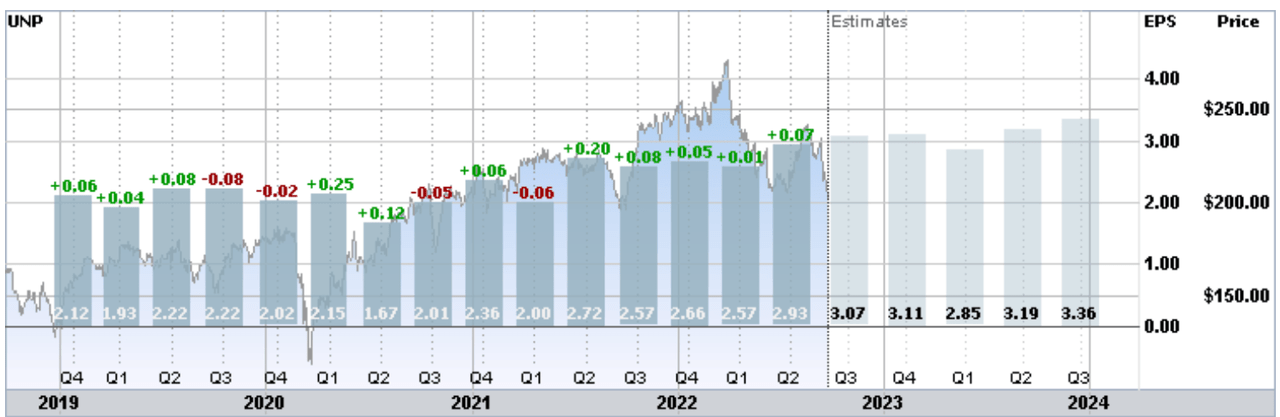
Even with the declines in rail traffic, UNP’s quarterly earnings have held up so far and the outlook is for continued growth. The consensus outlook is for 10.2% compounded EPS growth over the next three to five years. This is especially notable because U.S. rail traffic has been in decline over the past decade.
ETrade
Historical (4 years) and estimated future quarterly EPS for UNP. Green (red) values are amounts by which EPS beat (missed) the consensus expected value (Source: ETrade)
With the share price declines and growing earnings, UNP’s forward P/E of 17.5 looks more attractive than the P/E from my previous analysis. The TTM P/E, 19.0, is well below the value from January, although the shares continue to look expensive on the basis of a range of measures (Seeking Alpha’s valuation grade is a D). Even so, with a 2.55% forward dividend yield and annualized EPS growth rates of 12%, 15.4%, and 15.3% over the past three, five, and 10 years, respectively, the income potential from UNP is substantial.
I last wrote about UNP on Jan. 18, 2022, at which time I was bullish on UNP to the middle of 2022 but neutral for the full year. At that time, the company had delivered a series of quarters of robust growth and rail volume was still increasing. My main concern was the valuation. With a TTM P/E of 26.5, UNP was well above the historical range. The Wall Street consensus rating for UNP was a buy, and the consensus price target implied a total return of 7.65% over the next 12 months. Along with looking at fundamentals and the Wall Street consensus, I also rely on the consensus view among buyers and sellers of options, the market-implied outlook. In mid January, the market-implied outlook was bullish to mid-year but neutral out to mid-January of 2023. The expected volatility, one of the outputs from the market-implied outlook calculations, ranged from 24% (annualized) for the shorter-term outlook to 27% for the full year. As a rule of thumb for a buy rating, I want to see an expected 12-month total return that is at least ½ the expected annualized volatility. Taking the Wall Street consensus price target at face value, UNP fell well below this threshold (7.65% / 24% = 32%). I maintained my overall neutral / hold rating on UNP. Since this post, UNP has returned a total of -14.0% vs. -18.7% for the S&P 500 (SPY).
For readers who are unfamiliar with the market-implied outlook, a brief explanation is needed. The price of an option on a stock is largely determined by the market’s consensus estimate of the probability that the stock price will rise above (call option) or fall below (put option) a specific level (the option strike price) between now and when the option expires. By analyzing the prices of call and put options at a range of strike prices, all with the same expiration date, it’s possible to calculate a probabilistic price forecast that reconciles the options prices. This is the market-implied outlook. For a deeper explanation and background, I recommend this monograph published by the CFA Institute.
With about eight months since my last analysis of UNP, I have calculated updated market-implied outlooks and I have compared these with the current Wall Street consensus outlook in revisiting my overall rating.
Wall Street Consensus Outlook for UNP
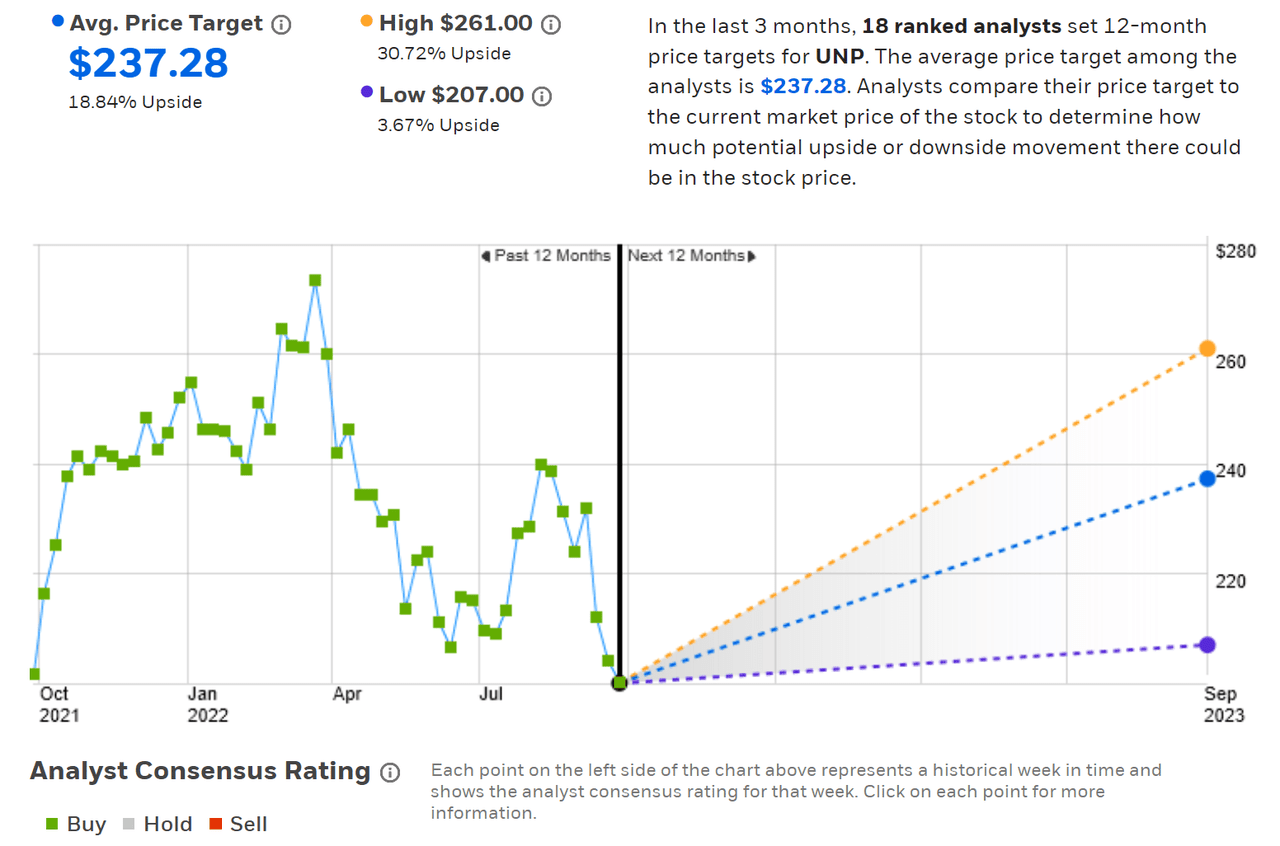
ETrade calculates the Wall Street consensus outlook for UNP by aggregating ratings and price targets from 18 ranked analysts who have published opinions over the past three months. The consensus rating is a buy, as it has been for all of the past year, and the consensus 12-month price target is 18.8% above the current share price. The 12-month price target is somewhat lower than it was back in January, $264.81, but the share price declines have boosted the expected return implied by the consensus price target. The range of individual price targets is relatively tight, increasing confidence in the predictive value of the consensus.
ETrade
Wall Street analyst consensus rating and 12-month price target for UNP (Source: ETrade)
Seeking Alpha’s version of the Wall Street consensus outlook is calculated using the views of 29 analysts who have published ratings and price targets over the past 90 days. The consensus rating is a buy and the consensus 12-month price target is 20.0% above the current share price.
Seeking Alpha
Wall Street analyst consensus rating and 12-month price target for UNP (Source: Seeking Alpha)
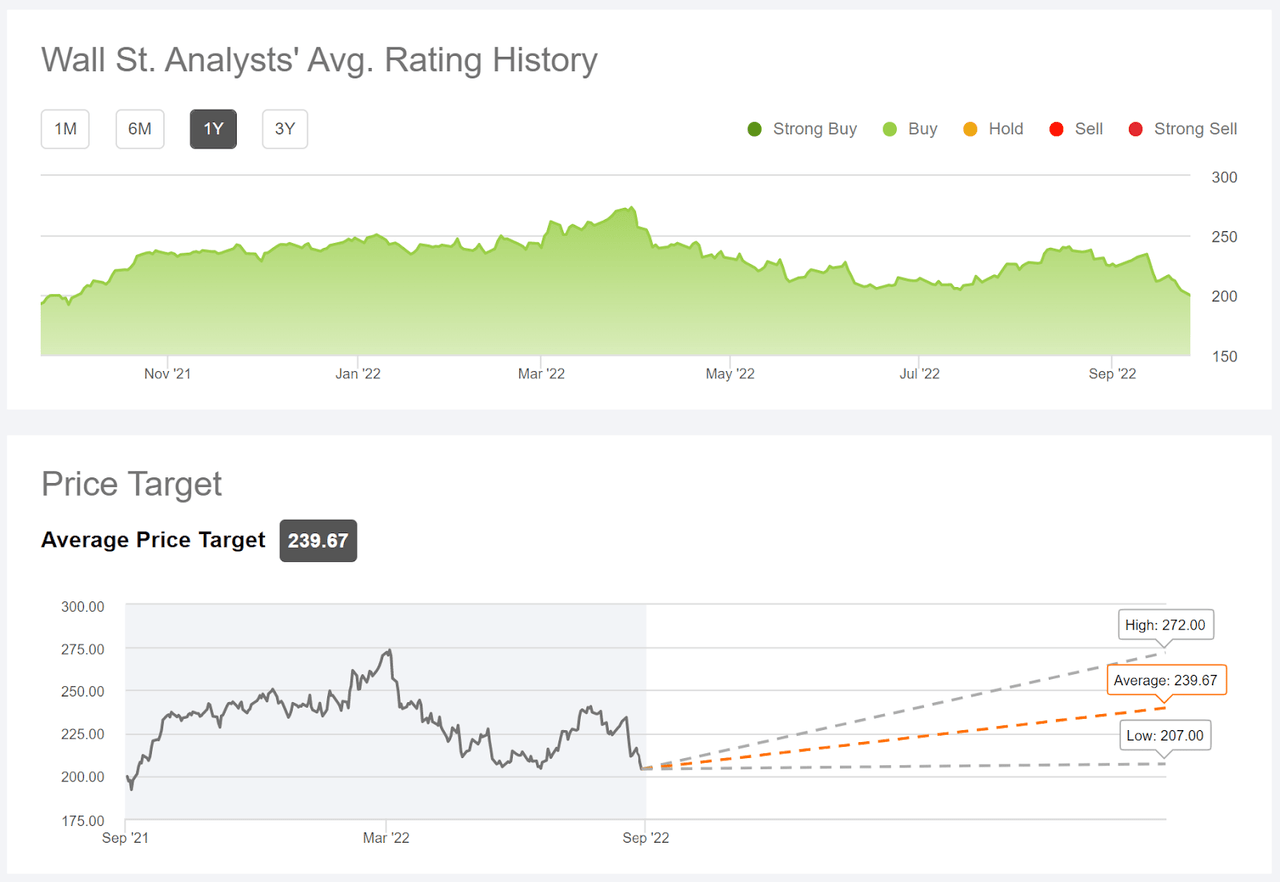
While the average analyst rating on UNP has fallen substantially since early 2022, the average rating remains slightly higher than it was three years ago.
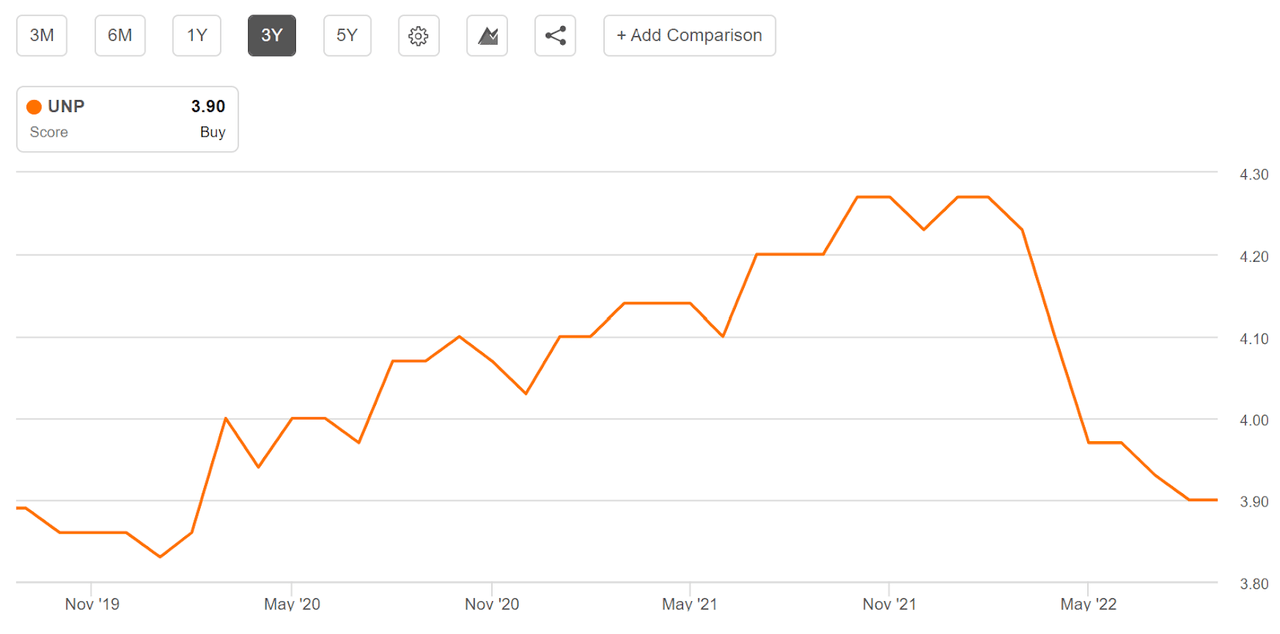
Seeking Alpha
3-Year history for average analyst rating on UNP (Source: Seeking Alpha)
The Seeking Alpha and ETrade calculations of the Wall Street consensus outlook are very similar, consistent with a fairly high level of agreement between analysts. The consensus rating continues to be a buy, as it has been for years. The consensus 12-month price target implies a total return of 22% over the next year, far higher than consensus expected return from mid-January, 7.65%.
Market-Implied Outlook for UNP
I have calculated the market-implied outlook for UNP for the 3.8-month period from now until Jan. 20, 2023, and for the 8.6-month period from now until June 16, 2023, using the prices of call and put options that expire on these dates. I selected these two dates to provide a view to the start and middle of 2023, as well as because the options expiring in January and June tend to be among the most liquid.
The standard presentation of the market-implied outlook is a probability distribution of price return, with probability on the vertical axis and return on the horizontal.
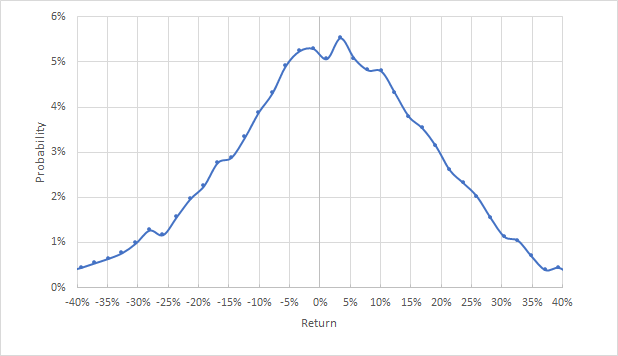
Geoff Considine
Market-implied price return probabilities for UNP for the 3.8-month period from now until January 20, 2023 (Source: Author’s calculations using options quotes from ETrade)
At first glance, the market-implied outlook to Jan. 20, 2023, looks symmetric, with comparable probabilities of positive and negative returns of the same size. Closer inspection shows that the probabilities of positive returns tend to be some elevated. Compare, for example, the probabilities associated with a return of +10% or +15% to those for returns of -10% or -15%. The expected volatility calculated from this distribution is 33% (annualized), considerably higher than the expected volatility from back in January. This is not surprising, given rising uncertainties and risks associated with labor issues, fuel prices, and falling rail volumes.
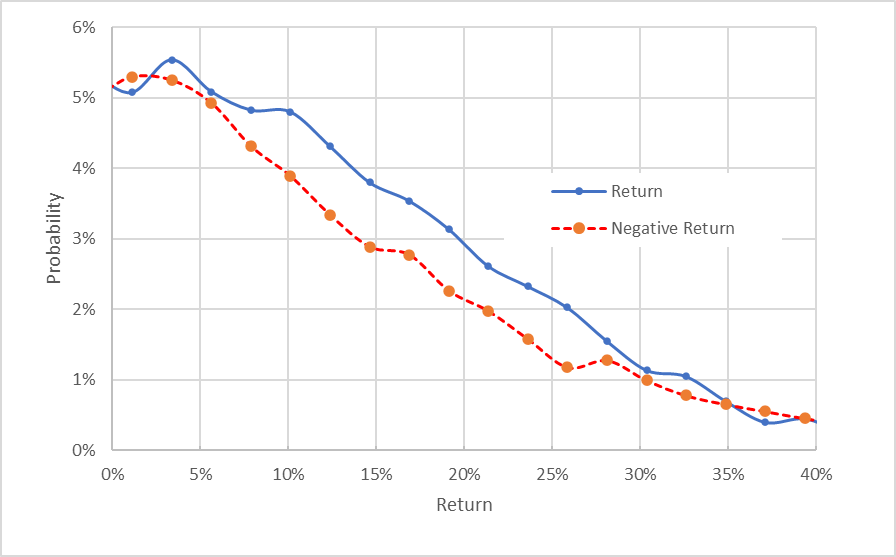
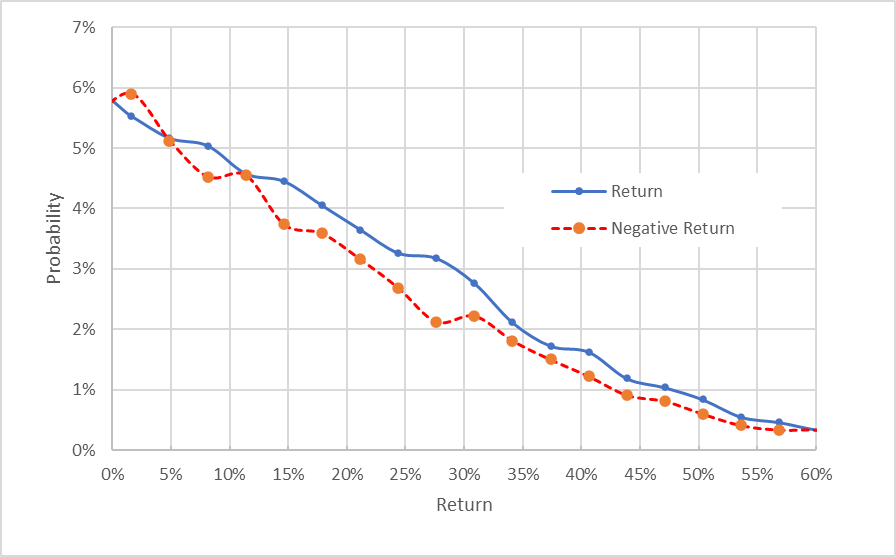
To make it easier to compare the relative probabilities of positive and negative returns, I rotate the negative return side of the distribution about the vertical axis (see chart below).
Geoff Considine
Market-implied price return probabilities for UNP for the 3.8-month period from now until January 20, 2023. The negative return side of the distribution has been rotated about the vertical axis (Source: Author’s calculations using options quotes from ETrade)
This view really highlights that the probabilities of positive returns are consistently elevated as compared to those for negative returns, across a wide range of outcomes (the solid blue line is well above the dashed red live over almost the entirety of the chart above).
Theory indicates that the market-implied outlook is expected to have a negative bias because investors, in aggregate, are risk averse and thus tend to pay more than fair value for downside protection. There’s no way to measure the magnitude of this bias, or whether it is even present, however. The expectation of a negative bias reinforces the bullish interpretation of this outlook.
The 8.6-month market-implied outlook, calculated with options that expire on June 16, 2023, also is bullish, although the bullish tilt in probabilities is less pronounced than for the shorter-term outlook. The expected volatility calculated from this distribution is 32%.
Geoff Considine
Market-implied price return probabilities for UNP for the 8.6-month period from now until June 16, 2023. The negative return side of the distribution has been rotated about the vertical axis (Source: Author’s calculations using options quotes from ETrade)
The market-implied outlooks tell a consistent story, with a bullish tilt over the next 3.8- and 8.6-month periods and volatility of 32% to 33%. The overall view from the market-implied outlook is more favorable than it was back in January, albeit with somewhat higher expected volatility.
Summary
UNP shares hit a 12-month high in late March, boosted by strong earnings growth coming out of COVID and high rail volumes in 2021. The valuation reached a concerningly high level. Since then, the shares have fallen even as the company has continued to turn in solid quarterly results. Economic turmoil that has rattled the overall equity market also put downward pressure on UNP shares. UNP’s valuation has improved considerably, although the shares are certainly not cheap at current levels. The Wall Street consensus rating for UNP is a buy, with a consensus 12-month price target that corresponds to a 22% total return over the next year. As a rule of thumb for a buy rating, I want to see an expected return that’s at least ½ the expected volatility. Taking the Wall Street consensus price target at face value, UNP is well above ½ the expected volatility calculated from the market-implied outlook (32%-33%). The market-implied outlooks for UNP are bullish to January and to June of 2023. Rail transport will continue to be critical infrastructure and UNP management has done a credible job of managing the challenges in recent years. I’m raising my rating on UNP from neutral / hold to a buy.
Be the first to comment