

syahrir maulana
Thesis
This is an update on an article I wrote about half a year ago (published on Jun. 15, 2022). The article’s title, “IJR And IWM: Small-Cap Is The Most Attractive Sector Now”, already gave away the key thesis. And indeed, both the iShares Core S&P Small-Cap ETF (NYSEARCA:IJR) and the iShares Russell 2000 ETF (NYSEARCA:IWM) have delivered positive returns and outperformed the overall market since then. To wit, IJR has returned a total of 7.8% (including price appreciation and dividends) since then and IWM returned 8.1%, compared to a 5.11% total return from the S&P 500 represented by the SPDR S&P 500 ETF Trust (SPY).
This update is updated by the new technical and fundamental signs for both funds that I am seeing now. The thesis is that I see these small caps funds are now better poised to outperform large caps in the next few years. Technically, IJR has suffered less severe correction YTD compared to large caps. And both IJR and IWM are rebounding harder than large caps as you can see from the chart below. IJR suffered a total correction of 15.54% YTD, compared to SPY’s 14.8% (while IWM suffered a larger correction of 21.9%). And yesterday, when the new CPI data showed a cooling of inflation to 7.7% in October, both funds enjoyed a much strong rebound than large caps. IJR surged 5.89% in one day and IWM surged 6.16%, compared to SPY’s 5.50%.
The remainder of this article will elaborate on the fundamental reasons for my bullish view of these funds.
Seeking Alpha data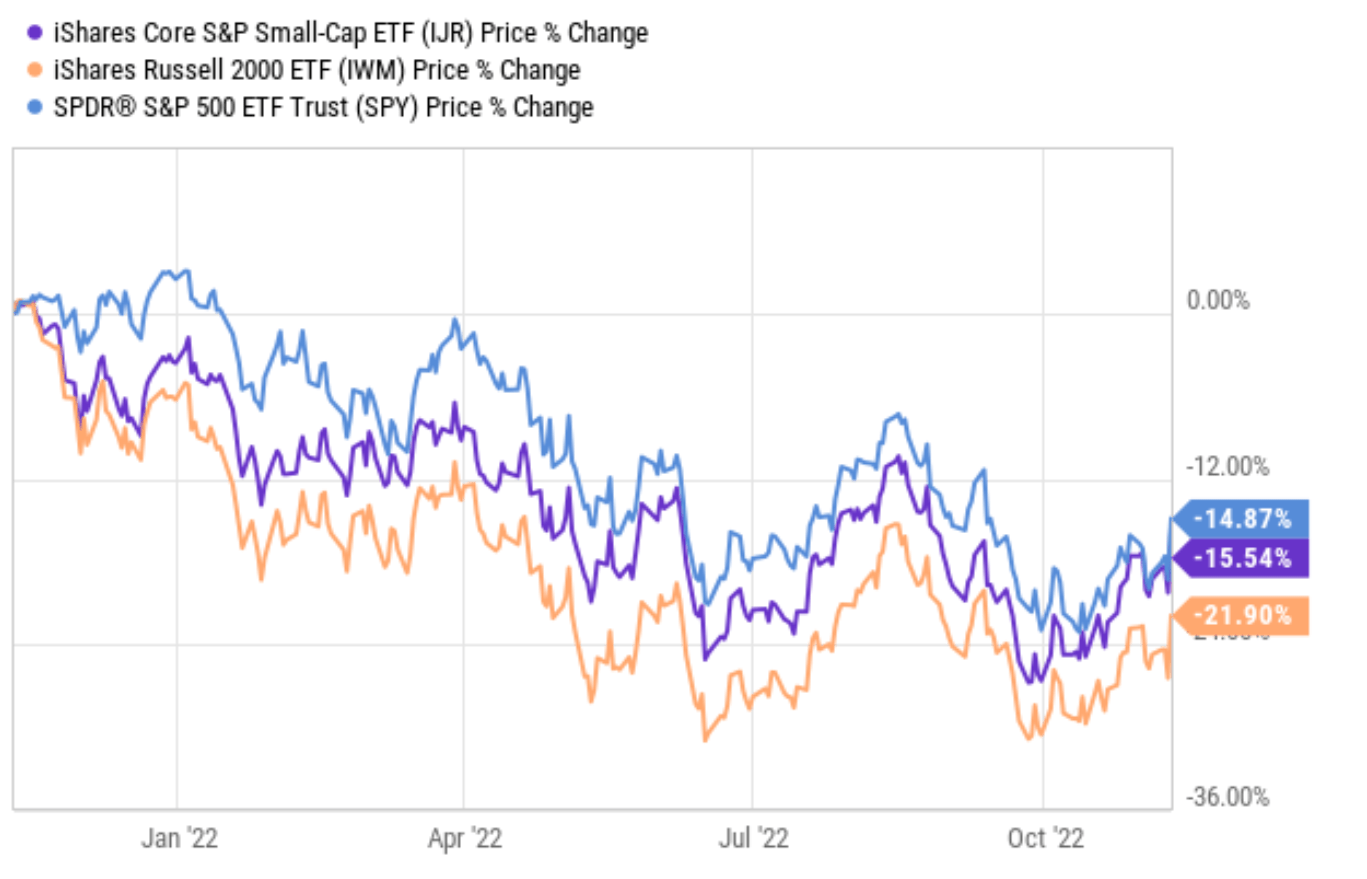
IWM and IJR: A quick introduction
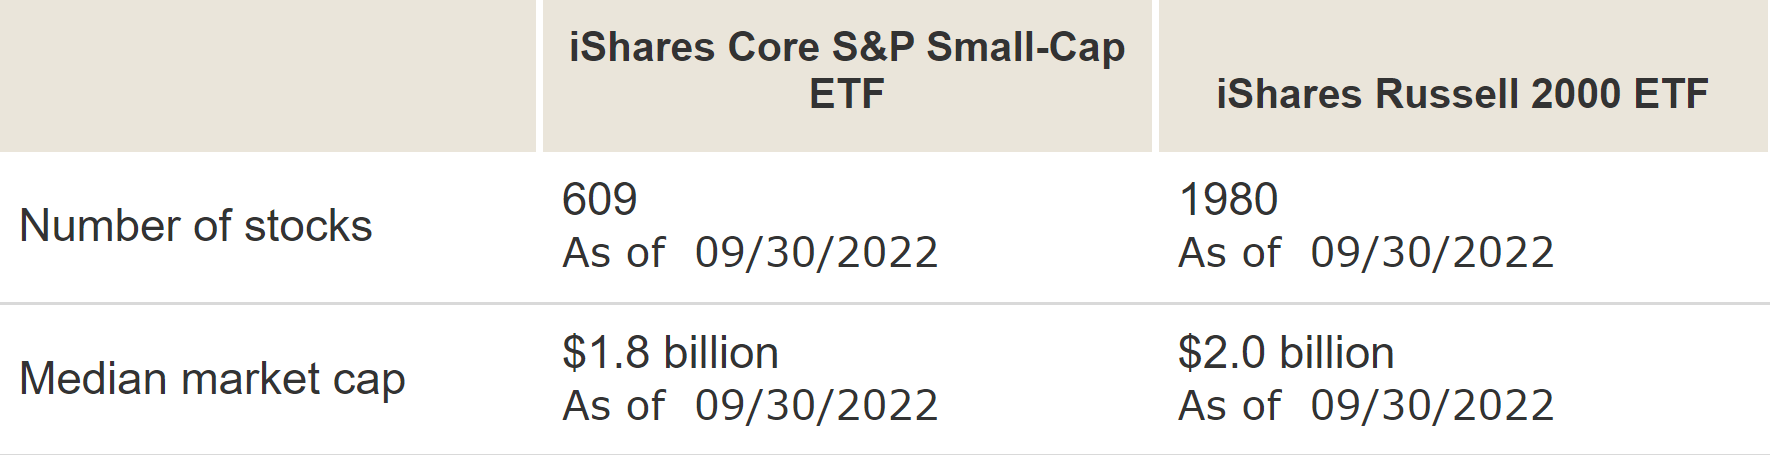
Let me first introduce both funds briefly in case some readers are new to them. Both IWM and IJR are popular funds from the iShares family, and both funds target small-cap stocks, as you can tell from their median market cap. The median market cap is only $1.8 billion for the holdings in IJR and about $2.0 for IWM. IJR is the larger one among these two, with an AUM of $59.0B (vs IWM’s AUM of $47.6B). In terms of fees, IJR’s expense ratio is only 0.06%, far below IWM’s 0.19%, a key that made us favor IJR over IWM. More fundamentally, IJR is indexed on the S&P SmallCap 600, and therefore it holds about ~600 stocks (609 to be exact). While IWM is indexed on the Russell 2000 Index and therefore holds ~2000 stocks (1980 to be exact).
Vanguard data Vanguard data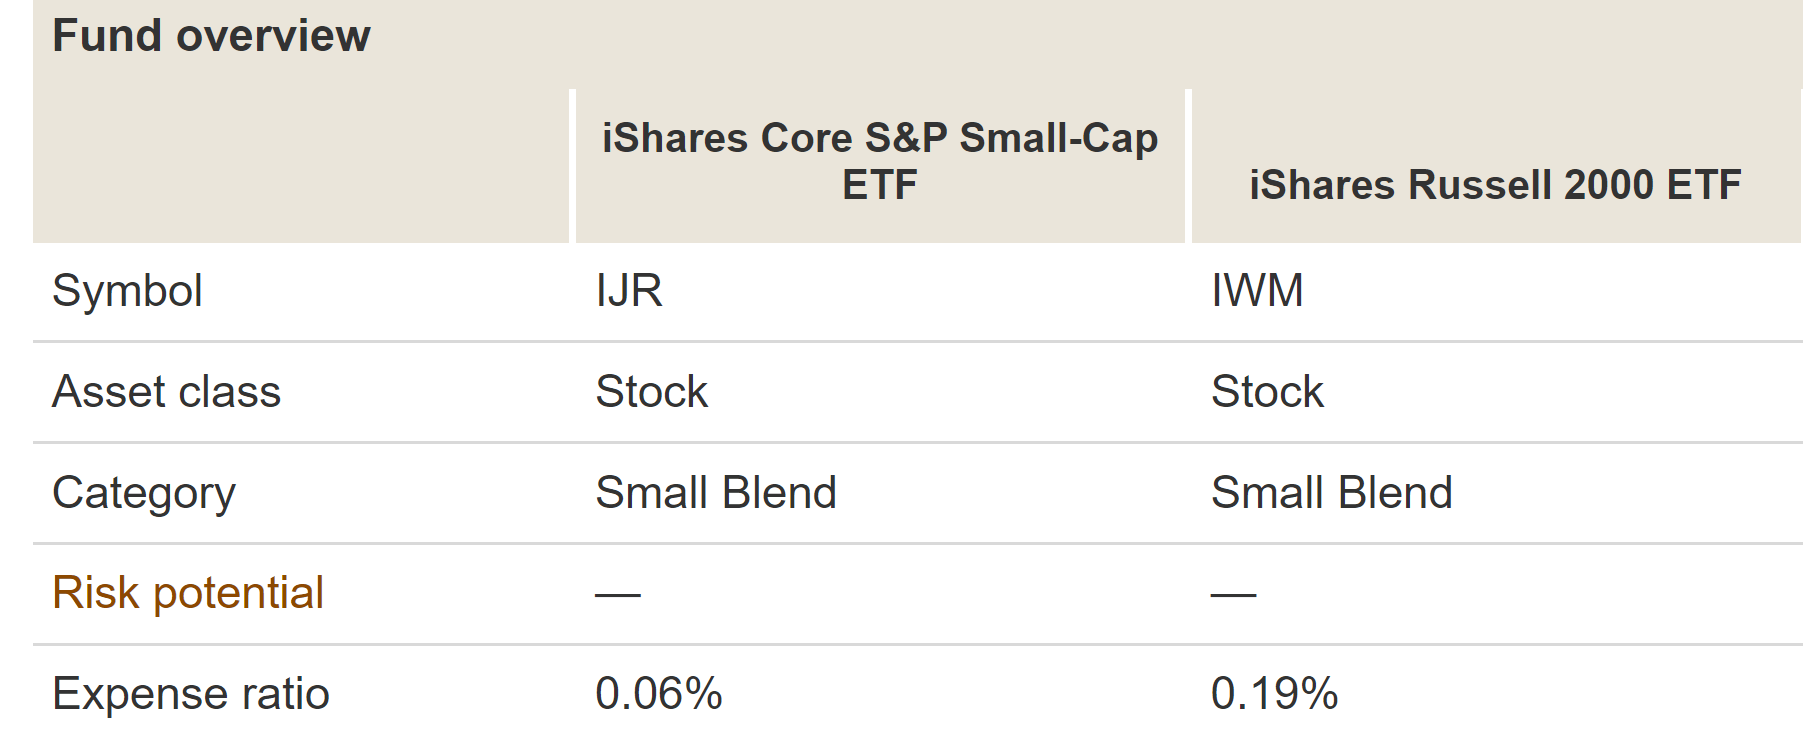
Market Dashboard: Small-cap 2nd most attractive
The small-cap sector currently is the second most attractive sector now (after telecommunication services) as you can see from our market dashboard below. Details of the dashboard can be found in our earlier articles (and also, it is programmed as a Google sheet, and you’re welcome to download it via this link: Market Sector Dashboard). As seen, IJR now features the second-largest dividend yield spread Z-score of 0.85 (again only second to the telecommunication service sector). And in terms of yield spread relative to 10yr treasury rates (about 3.83% as of this writing), its yield spread Z-score of -1.18% is also the 2nd highest one among all sectors (only second to the energy sector).
Author based on Seeking Alpha data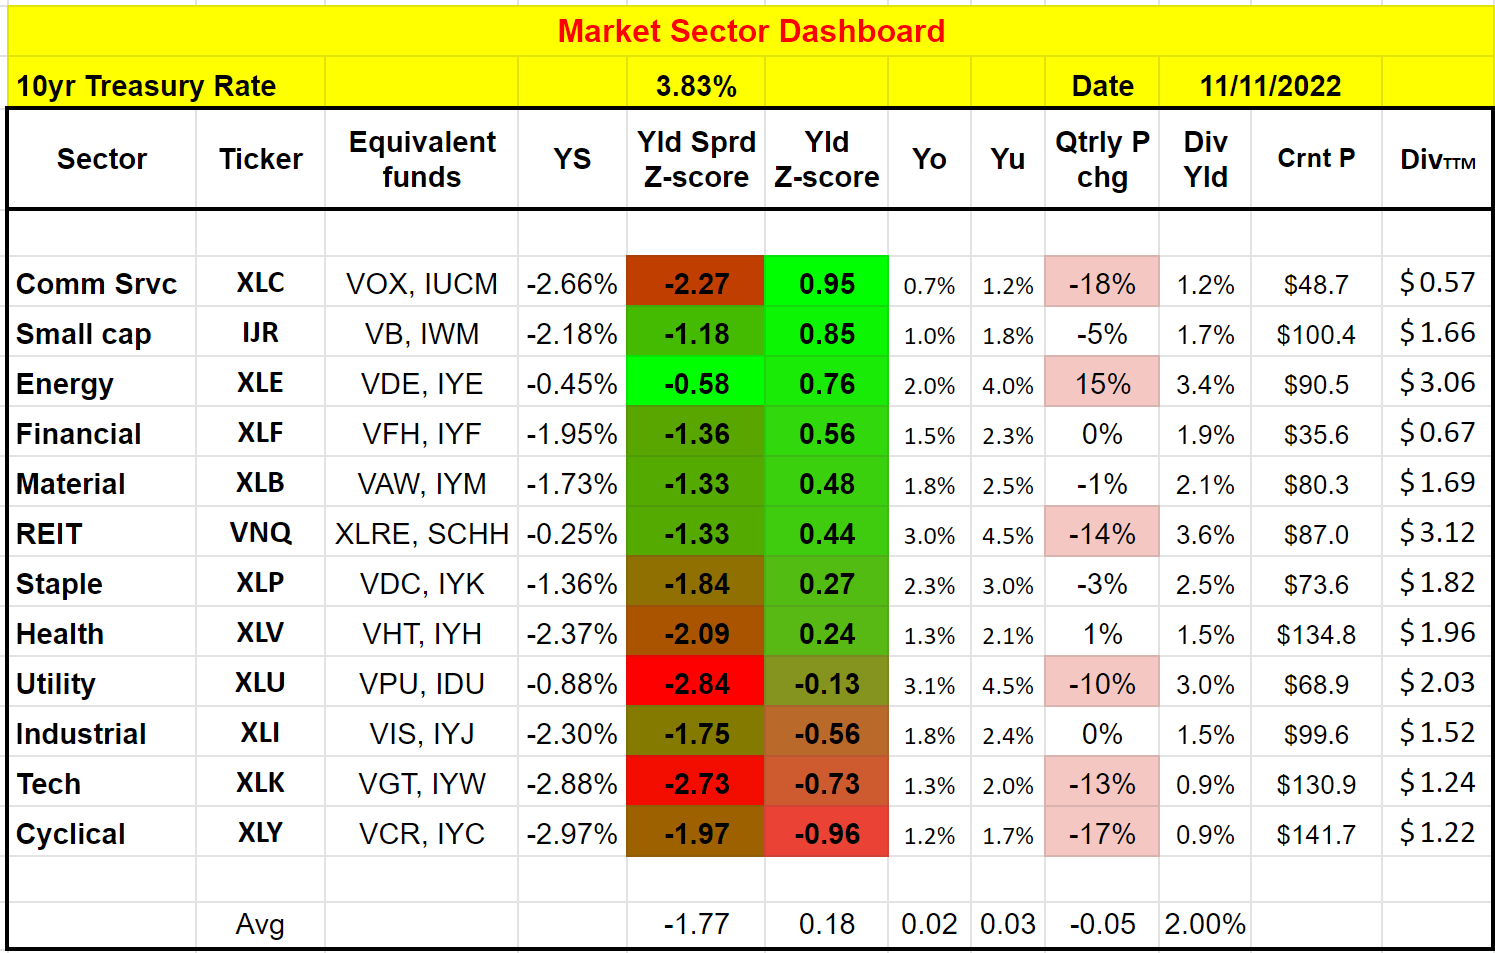
Small caps are at large valuation discounts
Besides the attractive yield and yield-spread Z-scores, small caps are also at large valuation discounts relative to the large caps. As you can see from the following charts, S&P 600 small cap is currently priced at an FW PE of 11.9x only. It is a sizeable 27% discount compared to the 16.3x PE for the large caps and about a 6% discount relative to the 12.6x PE of the mid-caps. In absolute terms, 11.9x PE is near the bottom valuation level amid the COVID panic sale or even the 2008 great recession as seen.
Yardeni.com data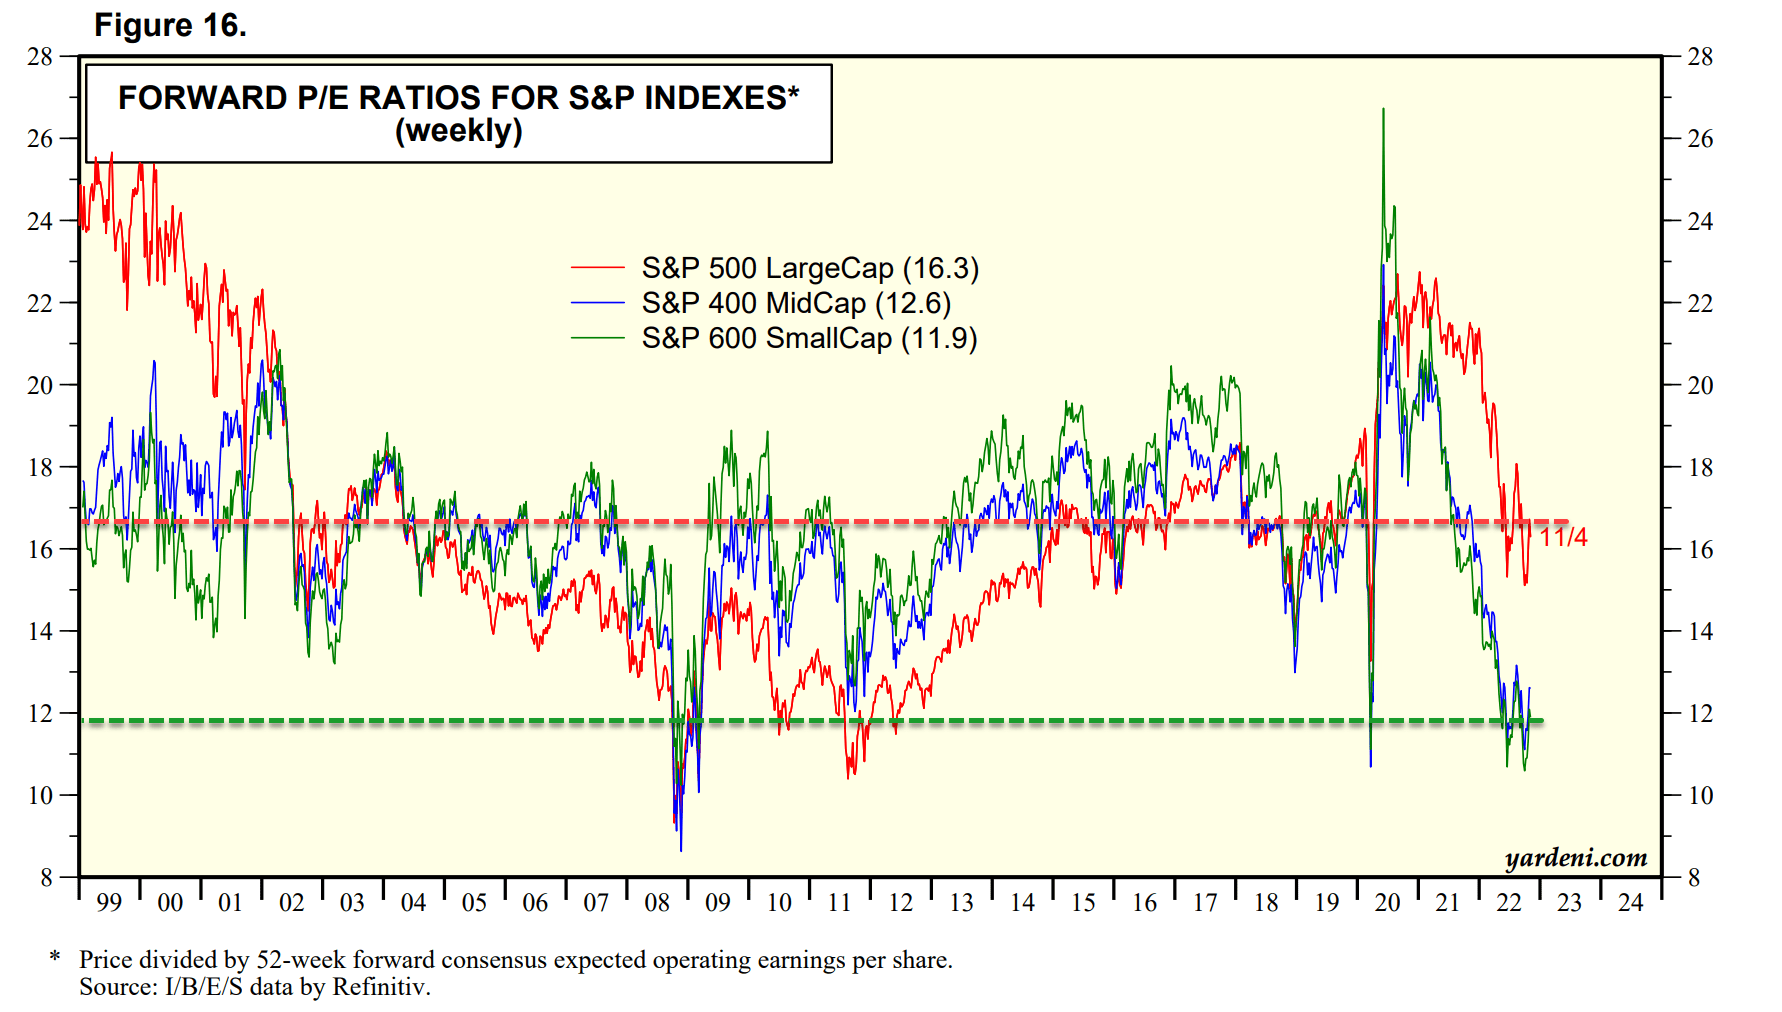
Between IJR and IWM, IJR is even more attractively valued as you can see from the following two charts. The data from the first chart is taken from Vanguard. Currently, IJR and IWM are both priced essentially at the same PE (10.5x vs 10.4x). However, in terms of price/book value (“PB”) multiple, IJR is only at 1.5x, about 12% below IWM.
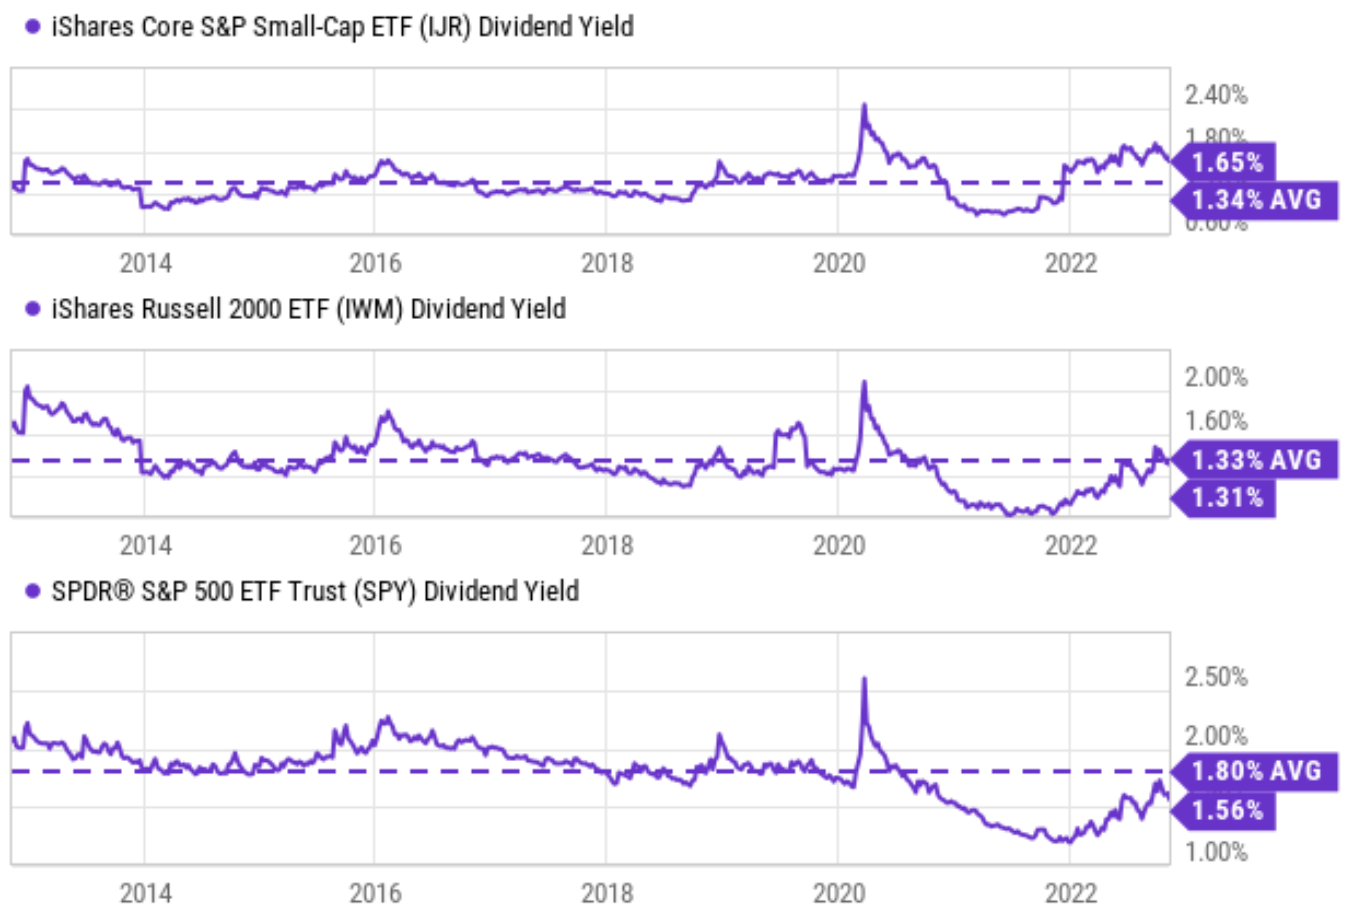
The data from the second chart compares their valuation in terms of dividend yields. Currently, IJR’s dividend yield is about 1.65%. The dividend yield for IJR has averaged 1.34%. Therefore, its current dividend yield is above its historical average by 23%, signaling a large valuation discount. In contrast, IWM’s dividend yield has a historical average of 1.33%. And its current 1.31% dividend yield is exactly on par with the average, signaling now the clear margin of safety.
Of course, both funds are attractively valued relative to the large caps. Judging by its dividend yield, SPY’s current dividend yield of 1.56% is still below its historical average of 1.8% by a good gap, signaling overvaluation despite the large corrections YTD.
Vanguard data Seeking Alpha data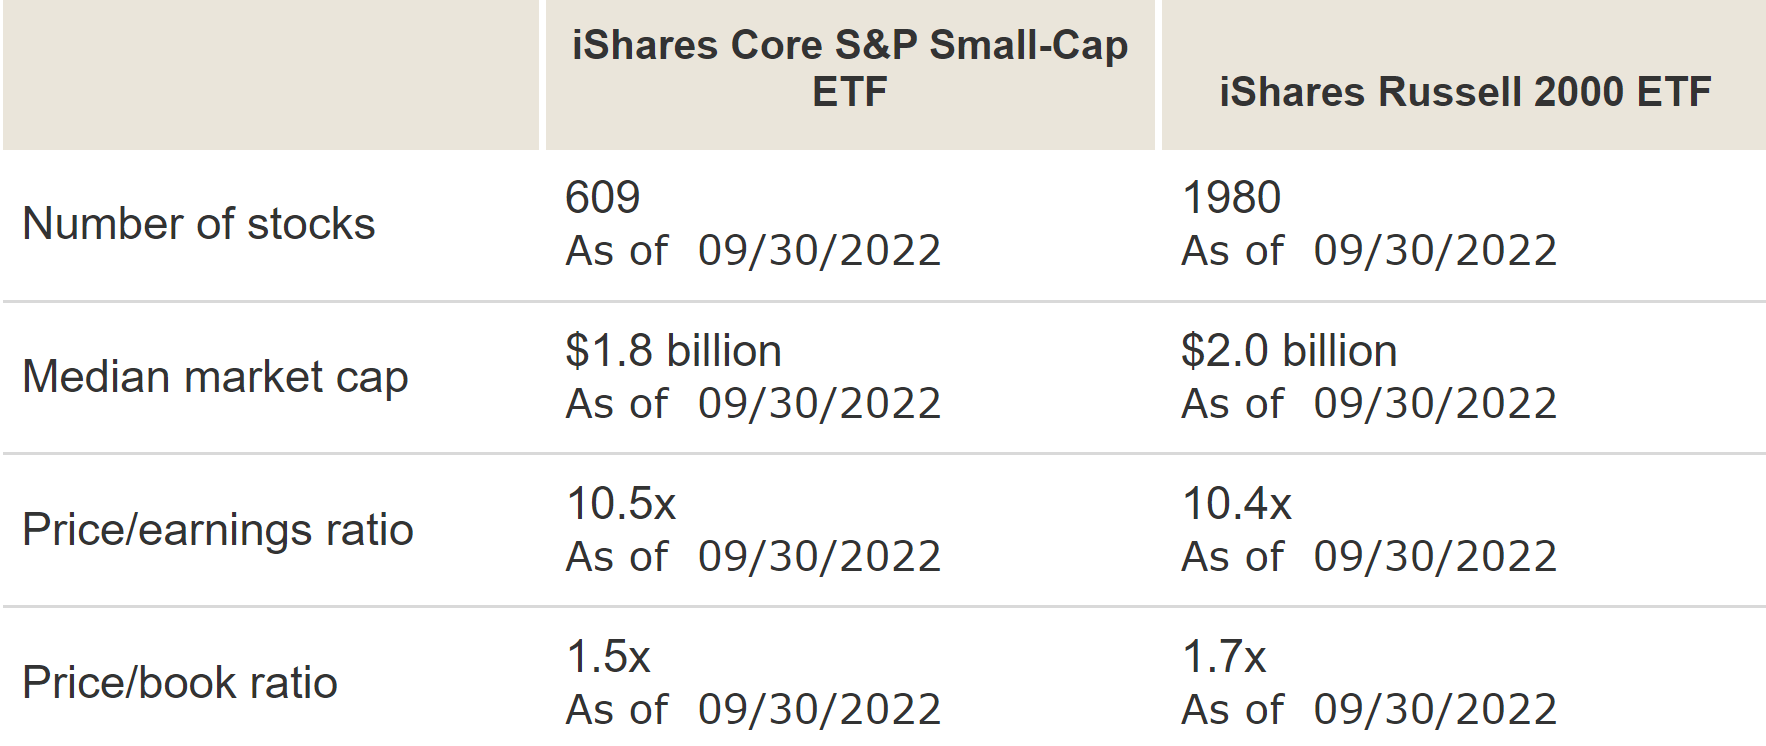
As an even more fundamental metric for relative valuation, the next chart shows the yield spread “YS” between IJR and IWM. Details of the calculation of YS have been provided in our earlier article. As you can see, the YS fluctuated around a mean of -0.03%, essentially zero, which should come as no surprise. Both funds track the market, and their valuation metrics should be approximately equal in the long term. Although sizeable deviations do occur occasionally. As seen, IJR was overvalued relative to IWM from 2012 to 2014 by a large degree, as reflected in a negative YS of around 0.4%.
And now, the situation has exactly reversed. And IJR’s discount relative to IWM is at its peak since 2011 indicated by the peak level of YS.
Author based on Seeking Alpha data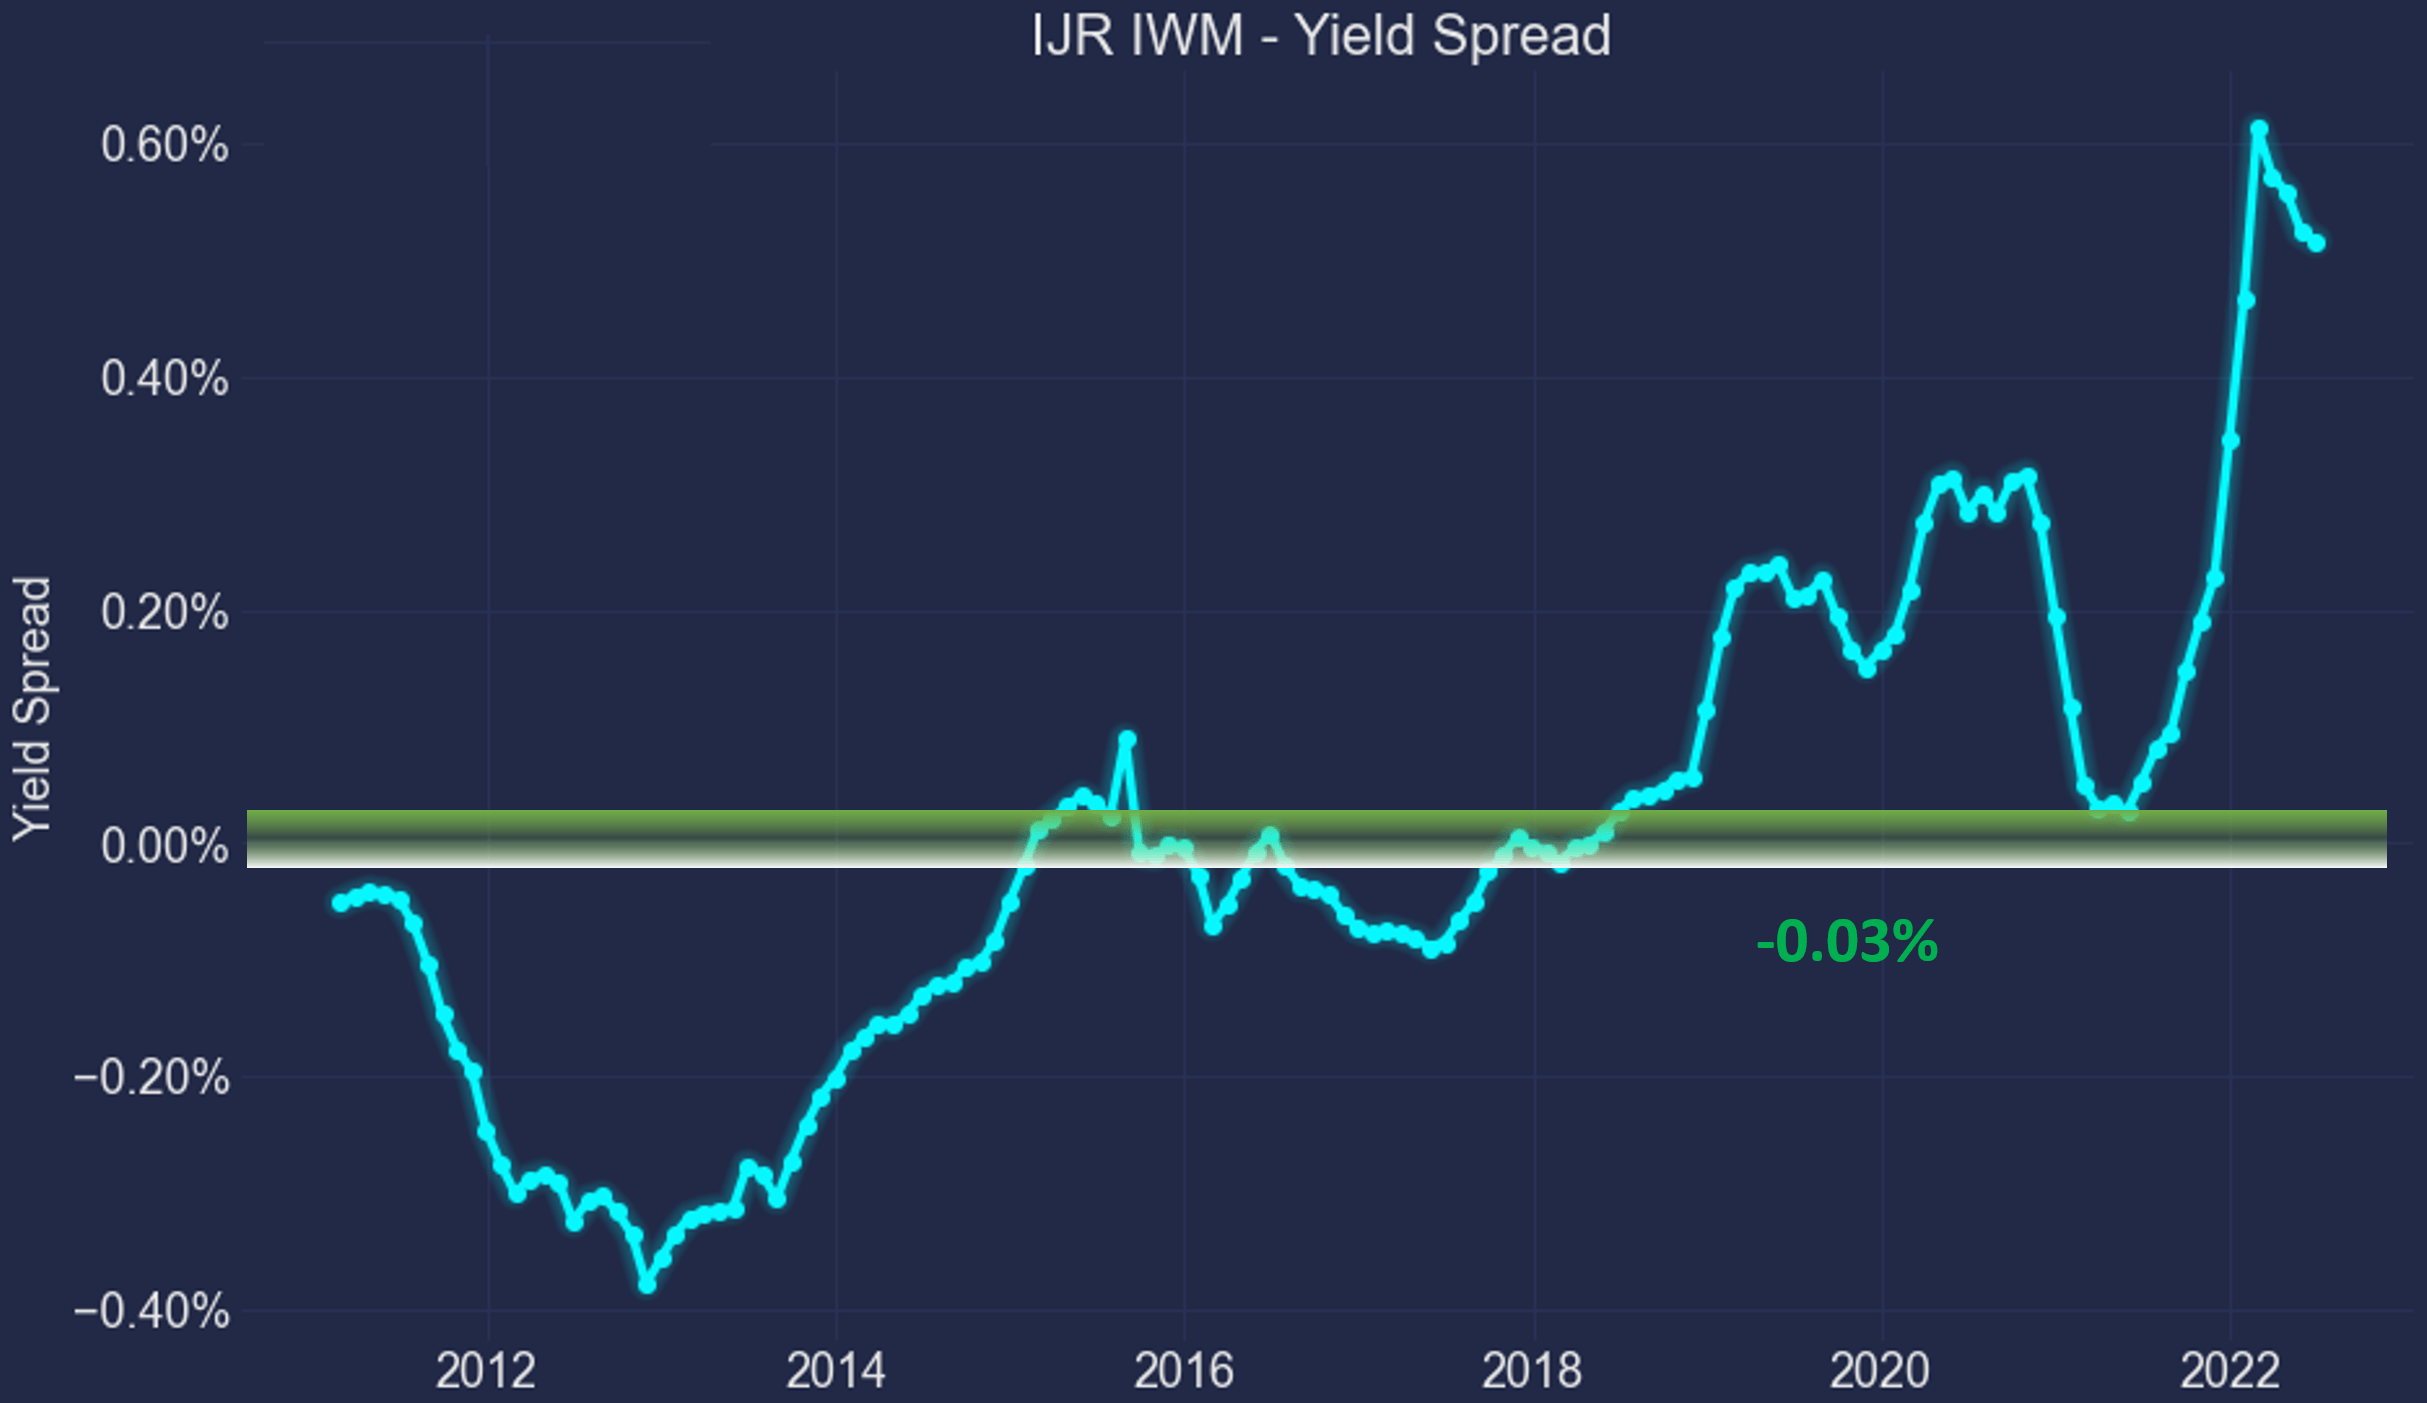
Risks and final thoughts
Both IJR and IWM are subject to the same macroeconomic risk that the overall economy faces such as inflation, interest rates, and also geopolitical risks. Here I will just comment on the risks more specific to these two ETFs themselves.
IJR has delivered a better total return in the long term as you can see from the chart below. Since their inception (both were launched in May 2000), IJR delivered a total return of 9.06% CAGR, compared to 7.12% from IWM. While note that IJR’s superior returns actually came at lower volatility risks as you can see from the second chart. IJR’s standard deviation is 18.9%, slightly lower than IWM’s 19.7%. Its worst-year performance of -31.5% is also better than IWM’s -34.1%). And so is its maximum drawdown (-51.8% vs -52.4%).
Vanguard data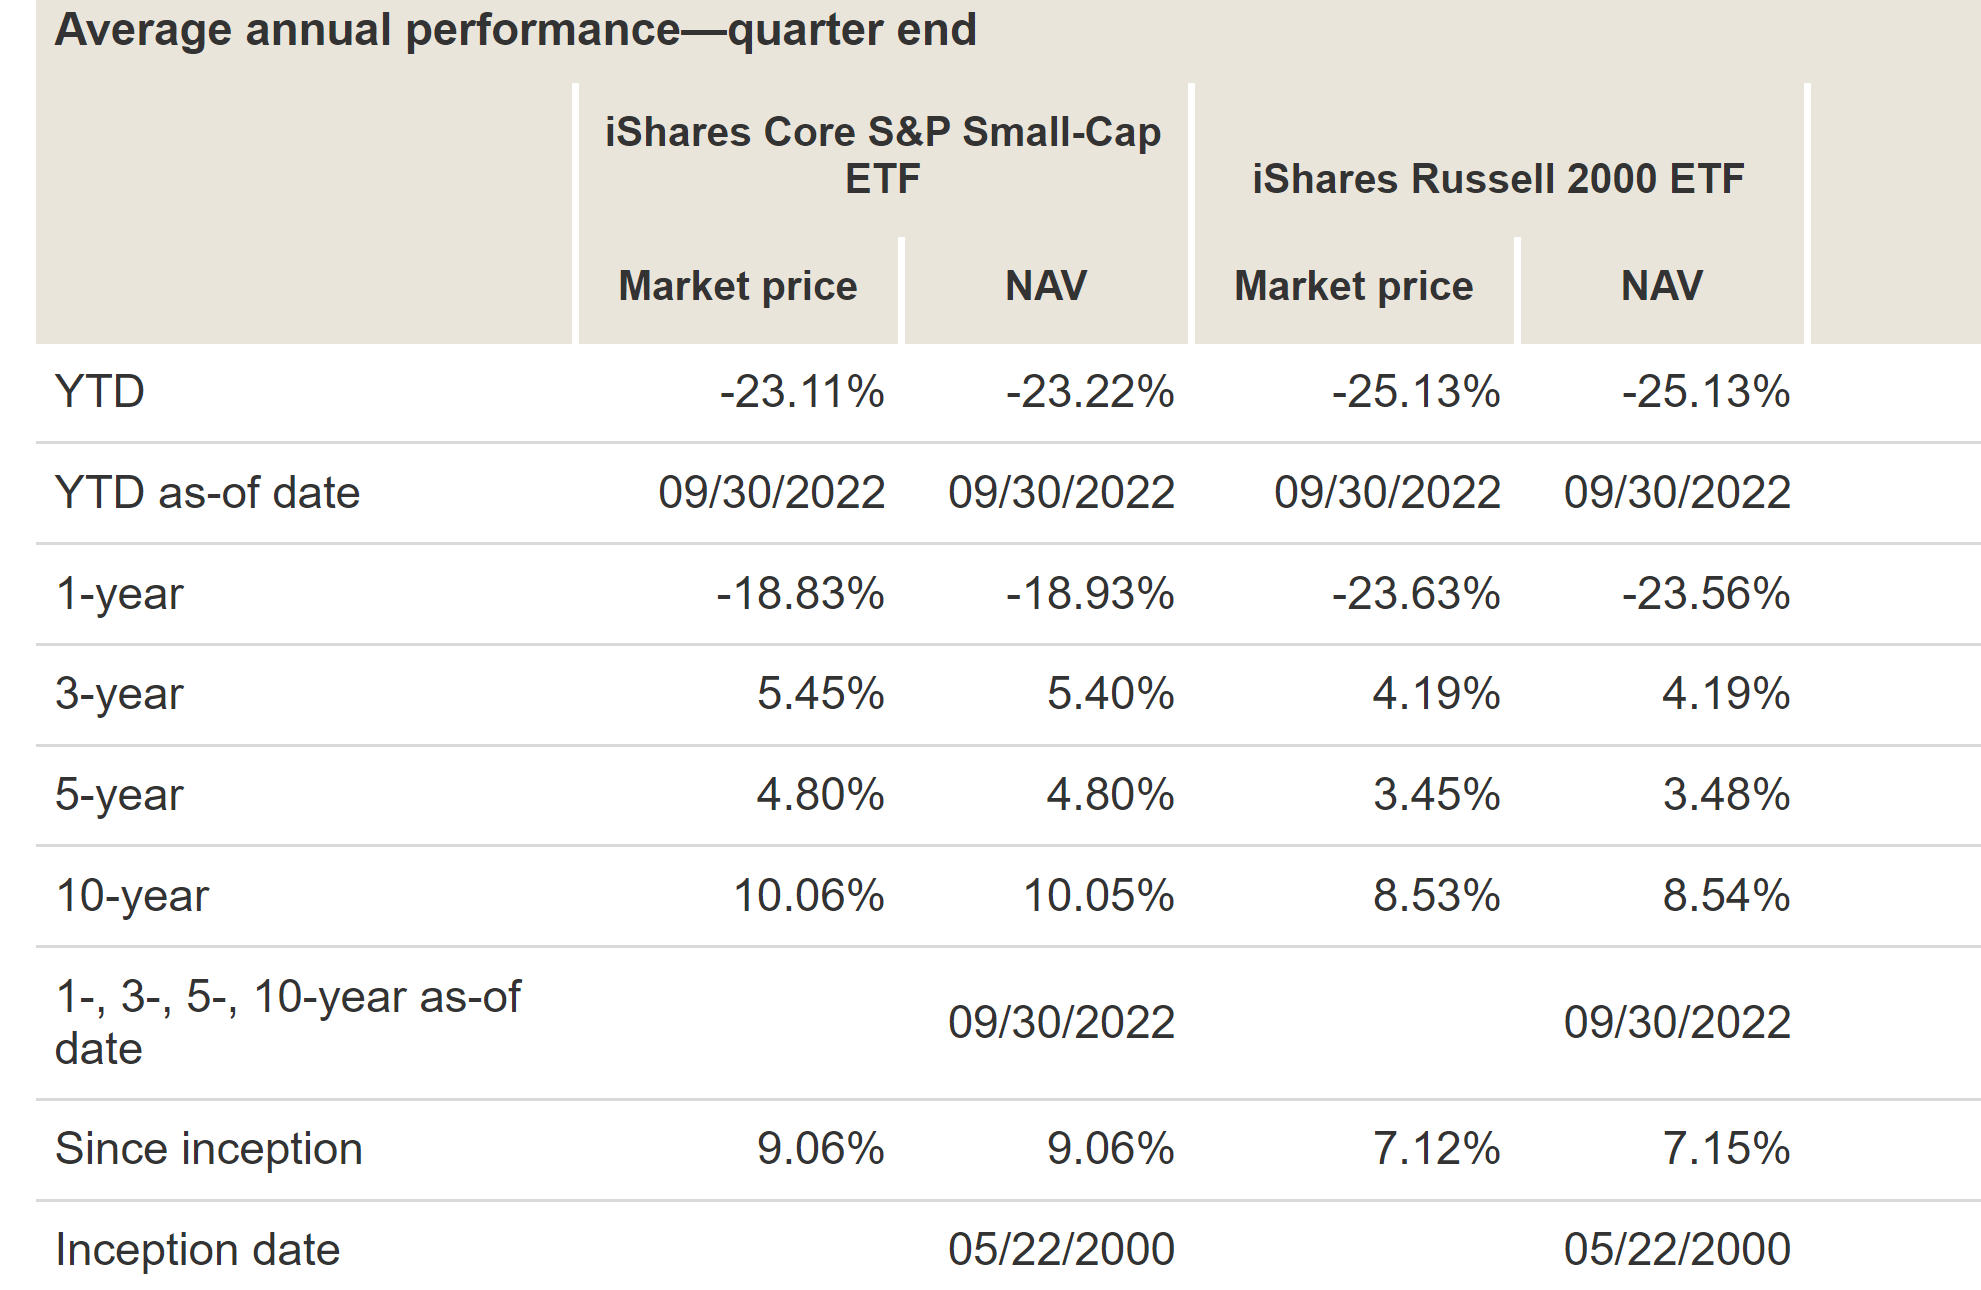
Although on the negative side, IJR is taxed more heavily and portions of its alpha relative to IWM is canceled off by its taxes. As you can see from the chart above, on a 10-year and pretax basis, IJR returned 10.06% CAGR, which translates to an alpha of 1.53% above IWM’s 8.53%. When taxes are considered, as shown in the chart below, IJR returns shrank to 8.15%, translating to an alpha of 1.36% above IWM’s 6.79% now (compared to the alpha of 1.53% before taxes).
Vanguard data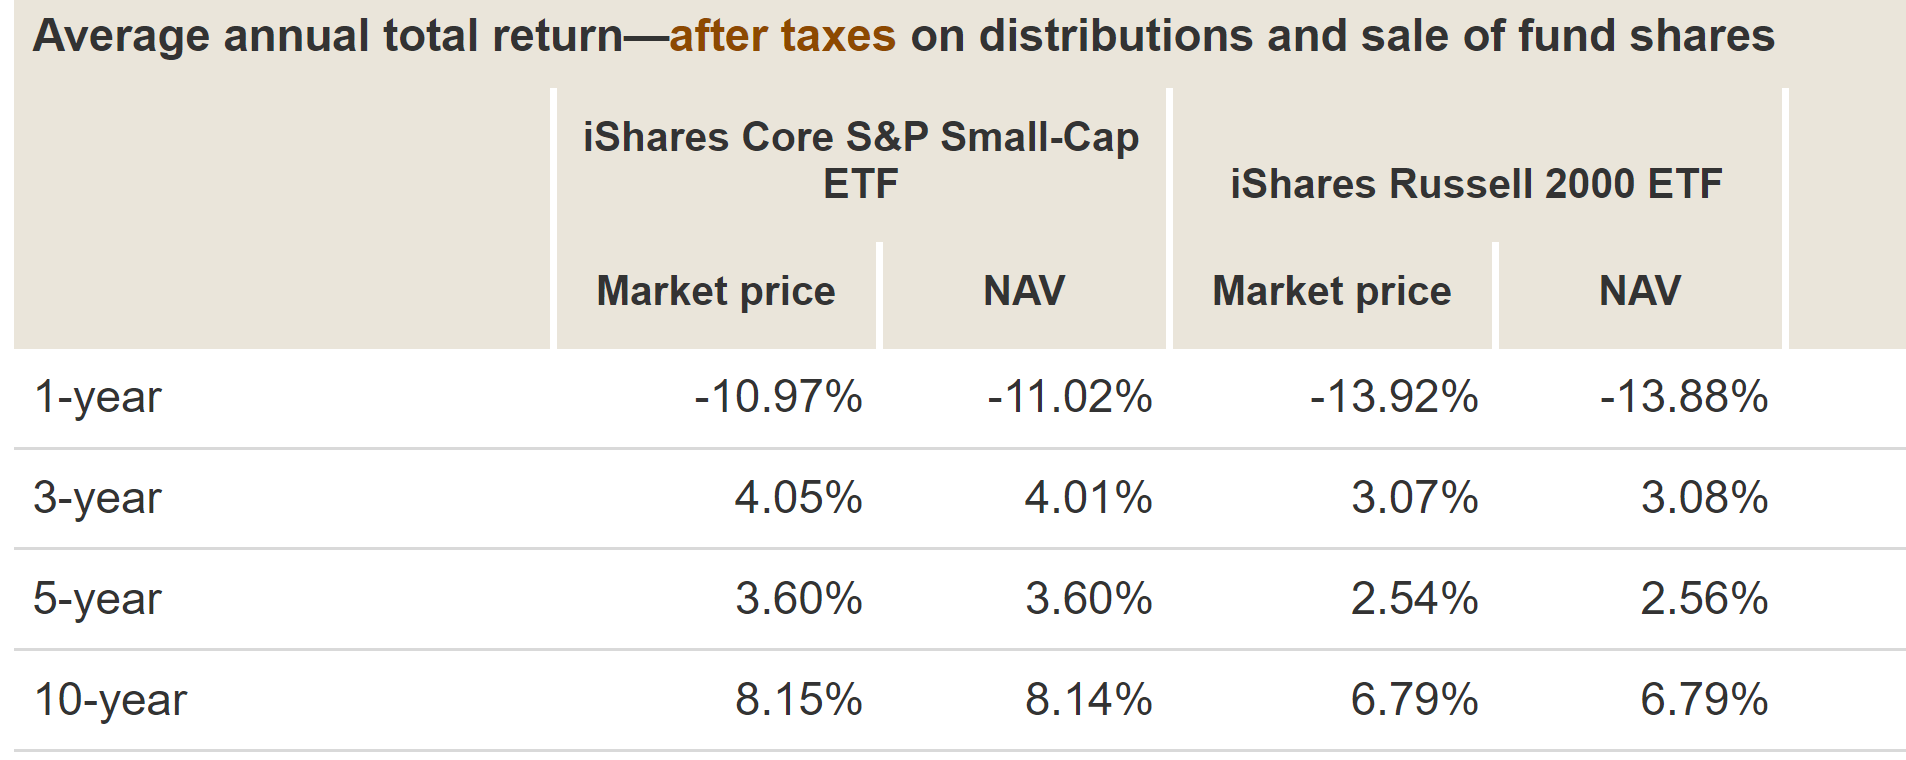
To conclude, I am seeing strong signs for the small caps to outperform large caps. These signs include both technical signals (such as stronger momentum) and more importantly, fundamental signs such as valuation discounts and yield spreads. To wit, small caps are currently priced at an FW PE of 11.9x only, a sizeable 27% discount from large caps’ 16.3x PE. In terms of dividend yield, the current dividend yield for IJR is above its historical average by a whopping 23%, signaling a large valuation discount. In contrast, SPY’s current dividend yield of 1.56% is still below its historical average of 1.8% by a large margin. And between IJR and IWM, I favor IJR even better due to its lower volatility risks, lower fees, and even more attractive valuation metrics as indicated by its peak YS since 2011 relative to IWM.
Be the first to comment