

ipopba
Introduction
I last wrote about Micron (NASDAQ:MU) stock just after I sold the stock at the very end of 2019 with my article “Profiting From Micron’s Cycles: A Case Study“. I had first warned investors about Micron’s downside in mid-September of 2018, and in that article, I shared the price at which I would start buying Micron. I shared two potential buy prices, just as I will in this article, but only the first one hit, and on October 25th, 2018, I shared my purchase with my article “I’m Buying Micron (Even If It’s Not Different This Time)“. From the time my “buy” article came out until the time my December 2019 “sell” article came out, here is how Micron performed.
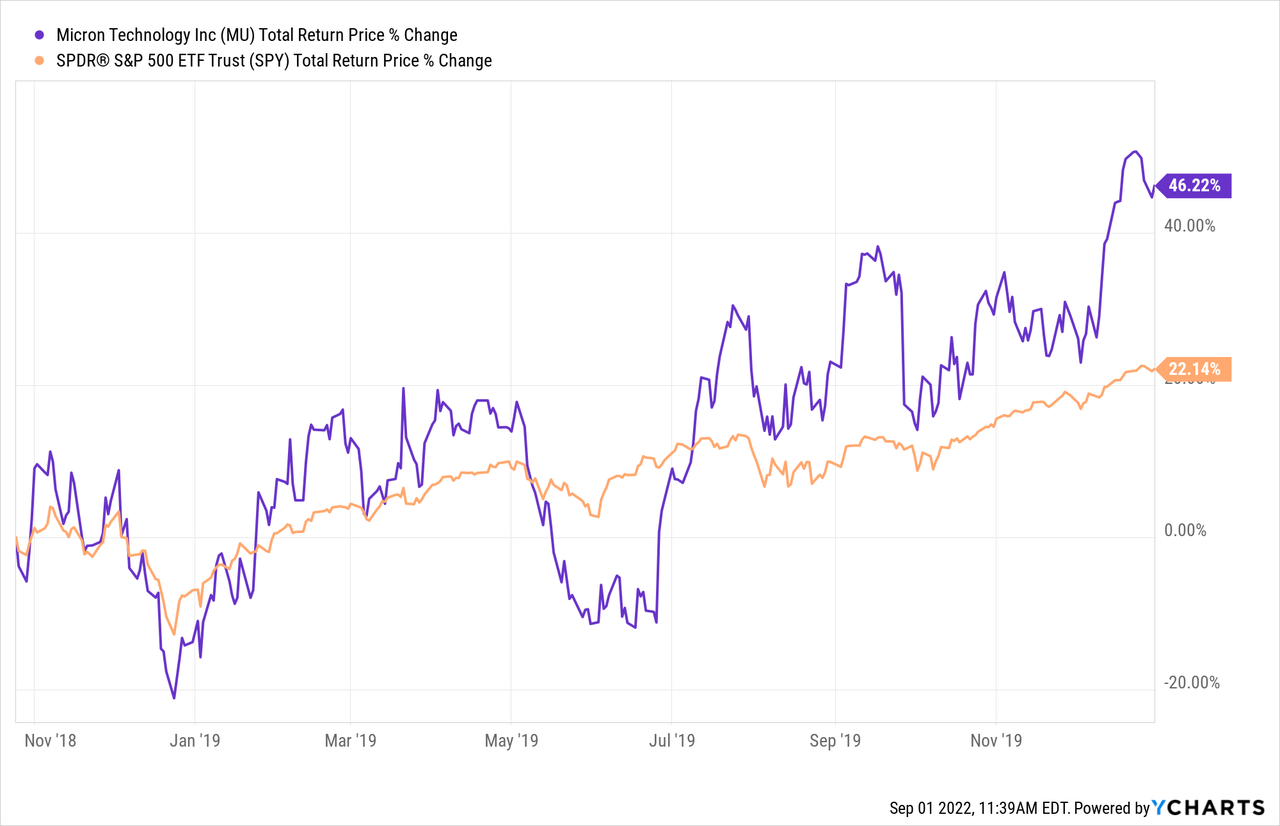
In just over a year’s time, a reader who bought after my first article and sold after the second was able to get a 46% return on MU, roughly double what the S&P 500 index provided over the same time period.
Since I sold MU, here is how it has performed through today:
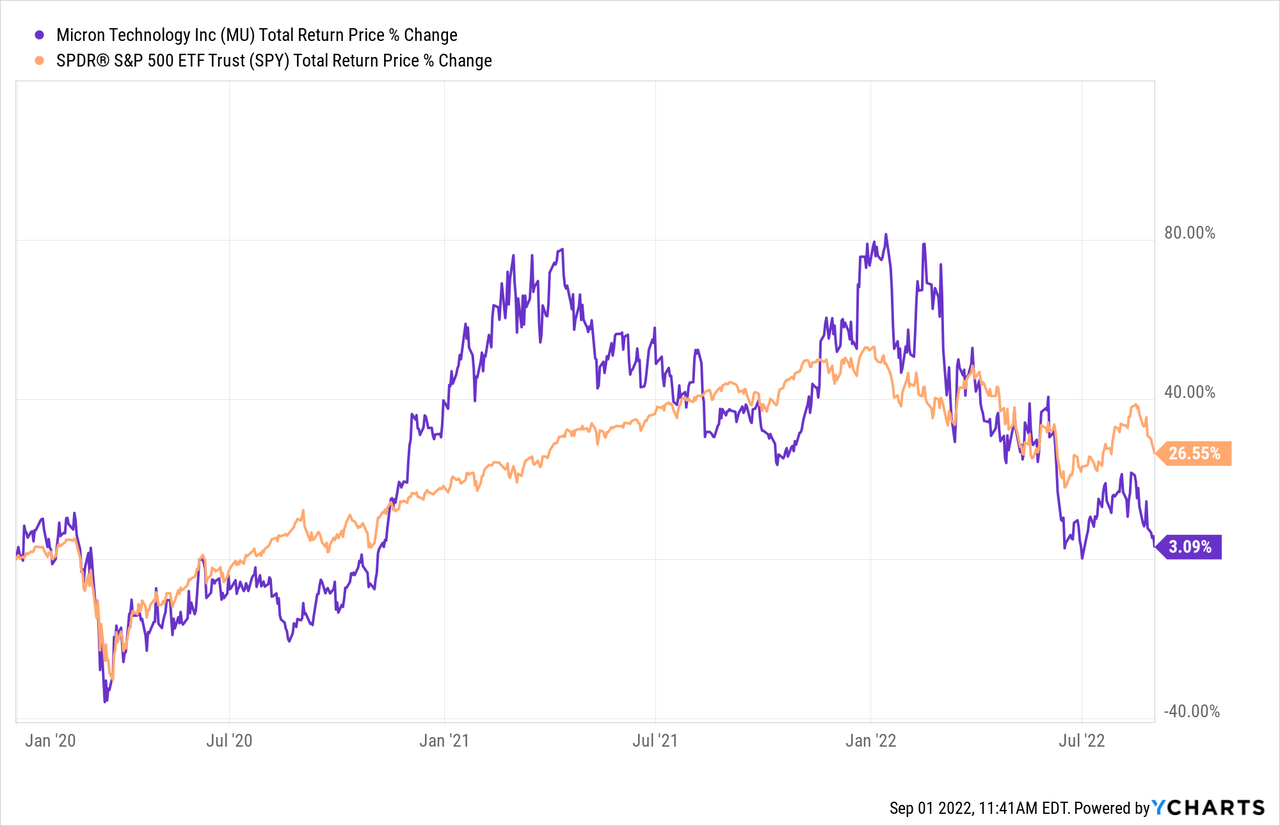
Currently, it is basically flat, while SPY has returned about 26%. So, I haven’t lost anything by staying on the sidelines and investing in other opportunities instead during this time period.
Now that Micron stock has started a new downcycle, I think it’s time to share my buying strategy for the stock again since it has been about 4 years since I’ve done so, and the stock price is now approaching the first of my two potential buy prices.
The technique I’m sharing will be the very same technique I used in 2018 with success. Importantly, the idea behind the technique is simply to get things “mostly right”. I didn’t buy near the bottom in 2018, nor did I sell at the very top, but I was still able to get an extremely good annualized return and I knew when I bought the stock my odds of success were very high.
Micron’s Historical Earnings Cyclicality
The first thing I check for every stock I analyze is to see what its historical earnings cyclicality looks like. The reason I do this is because I want to know if this is a stock that fits the profile of a stock I would consider investing in, and also I want to know which strategy and techniques are the most appropriate to analyze the stock in question.
FAST Graphs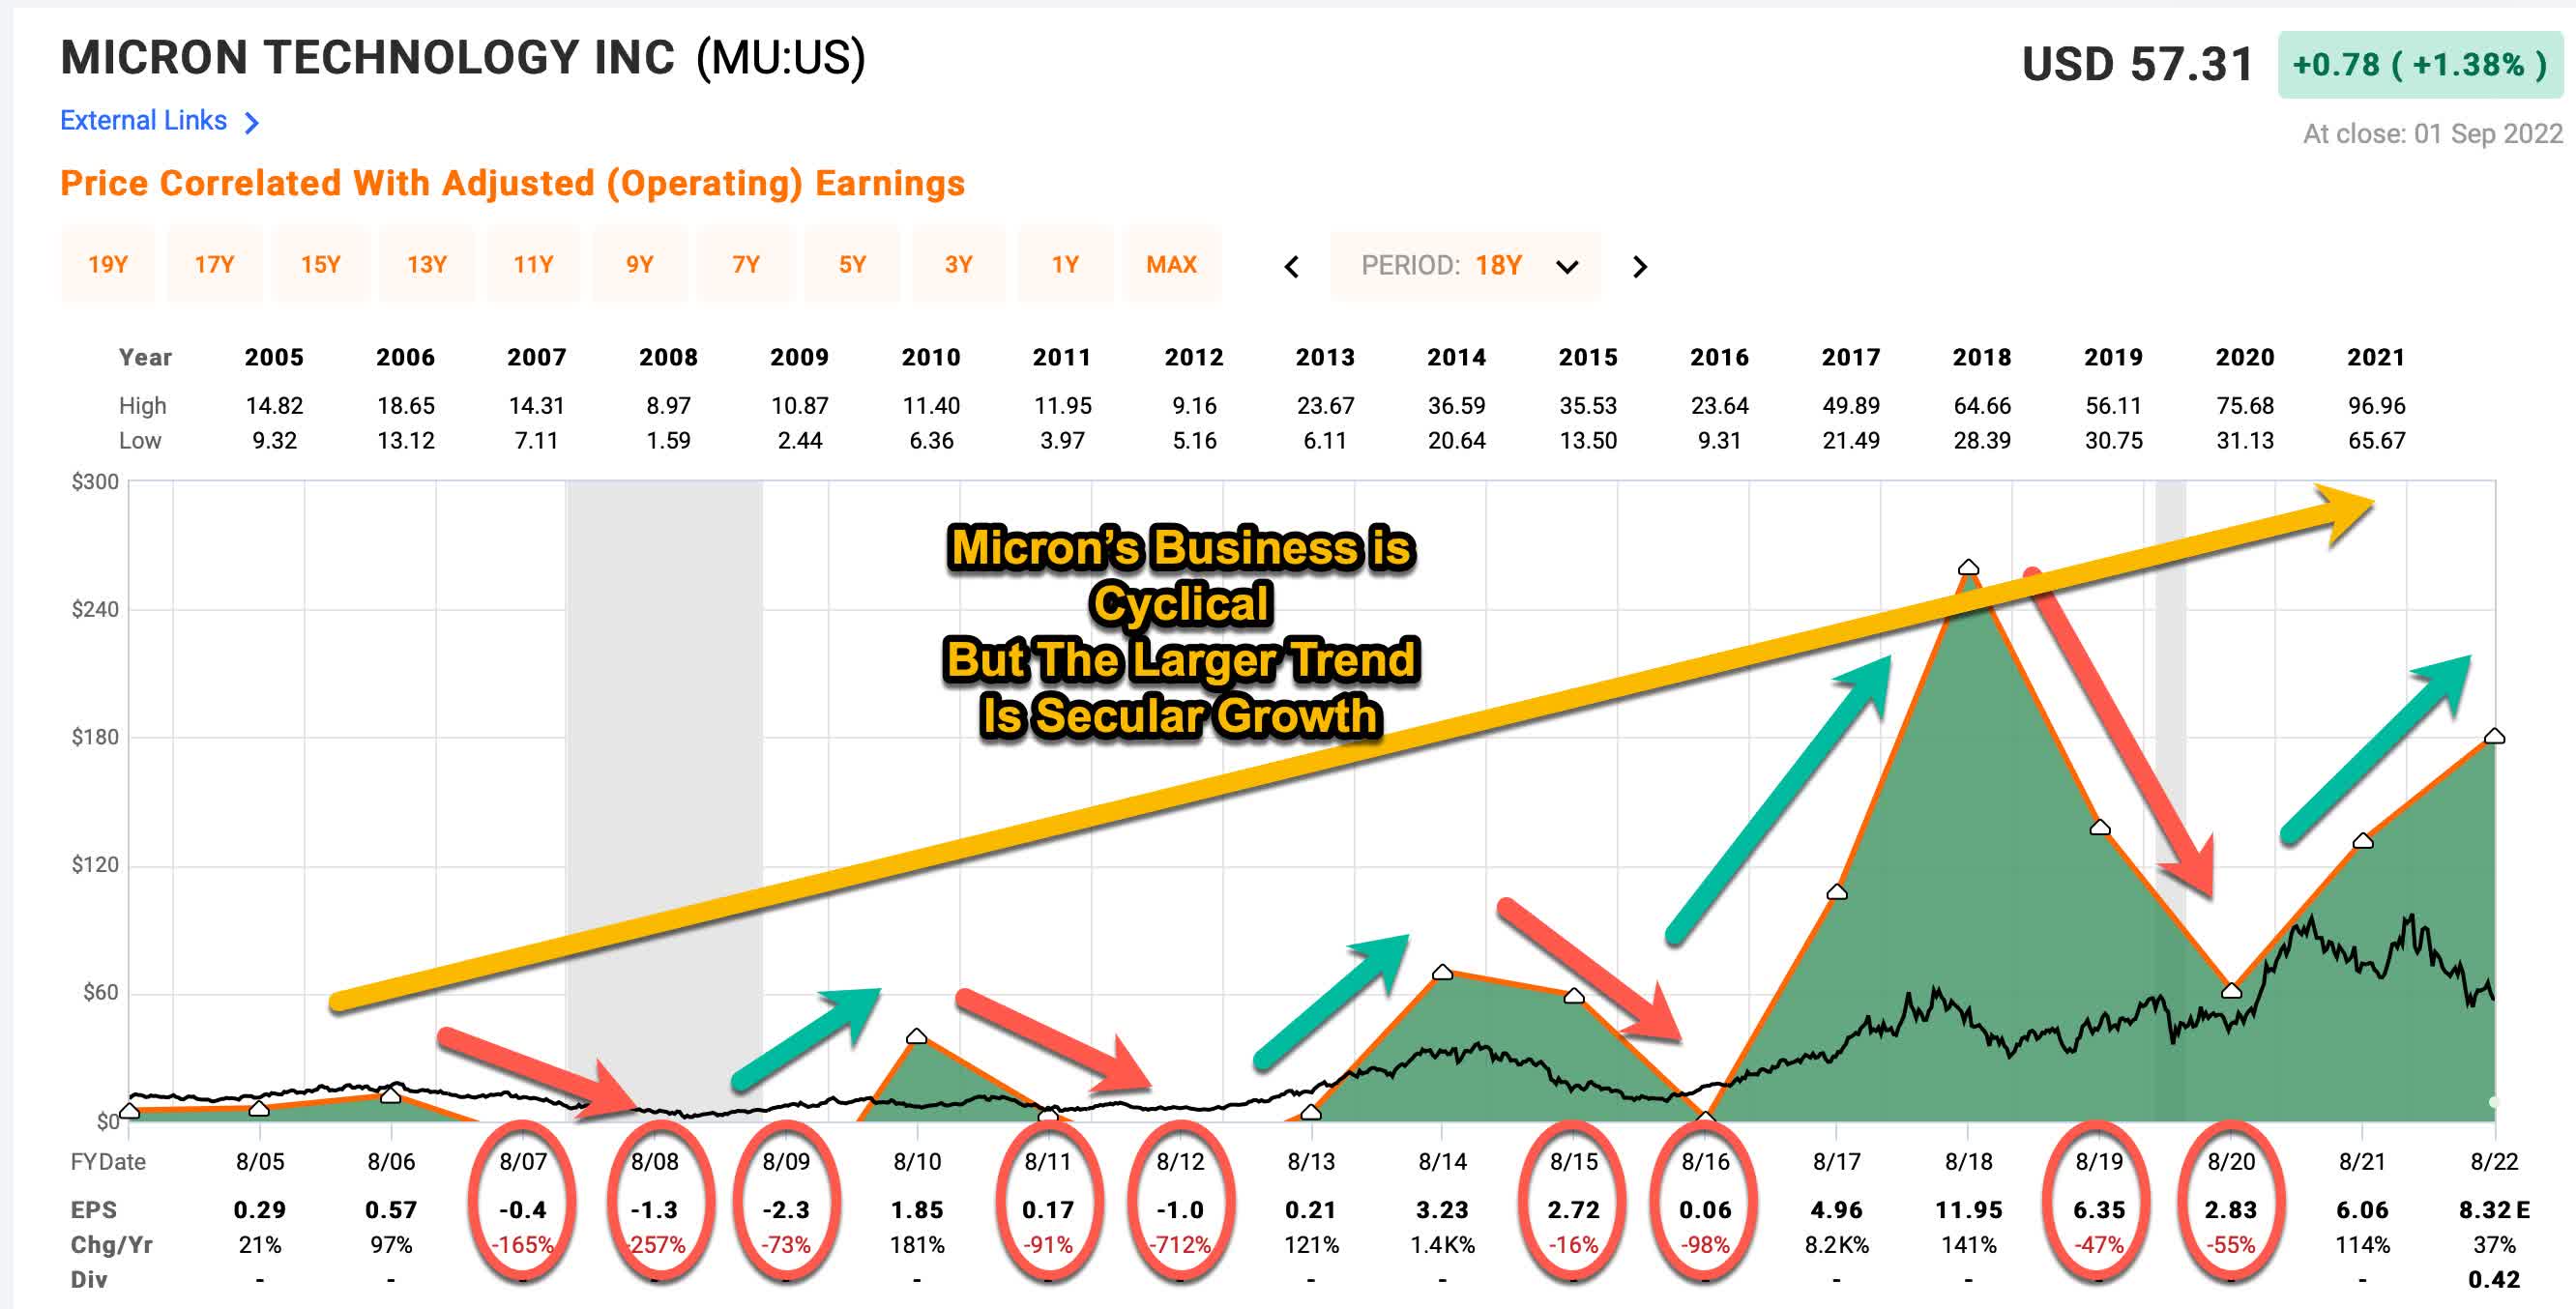
The dark green shaded area in the FAST Graph above represents Micron’s historical earnings per share. As you can see, historically earnings go deeply negative during downcycles, so deep, that there are times when Micron has had 2 or 3 years where they lose money. However, eventually, earnings have always bounced back from these declines and typically done so in a reasonably timely manner. Generally speaking, I don’t usually buy cyclical stocks that experience more than 2 years of negative earnings because they are simply too dangerous to own, so the fact that Micron’s earnings have consistently bounced back is important.
The second very important takeaway from the graph above is that every cycle over the past 20 years earnings have experienced a higher peak than the previous cycle, and also a higher low than the previous cycle. This creates a secular growth trend. And, we all know from common observation of our society and economy that demand for memory has been growing rapidly over this time period, so this pattern makes intuitive sense.
When we put all this together, what we have is a deeply cyclical business that is also in a secular growth trend. On one hand, this makes Micron stock a prime deep cyclical stock candidate to buy. On the other hand, these cross-currents of deep cyclicality within a secular growth trend make it difficult to determine the best price to buy. I will explain more on this later in the article, but these cross-currents are one of the reasons that for stocks like Micron I have two buy prices instead of one. This helps ensure you can capitalize at least a little bit during each downturn (as I did with the 2018 downcycle), but it also leaves open the door for huge gains if the market really pushes the price down deeply. I think we need to be prepared for both possibilities with Micron stock.
Because Micron is a very deep cyclical stock, using earnings is not a good way to value the stock. In fact, often when P/Es are low, it is the worst time to buy a stock like Micron because that usually happens right after a peak, just before earnings collapse. (And anyone who purchased Micron stock this year is experiencing that decline.) For that reason, when it comes to businesses with deeply cyclical earnings, I rely on historical price cyclicality to help guide me when it comes to the prices I am willing to buy. Also, because these stocks can be extremely volatile, each position I take is only weighted approximately 1% of my portfolio.
MU Stock – Historical Price Cyclicality
Next I’m going to examine Micron’s historical price cyclicality in order to help guide a potential purchase price of the stock. While patterns don’t offer a perfect map to the future, they at least offer pretty good guideposts, and as we’ll see, Micron stock tends to move so much, that we don’t have to be anywhere near perfect to perform well with the stock over the medium-term of 2-5 years, which is typically what I aim for with this strategy.
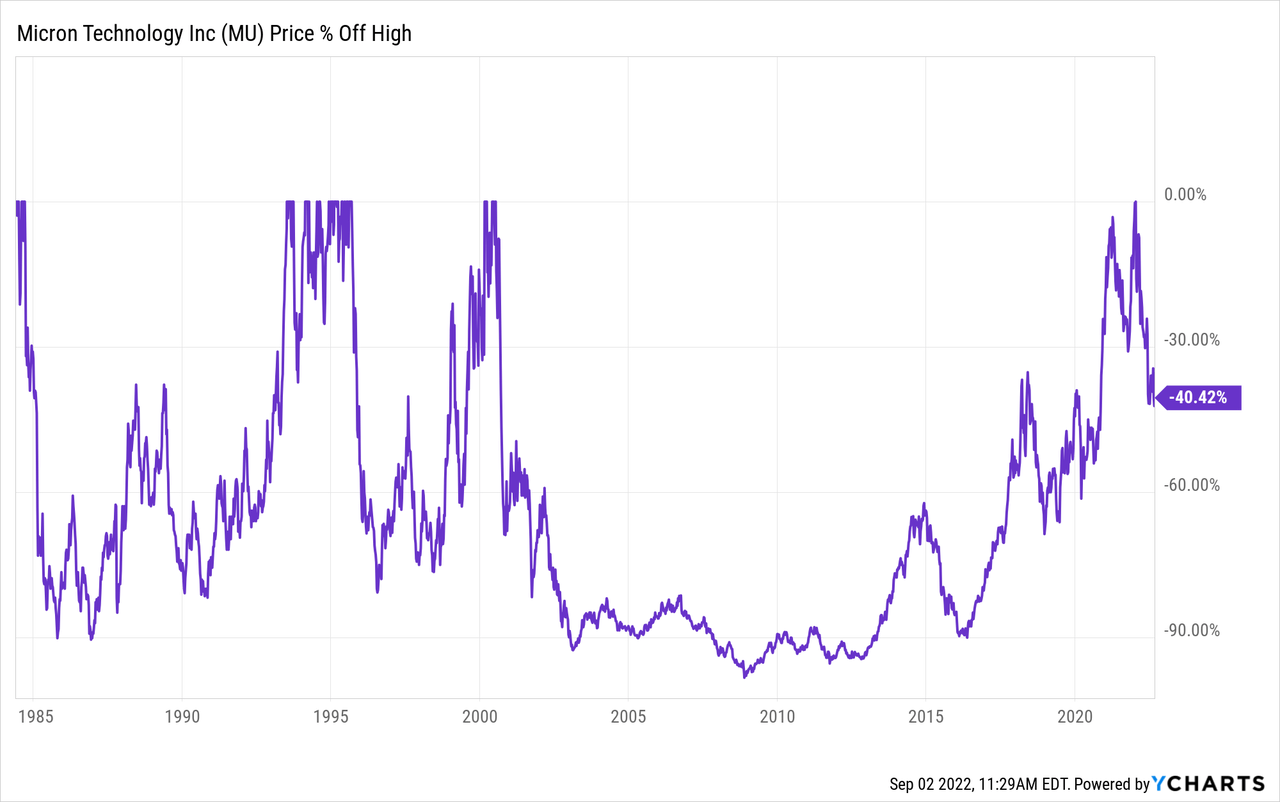
Above is the very long-term historical drawdown chart for Micron. We can see that it is not uncommon for the stock to fall -80%+ off its highs historically. But we can also see that other than the 2000 bust, Micron’s price usually recovers in a reasonable period of time. Next, I’m going to shorten this graph to start in 2003 so we can better see Micron’s more modern/recent decline patterns.
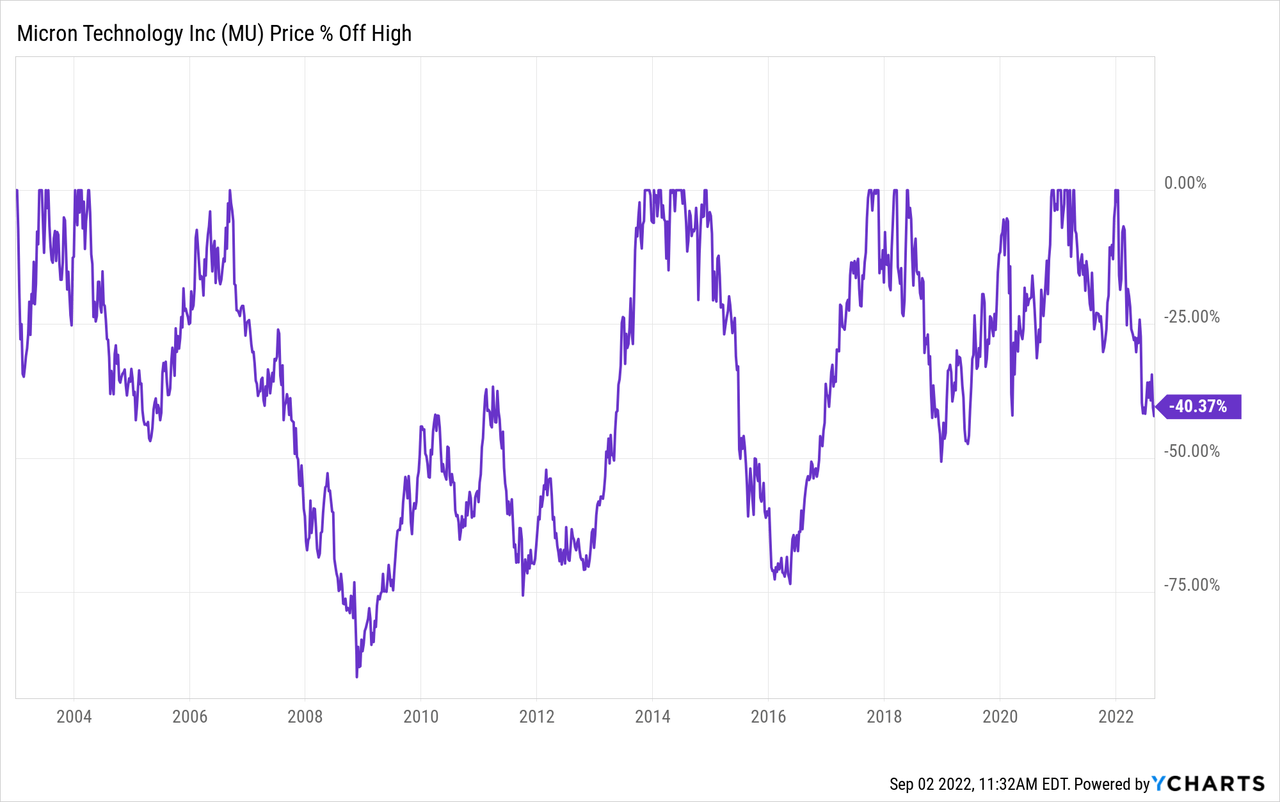
Now we get a little bit clearer picture of the types of patterns I expect from Micron stock. There are shallower downturns like in 2004, 2018, and 2020. And then there are deep declines as we saw in 2007 and 2015. Below I have put these drawdowns in table form and made a few adjustments.
| ~Year | ~Time Until Bottom | ~Duration | ~Depth |
| 1984 | 1 year | 9 years | -89% |
| 1986* | 6 months | 18 months | -79% |
| 1988 | 6 months | 1 year | -42% |
| 1989 | 18 months | 4 years | -71% |
| 1995 | 1 year | 4.5 years | -80% |
| 2000 | 2.5 years | 18 years+ | -92% |
| 2004* | 1 year | 2 years | -47% |
| 2006 | 1.5 years | 7 years | -90% |
| 2014 | 1 year | 3 years | -73% |
| 2018 | 6 months | 2 years | -53% |
| 2022 | ? | ? | -45%+? |
*There are two ‘resets’ being made here. The first was after the dip Micron took after its IPO around 1984. These post-IPO dips are fairly common and a lot of times I completely disregard them if they happened over 25 years ago, but I thought I would include this one and adjust for it. The stock price did eventually recover after 9 years, but I went ahead and recorded the drawdowns during that time frame as if the stock price had recovered. The second * denotes the stock did not make a full recovery back to the 2000 super-cyclical highs, so I ‘reset’ the highs here, too.
The big pattern for me here is that Micron stock typically takes two broad paths during downturns. One in which the stock price falls -45% to -55% off its highs, and one in which it falls much deeper and closer to -80% off its highs. Also, during all but the 2000 bubble bursting, Micron stock has made pretty timely recoveries of its old highs, so as long as we avoid buying after a supercycle, an investor would likely do okay even if they bought after a -50% decline off the high and the stock took a deep dive. However, it doesn’t make much sense to me to buy the stock unless it’s about -50% off its high or deeper.
Because there are two potential patterns and it’s difficult to know ahead of time which path the stock will take, I will be prepared to make two separate purchases, one after a -50% price decline, and one after an -80% price decline, should it happen. Typically I sell when the stock recovers its all-time highs again. The theory behind this strategy is that if investors were willing to pay a certain price for the stock in the past, then if similar conditions arise in the future, it is reasonable to expect that they could pay that price again, as long as we weren’t in some sort of super-cycle as we were in 2000.
My investing approach for deep cyclicals attempts to find historical patterns and then assumes they will roughly repeat. However, I do check several things in order to see if there are obvious signs that this cycle really might be different and not repeat. I call these checks “impairment tests” and usually they take the form of a question. In the next section, I will run through this list of tests with Micron.
Impairment Tests
Are revenues this cyclical peak higher than the last one?
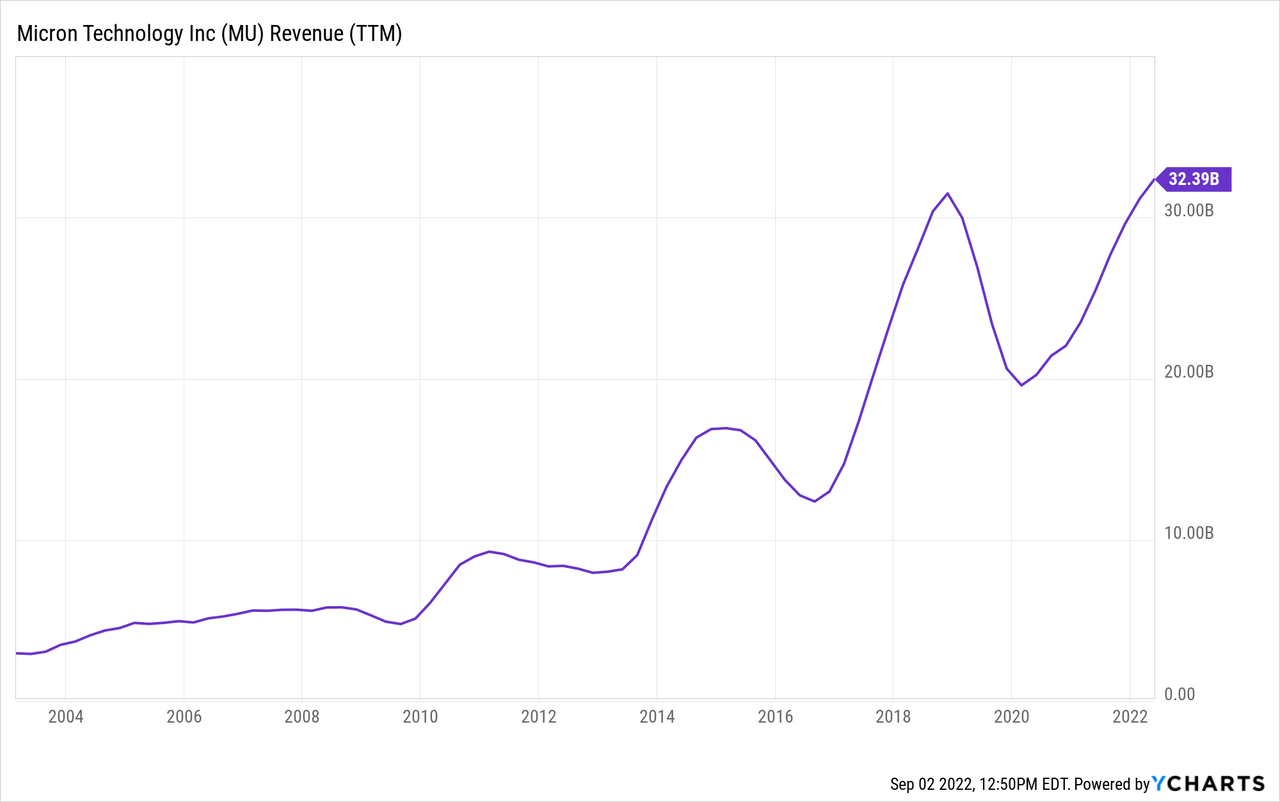
If revenues during the current cycle are significantly lower than the previous cycle, it can be a sign that the business isn’t as strong as it has been in the past. As we can see in the chart above, revenues are already a little bit higher than they were at the 2018 peak, so MU passes this test.
Could the business have a hidden fatal flaw?
Since, by definition, the fatal flaw in the business model is “hidden” and cannot be easily seen, my test for this is whether the cyclical business in question has experienced two full business cycles because, typically, recessions are where the flaws are exposed, and sometimes businesses can get lucky and avoid trouble in one recession but have the flaw eventually catch up to them during the next. I typically pre-screen for this before I write an article, and we can see that MU has survived decades and been a proven winner and survivor, so I think we are safe in this regard.
Is there a clear and disruptive threat to its core business?
I’m not an expert in this industry by any standard, but I haven’t really heard of any disruptive threat that would take place over the next 2-5 years, which is the time frame we are focused on for this potential investment.
Has the stock experienced a recent super-cycle?
Now, this is probably the test that I’m most concerned about. Generally speaking, I think the wider market could certainly have experienced a 2000-like super-cyclical peak at the end of 2021. And we have seen from MU’s history that basing one’s buy price off a super-cyclical top could take a person a very long time to recover their investment.
This can cause a problem for a strategy like mine that measures declines from peak prices because if the peak prices are ridiculously high, then a stock might fall -50% or more off its highs and still not exactly be a good value.
I don’t have a clear way to identify super-cycles. It’s kind of an “I’ll know it when I see it” sort of thing. But my quick way to check is to look at a log-scale version of a long-term historical price chart. Super-cycles tend to show up pretty well on these charts without giving as many false positives as a normal long-term price chart might.
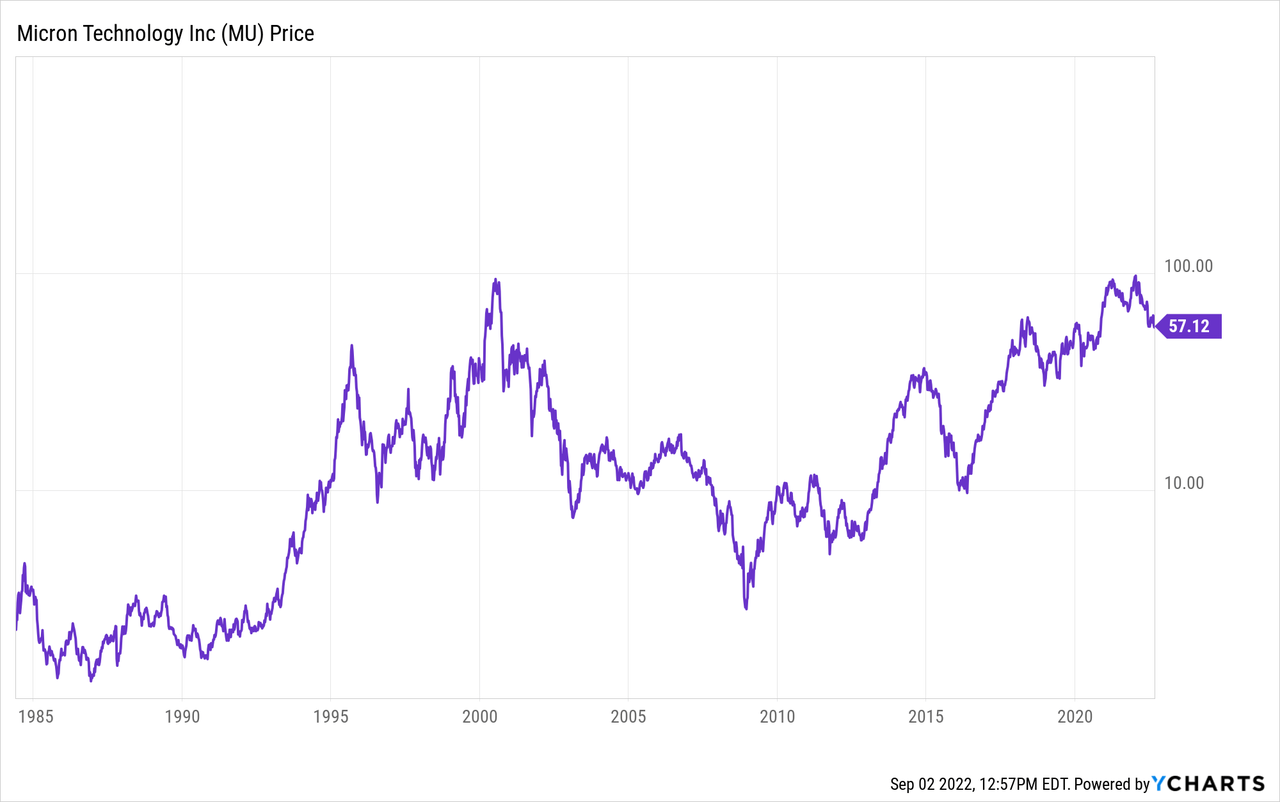
We can see in the log-scale price chart above the late-1990s super-cycle. Just for reference, these log-scale charts typically don’t have these sorts of huge upcycles so it takes a very cyclical stock like MU to have a chart like this. We could draw a line from 1990, through about 1994 all the way up to 2003 when the supercycle ended and see what a normal price trajectory would have looked like without the super-cycle.
If we move to the bottom of 2009, we have certainly had some big cycles, but the current cycle is pretty much in line with the 2015 and 2018 peaks, so I think we can treat this as a “normal” cycle for MU, which is prone to big cycles. That doesn’t mean if there is some major economic calamity that MU might not take a longer time for the price to recover than I would like. That might very well happen. But it’s not obvious to me there is a high probability of it happening and that MU’s recent high price was unrealistically high. So, I’m giving MU a passing grade on this test.
Is management corrupt or incompetent?
After owning this stock once before, I think I like management now more than ever, and they have done a great job with the business. So no problems here.
How is the company’s debt-to-equity compared to previous cycles?
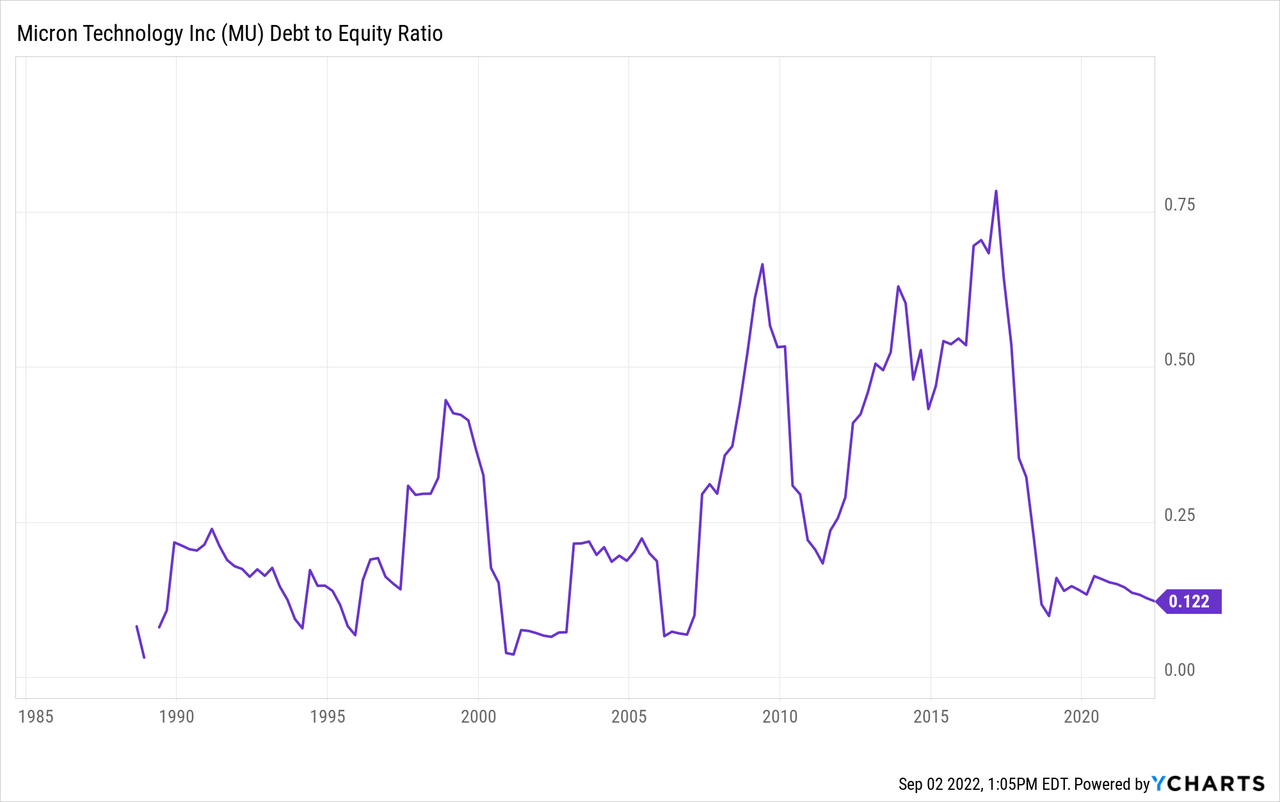
Debt-to-equity is actually extremely low for MU compared to their historical levels, so I see no problem here.
Has the price dropped enough to produce alpha in the past?
For this test, since the year 2000 decline was a supercycle, I’m going to limit my backtest to the downcycles since 2006, of which there have been 3, not including the current one. I will test both the returns one would have achieved from buying after a -50% drawdown and holding until the stock recovered its old highs, which would produce a 100% return. And then I’ll test what the returns would have been if a person bought after an -80% decline, which would produce a 400% return. I will then annualize that return and compare it to the S&P 500 if bought and sold on the same dates, annualized. The goal is to see if historically this would be an alpha-producing strategy, so the last column is the alpha produced by the investment annualized relative to the S&P 500.
| Year the Decline Started | Date of Purchase | Date of Sale | ~Months Held | ~Annualized Return | ~Annualized S&P 500 Return | ~Alpha to S&P 500 Annualized |
| 2006 | 11/15/07 | 10/7/13 | 73 | 16.44% | 2.47% | 13.97% |
| 2015 | 7/7/15 | 9/27/17 | 26 | 46.15% | 9.32% | 36.83% |
| 2018 | 12/20/18 | 11/23/20 | 23 | 52.17% | 23.28% | 28.89% |
We can see that buying after a -50% decline would have produced both very good absolute returns and also good relative returns. The quick recoveries took about 2 years, but if there is a deeper recession, they could take longer, and it took about 6 years for the price to recover if purchased in late 2007.
Next, let’s look at the returns after an -80% drawdown, which only took place during the GFC. Buying after an -80% drawdown and holding until the stock price recovered produces about a 400% simple return.
| Year the Decline Started | Date of Purchase | Date of Sale | ~Months Held | ~Annualized Return | ~Annualized S&P 500 Return | ~Alpha to S&P 500 Annualized |
| 2006 | 10/24/08 | 10/3/13 | 60 | 80% | 18.52% | 61.48% |
It took almost exactly 5 years in this case for Micron’s stock price to recover, and if an investor had bought after the -80% drawdown they would have produced 80% annualized returns compared to about 20% annualized return for the S&P 500 over the same time period. If we have another deep drawdown like this, even if I am fully invested in other stocks at the time, I would probably rotate out of one those investments and into Micron because Micron’s upside potential will be one of the best in the market.
Of course, it will probably seem like the world is ending if this happens, which is why I think it is important to mentally prepare for the possibility ahead of time and understand that it could happen. If you already bought the stock after a -50% decline and it ends up falling -80%, it’s worth noting that you will not be down -30% on your first investment, you will be down about -60%. (Imagine a stock peaks at $100, falls -50% to $50 and you buy it, but then it continues to fall to $20. The decline from $50 to $20 is a -60% decline.) So, it will be scary if this does happen, and if you want the shot at that 400% return you’ll just have to close your eyes and buy. Again, I limit deep cyclical purchases to about 1% of my portfolio, and I find that smaller size helps when purchasing volatile stocks like this.
Conclusion and Buy Prices
For investors willing to wait 5 years for a potential price recovery, Micron stock has a long history of providing good returns for medium-term investors. Micron’s price peaked this cycle at $98.45 per share. I would be willing to buy my first tranche after a -50% decline at a price of $49.23 per share. From the time I’m writing this, the price needs to drop about -12.61% more in order to hit that price. (And I think there is a very high probability this price will hit.) My second potential buy price is much deeper at $19.69, and that price has a much lower probability of occurring. Because of the lower probability, I will likely not set aside specific cash for this second purchase, but instead, will rotate out of a lower-beta or lower quality stock in order to raise cash for the deeper purchase if necessary.
Understanding the historical earnings and price cyclicality for a stock like Micron is extremely important for investors. It can be useful even for buy-and-hold or long-term investors to understand that these very deep cyclical drawdowns are totally normal for this stock, so that when they happen, the investor is less likely to get scared and sell near the bottom.
Be the first to comment