

Spencer Platt/Getty Images News
While I was net long and more bullish on the market in May-June, expecting a mild rebound into early 2023 (from excessively bearish sentiment surveys and high cash levels by traders/advisors), the late summer rally is at a critical juncture. Having reached its 1-year and 2-year moving averages, the main smaller-company index, represented by the iShares Russell 2000 ETF (NYSEARCA:IWM) should run into major price resistance. In essence, investors that didn’t get out in the spring and early summer, have a second chance to recoup about half of the losses outlined from late 2021’s Russell peak. Today’s price has entered an area of “overhead” supply, while bumping against the longer-term moving averages.
Major Resistance
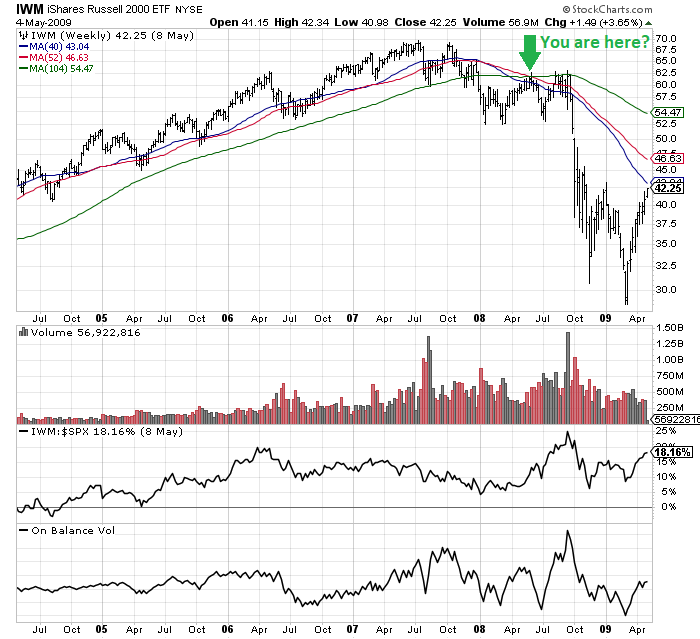
My research of past instances says the primary and widely followed, smaller capitalization Russell 2000 index has reached a do or die moment. Either price is able to break through the upper resistance of the moving averages, similar to the 2020 rebound after COVID-19 panic selling ended. Or, we could reverse sharply lower, like the 2008-09 Great Recession period, with a banking/financial crisis and complete real estate bust. Below I have drawn both potential outcomes, with greens arrows highlighting two points in history with a near identical interplay between the standard 200-day moving average, the 1-year average, and the 2-year setting for technical traders/investors.
StockCharts.com, Author Reference Points, 5-Year Chart of Weekly Trading, August 2017 to Present StockCharts.com, Author Reference Points, 5-Year Chart of Weekly Trading, May 2004 to May 2009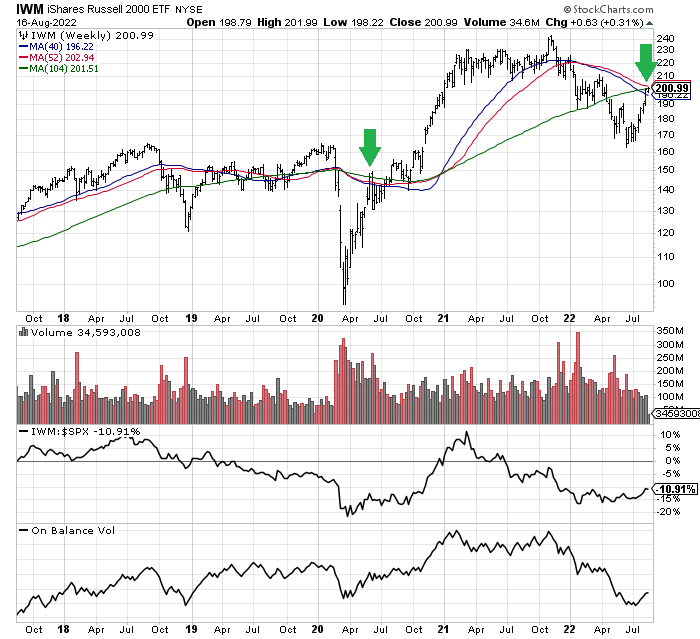
When you drill down on other indicators, I find it interesting current Russell 2000 underperformance vs. the S&P 500 and ultra-rotten decline in the weekly On Balance Volume numbers since early 2021 are actually WORSE momentum setups than either of the two previous instances of price rebounding into longer-term moving averages.
The problem is I cannot say for sure if a bullish or bearish resolution is next. Because I am a world-class skeptic, and I strongly believe interest rates could remain in an uptrend much longer than current Wall Street conventional wisdom, a further stock market breakdown with a serious economic recession like 2008 makes more logical sense to me. If this bearish outcome is next, smaller companies should “lead” the market lower in percentage losses, as is typical during recessions.
The scary review of 2008 through March 2009 is the Russell 2000 fell -50% from the same location on today’s chart. We are sitting 9 months after the November 2021 peak, just like the 9-month time span following the July 2007 top. So, calling the bear market of 2022 over (which is a popular forecast this week in the mainstream media) could be a little premature.
One conclusion does seem probable for short-term trading action direction. A period of consolidation to lower prices may be next for the remainder of August into September, before the prospects for major new price gains improve. In other words, the longer-term moving averages should provide stiff resistance to price gains for weeks or even months, using history as our guide.
Long-Term Risks Remain
With hard money gold/silver and banks/financial enterprises failing to rise materially over the last couple of months, I do not see the trend-change confirmation for liquidity expansion commonly witnessed at past stock market bottoms. I am getting more nervous each passing day that a big downturn for U.S. bond and equity markets cannot be ruled out.
For sure, the economy and Wall Street will not be able to handle additional black swan events. For example, a semiconductor/technology supply shock caused by a Chinese invasion of Taiwan, or a new Middle East war erupting that slashes global oil/gas supplies beyond the Russia/Ukraine war mess, would be problematic for an already weakened economy. Either would push the U.S. into deep recession quickly.
With the stock market’s total value to GDP still hovering near record highs, plenty of potential downside exists. Today’s 173% ratio remains almost DOUBLE the 40-year average, TRIPLE the early 2009 low, and well above the 2020 pandemic panic reading of 105%.
MacroMicro Website, U.S. Market Cap to GDP, 1980-Present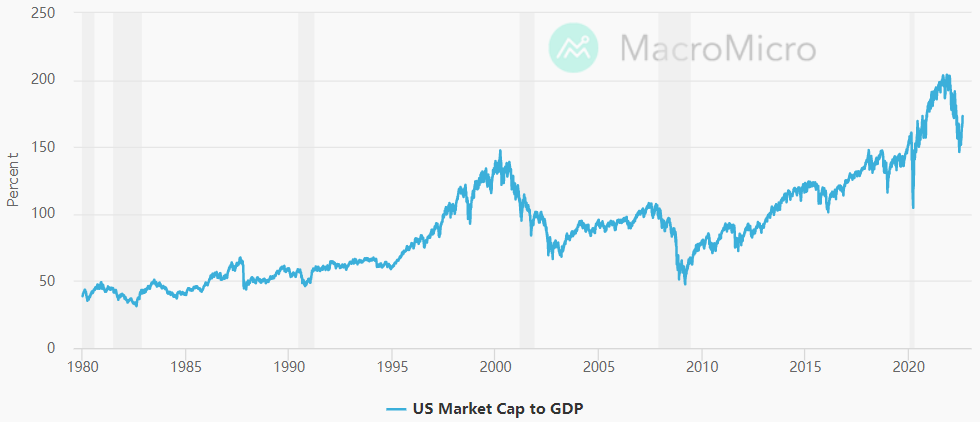
Trading Strategies
The bottom line is I am not nearly as optimistic/bullish on the market’s direction as I was months ago. Upside is likely limited to +10% over the next 12 months, unless a soft landing for the economy (no serious recession) with falling interest rates is about to play out. Potential stock market downside is easily in the -20% to -30% range given a recession and spike in unemployment that craters consumer spending. A move to new lows, perhaps far weaker than the low trades in June, is possible if not likely. Lastly, in a worst-case new black swan scenario, a -40% or greater bust (like 2008-09) has small odds of occurring.
I am modeling the best market zig-zag for bullish investors (to fool the greatest number of investors and analysts) would be a sharp turn lower during September, with a successful retest of the June lows. After that price dump (with fears of October crashes sprinkled across the financial press), a flat to higher market trend may resume, especially if oil/gas prices decline in the coming weeks. Other scenarios are definitely in play.
To me, the immediate outlook favors reduced equity and bond holdings. Depending on your age and risk tolerance, equity weightings of 30% to 60% in your brokerage account will help cushion the resumption of a bear market. I wrote an explanation days ago here of my doubts regarding the Fed’s lackluster inflation fight. Cash and money market investments with rising yields to match Fed rate increases should be a larger-than-normal holding (with the full return of capital all but guaranteed), in my opinion until the dust settles. Political divisions and Trump-centered chaos in America may also create exaggerated market swings through the November election.
10% to 20% weightings in gold/silver bullion and miners will eventually work wonders for portfolio returns, particularly if a deep recession hits. At the very least, stay diversified owning hard assets like real estate and commodities outside of the stock market. If you want to keep your portfolio fully invested in equities, please use hedges like short/inverse ETFs, direct short selling, and/or index put options to reduce net exposure. Avoiding major swings lower in portfolio value should be a core goal into 2023.
Thanks for reading. Please consider this article a first step in your due diligence process. Consulting with a registered and experienced investment advisor is recommended before making any trade.
Be the first to comment