

PhonlamaiPhoto/iStock via Getty Images
The latest earnings report from Ichor Holdings (NASDAQ:ICHR), a supplier of fluid delivery subsystems used in semiconductor manufacturing equipment, had its thunder stolen when ICHR pre-announced on January 10. Not only did ICHR lower its guidance, but the numbers suggest ICHR stock has entered a major downturn. However, the stock has shrugged it off. While there was an initial drop, the stock has rallied higher nonetheless, although the stock may be running out of steam. Why will be covered next.
Business is slowing down fast
The stock got a jolt when ICHR announced on January 10 that it would not be able to meet its previously stated guidance for Q4 due to weaker-than-expected demand, especially in the memory market. As a result, ICHR lowered its Q4 guidance to $300-302M. In comparison, the original Q4 guidance called for revenue of $315-355M as shown in the table below. ICHR also gave an early preview into Q1 FY2023 with expected revenue of $210-240M, way below the consensus estimate of $297M.
|
(GAAP) |
Q4 FY2022 (Guidance) |
Q4 FY2021 |
YoY (Midpoint) |
|
Revenue |
$315-355M |
$287.2M |
16.64% |
|
GAAP EPS |
$0.57-0.83 |
$0.51 |
37.25% |
|
Non-GAAP EPS |
$0.80-1.04 |
$0.90 |
2.22% |
The actual Q4 report thus did not take the market by surprise on February 7 as the numbers were pretty much as expected due to the pre-announcement. Q4 revenue increased by 5% YoY to $301.7M, but also by minus 15.2% QoQ. GAAP EPS declined by 51% QoQ and by 3.9% YoY to $0.49. Non-GAAP EPS declined by 41% QoQ and 20% YoY to $0.72. The table below shows the numbers for Q4 FY2022.
|
(GAAP) |
Q4 FY2022 |
Q3 FY2022 |
Q4 FY2021 |
QoQ |
YoY |
|
Net sales |
$301.720M |
$355.643M |
$287.188M |
(15.16%) |
5.06% |
|
Gross margin |
16.2% |
17.9% |
16.4% |
(170bps) |
(20bps) |
|
Operating margin |
6.0% |
9.2% |
5.7% |
(320bps) |
30bps |
|
Operating income |
$18.015M |
$32.547M |
$16.345M |
(44.65%) |
10.22% |
|
Net income |
$14.197M |
$29.031M |
$14.859M |
(51.10%) |
(4.46%) |
|
EPS |
$0.49 |
$1.00 |
$0.51 |
(51.00%) |
(3.92%) |
|
(Non-GAAP) |
|||||
|
Net sales |
$301.720M |
$355.643M |
$287.188M |
(15.16%) |
5.06% |
|
Gross margin |
16.7% |
18.0% |
17.1% |
(130bps) |
(40bps) |
|
Operating margin |
8.9% |
11.6% |
10.7% |
(270bps) |
(180bps) |
|
Operating income |
$26.900M |
$41.271M |
$30.602M |
(34.82%) |
(12.10%) |
|
Net income |
$21.005M |
$35.354M |
$26.245M |
(40.59%) |
(19.97%) |
|
EPS |
$0.72 |
$1.22 |
$0.90 |
(40.98%) |
(20.00%) |
Source: ICHR
If the Q4 numbers are out, then so too are those for the whole year. FY2022 revenue increased by 16.7% YoY to $1,280M. GAAP EPS increased by 2.45% YoY to $2.51 and non-GAAP EPS increased by 7.42% YoY to $3.62. ICHR finished FY2022 with total debt of $303M, partially offset by $86M in cash on its balance sheet. All in all, FY2022 was a productive year for ICHR. The top and the bottom line reached new peaks.
|
(GAAP) |
FY2022 |
FY2021 |
YoY |
|
Net sales |
$1,280.069M |
$1,096.917M |
16.70% |
|
Gross margin |
16.6% |
16.2% |
40bps |
|
Operating margin |
6.7% |
7.4% |
(70bps) |
|
Operating income |
$85.823M |
$81.014M |
5.94% |
|
Net income |
$72.804M |
$70.899M |
2.69% |
|
EPS |
$2.51 |
$2.45 |
2.45% |
|
(Non-GAAP) |
|||
|
Net sales |
$1,280.069M |
$1,096.917M |
16.70% |
|
Gross margin |
17.0% |
16.7% |
30bps |
|
Operating margin |
9.8% |
10.7% |
(90bps) |
|
Operating income |
$125.730M |
$116.937M |
7.52% |
|
Net income |
$104.863M |
$97.698M |
7.33% |
|
EPS |
$3.62 |
$3.37 |
7.42% |
But things are changing fast. The slowdown that started in Q4 is expected to accelerate. The guidance calls for Q1 FY2023 revenue of $210-240M, a decline of 25.4% QoQ and 23.2% YoY at the midpoint. The forecast expects GAAP EPS of ($0.03)-0.16, a decline of 86.7% QoQ and 76.8% YoY at the midpoint, and non-GAAP EPS of $0.19-0.37, a decline of 61.1% QoQ and 60% YoY at the midpoint. So clearly the numbers are heading downhill. The difference between Q3 FY2022 and Q1 FY2023, a span of just two quarters, is stark.
|
(GAAP) |
Q1 FY2023 (Guidance) |
Q1 FY2022 |
YoY (Midpoint) |
|
Revenue |
$210-240M |
$293.1M |
(23.23%) |
|
GAAP EPS |
($0.03)-0.16 |
$0.28 |
(76.79%) |
|
Non-GAAP EPS |
$0.19-0.37 |
$0.70 |
(60.00%) |
However, ICHR countered the expected decline in the quarterly numbers by calling for a bottom in the first half of 2023 and possibly even as soon as Q1. The second half is expected to be better compared to the first half. From the Q4 earnings call:
“So at this stage, and I think given our visibility, we kind of see the two quarters relatively the same, I would say, if we – it depends on what was in Q1. If things pull forward, then maybe it moderates down. If things flatten a little, maybe it moderates up or something. But we see them pretty similar right now. So we see the first half is the low point. And whether I can call it Q1 or Q2 exactly now I can’t, but I think they’re very close and very similar.”
A transcript of the Q4 FY2022 earnings call can be found here.
ICHR also suggests in its FY2023 outlook that the wafer fab equipment or WFE market will contract by 20-25%. ICHR’s own sales are predicted to outperform the WFE market by 5%, suggesting sales will decline by 15-20% in FY2023, which would put FY2023 revenue around $1024-1088M.
“Well, I’d say we see the market down 20% to 25%. So, maybe when I talked about the outperformance of 5%, it’s really around – that includes the EUV lithography performance, market share gains in that. So, it depends on where the market ends up, but we think we’ll be about five percentage points better based on some of that, the IMG side of the business that isn’t floating down and things like that.”
ICHR was thus able to take out some of the sting in the latest report. While the forecast acknowledges a pretty steep drop in earnings in Q1, it also suggests things won’t get much worse than that. There’s a downturn underway, but it is projected to be a relatively short and modest one.
ICHR is priced for a fairly quick recovery
The latest outlook has led to earnings revisions. Consensus estimates now expect ICHR to post non-GAAP EPS of $1.30-1.55 in FY2023, a decline of 57.2-64.1% YoY, with most of the earnings coming in the second half of the year. Estimates also predict non-GAAP EPS of $2.28-2.85 in FY2024, which is only 21.3% less than what ICHR earned in FY2022 at the high end. In other words, ICHR is expected to begin the process of recovering from the downturn in the second half and make its way up thereafter.
Valuations have also been affected. For instance, as recently as late 2022, ICHR traded in the low teens in terms of forward GAAP earnings. It’s now in the seventies after ICHR lowered its outlook after Q4. Keep in mind that this assumes a rebound in the second half. If, for instance, earnings do not recover as expected and stay at around Q1’s level, then the actual multiple goes up into the triple digits.
In contrast, ICHR has a trailing P/E of 14.26 due to record GAAP EPS of $2.52 in FY2022, which shows you how much earnings are expected to drop in the next 12 months. In comparison, the median in the sector is for a multiple of 24-25. It’s therefore important that ICHR recovers as quickly as predicted from the current downturn because while a P/E ratio in the teens is likely to be acceptable to most, a ratio in the seventies is much less so. The table below shows some of the multiples ICHR trades at.
|
ICHR |
|
|
Market cap |
$1.03B |
|
Enterprise value |
$1.29B |
|
Revenue (“ttm”) |
$1,280.1M |
|
EBITDA |
$123.4M |
|
Trailing GAAP P/E |
14.26 |
|
Forward GAAP P/E |
70.54 |
|
PEG ratio |
5.82 |
|
P/S |
0.80 |
|
P/B |
1.76 |
|
EV/sales |
1.01 |
|
Trailing EV/EBITDA |
10.44 |
|
Forward EV/EBITDA |
15.95 |
Source: Seeking Alpha
The rally may be running out of steam
ICHR is in a downturn that will see its earnings slashed, but the recovery could begin as soon as Q1 and no later than Q2 if the outlook is right. The market has thus looked past the most recent quarterly numbers, which were undoubtedly bad. The stock has benefited from the market looking forward to better times that are supposed to be not too far away.
The stock has thus gained 31% YTD, despite the bad Q4 results and even worse Q1 guidance. ICHR has actually done even better than most semis. For instance, the iShares PHLX Semiconductor ETF (SOXX) has gained 20% YTD in comparison. That’s fairly impressive considering the recent quarterly numbers were nothing to write home about. The chart below shows how the stock has rallied recently.
finviz.com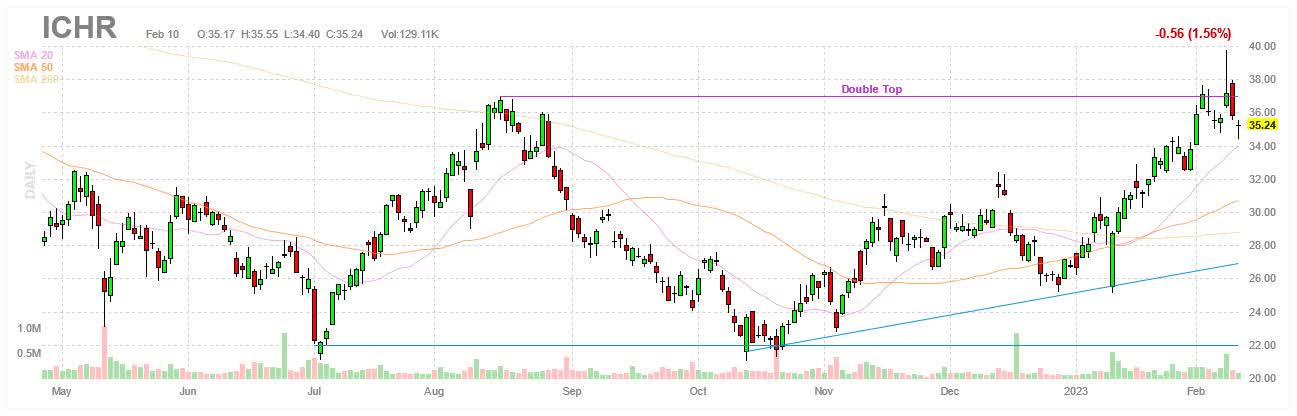
However, the stock seems to be having trouble going higher. Note how the stock has been having problems getting through the $36-38 region all throughout February. There have been multiple attempts to break through, but all have been rejected. This suggests the presence of resistance, especially since the aforementioned region also happens to be where the stock previously topped out in August of last year.
The stock has essentially gone sideways, the recent rally notwithstanding. The stock could be in the process of forming a horizontal channel, assuming the stock has topped out and does not proceed to break resistance in the $36-38 region. The recent lows were reached in the same price region, as did the recent highs. Both can be connected by horizontal trendlines. This could present an opportunity for those interested in price floors and price ceilings.
The existence of a channel makes it relatively easy to determine suitable entry and exit points. If the stock is near the upper bound of the channel, as it is right now, the stock can be sold. If the stock goes back to the lower bound, close to $21-23, then the stock can be bought. This process can be repeated as long as the channel exists.
Investor takeaways
I remain neutral on ICHR as stated in a previous article. As suggested in the article from November, the stock was likely to keep rallying after posting what looked like a double bottom, a bullish signal. This turned out to be correct as the stock has rallied towards the end of the year and into the new year. The stock has now gained 67% after hitting an intraday low of $21.04 on October 13, which is within pennies of the July intraday low of $21.08.
The article also noted that the stock proceeded to gain 66% after the July low before topping out and turning in the other direction. The stock has now gained about that amount and it looks to be topping out with resistance in the way. If the chart patterns repeat, the stock may be heading down, possibly back to the $21-23 region where it bottomed on two previous occasions. If charts are worth paying attention to, then they are suggesting that the time has come to move to the sidelines, even though the stock has outperformed with a gain of 31% YTD.
There is another reason to become cautious. The rally has been supported by a relatively optimistic outlook that calls for an imminent bottom, which negated the major deterioration in the top and the bottom line underway. However, if it turns out that the forecast needs to be revised, something that ICHR was already forced to do to its original guidance due to weaker-than-expected market conditions, the market may come to the realization that ICHR is trading at some fairly high multiples and the stock price needs to be adjusted accordingly.
Bottom line, the stock has done great thus far, but there are several reasons why caution is warranted. The chart patterns suggest the stock is heading lower next. The market has ignored the deterioration in market demand, earnings, and valuations, but this could easily change if the current forecast from ICHR turns out to be way off, something that has happened before. Take all of the above and you begin to see why there is a need to go to the sidelines.
Be the first to comment