

David Ramos
IBM (NYSE:IBM) and Cisco (NASDAQ:CSCO) are two of the largest tech companies in the world with a combined MV (Market Value) of more than $325 billion. They also have the distinction of being around for multiple decades which is a long, long time compared to some of the better-known tech stocks like Zoom and Twitter.
IBM has been around for almost 100 years beginning in 1924 while Cisco began its long climb to prominence 39 years ago in 1984.
Their price performance over the last year has been very different with IBM being up by 25% versus Cisco’s decline of 11%.
Seeking Alpha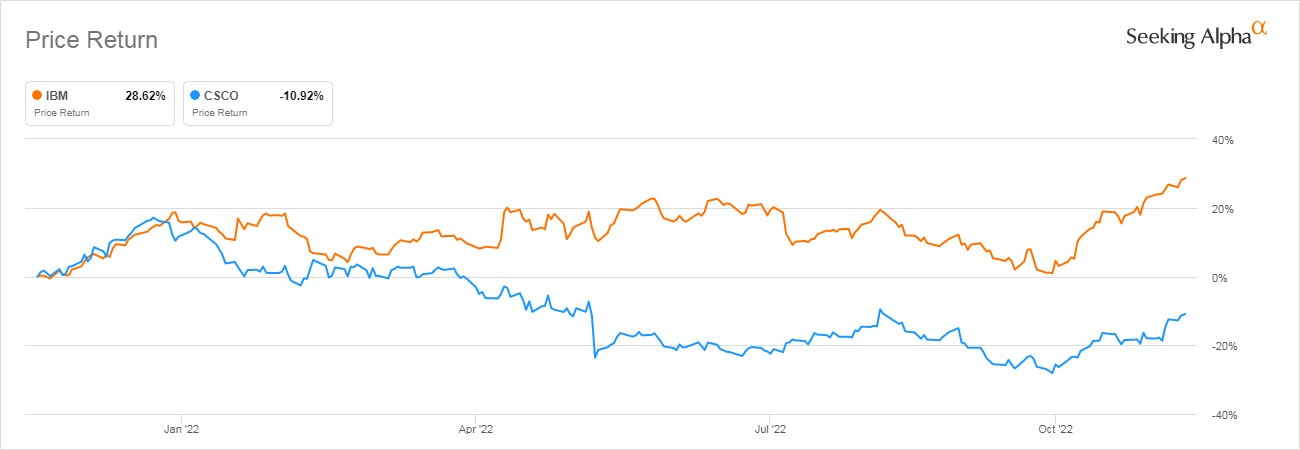
Unlike many tech companies, both companies have been paying dividends for decades and have the cash flow to continue indefinitely in the future. But which one would be the best dividend choice right now?
In this article, I will analyze these two old tech giants to determine which one is the best buy for dividend-seeking investors.
Financial metrics
A major part of the decision-making process in selecting dividend stocks is the company’s future viability. How likely are they to have the financial ability to at least keep the current dividend intact and better yet increase it each year going forward?
When we look at the financial metrics comparing the two companies on a TTM (Trailing Twelve Month) basis, several metrics should be noted. The first one is the Price/Sales ratio (Line 3) which shows IBM with a ratio 40% lower than Cisco’s ratio. This could imply that IBM is a better value than Cisco.
The Gross Margin % (Line 5) for both companies is large with Cisco winning at 63% to 54%. Large margins such as these indicate both companies have the potential to generate huge cash flows and subsequently dividends. But based on GM to Market Value Percentage (Line 8), IBM’s margin is much higher than Cisco’s 25% to 17%. Again, this may indicate that IBM is a better value based on market value.
Looking at the P/E Ratio (Line 11), Cisco looks a bit better with a PE Ratio of 13.8 compared to IBM’s higher ratio of 16.6.
When it comes to Debt/EBITDA (Line 14), Cisco looks much better with a negative ratio of -.8 versus IBM’s 2.9, indicating that Cisco actually has more cash than debt. Another factor not included in the net debt calculation is IBM’s pension liability of $12 billion versus none for Cisco. If I included the pension liability in the net debt calculation IBM’s ratio would be much higher at 3.9x.
Seeking Alpha and author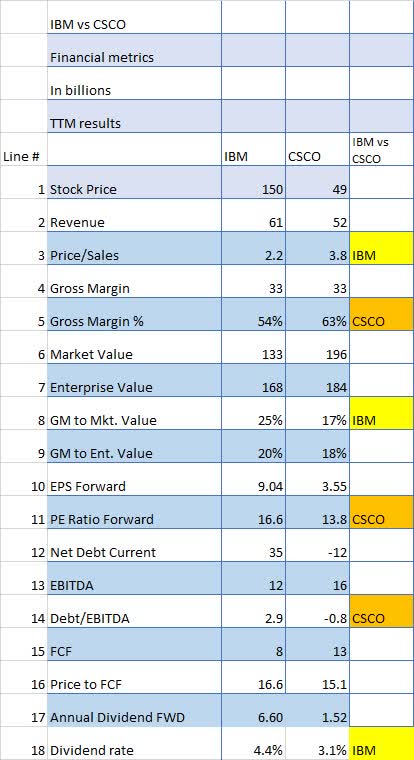
Price to free cash flow (Line 16) is relatively the same with IBM at 16.6 versus Cisco’s 15.1.
And finally, the dividend rate (line 18) is higher for IBM at 4.4% compared to Cisco’s 3.1%.
When looking at the Financial Metrics in total, both companies are solid cash flow generators but Cisco’s impressive Net Debt position gives it a distinct advantage.
Based on financial metrics, CSCO is the winner.
Wall Street analyst ratings show Cisco is better liked, but the quant community does not seem to be enamored with either company
Wall Street analysts appear to have relatively strong feelings for Cisco, with Wall Street plus Seeking Alpha analysts combined showing 20 Buys and only 1 Sell. IBM is almost as good, with 9 Buy recommendations and only 2 Sells.
Seeking Alpha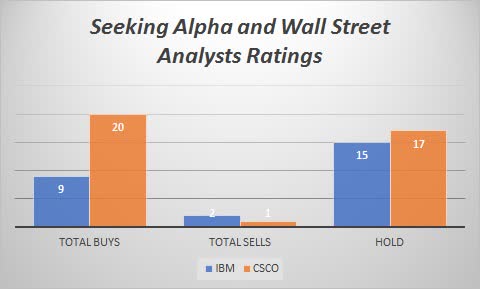
Quant ratings over the last year are different, showing nothing but Hold ratings for both IBM and Cisco over the entire time period.
Seeking Alpha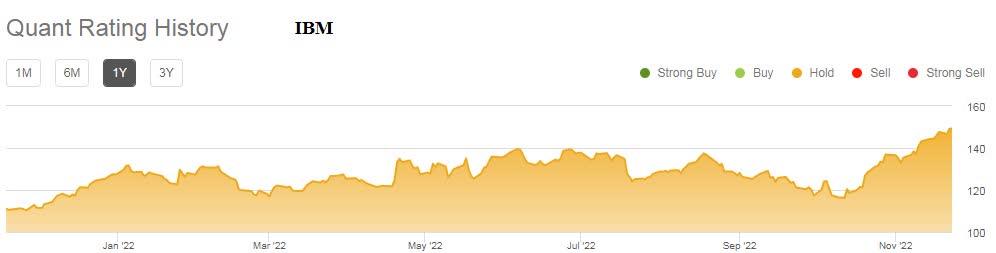
Seeking Alpha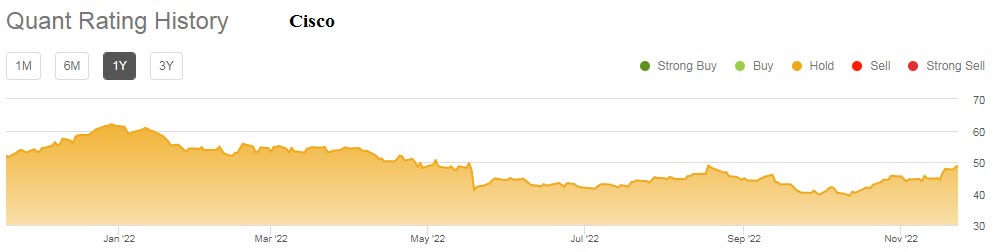
So quants seem to be neutral on both IBM and Cisco.
Keep in mind that quant ratings have little to do with whether a company is a good dividend stock, especially over the long term.
IBM did much better in the last recession than Cisco
If you’re concerned, as I am, of a looming recession in the next year or 18 months, knowing how a company did in the last recession can provide some investment insight.
December 2007 through June 2009 is the last recognized recession period, and IBM on a total return basis (including dividends) actually went up slightly at 6% while Cisco showed a 29% decrease in price.
So, based on the following chart, IBM performed much better in the last recession than Cisco did.
Seeking Alpha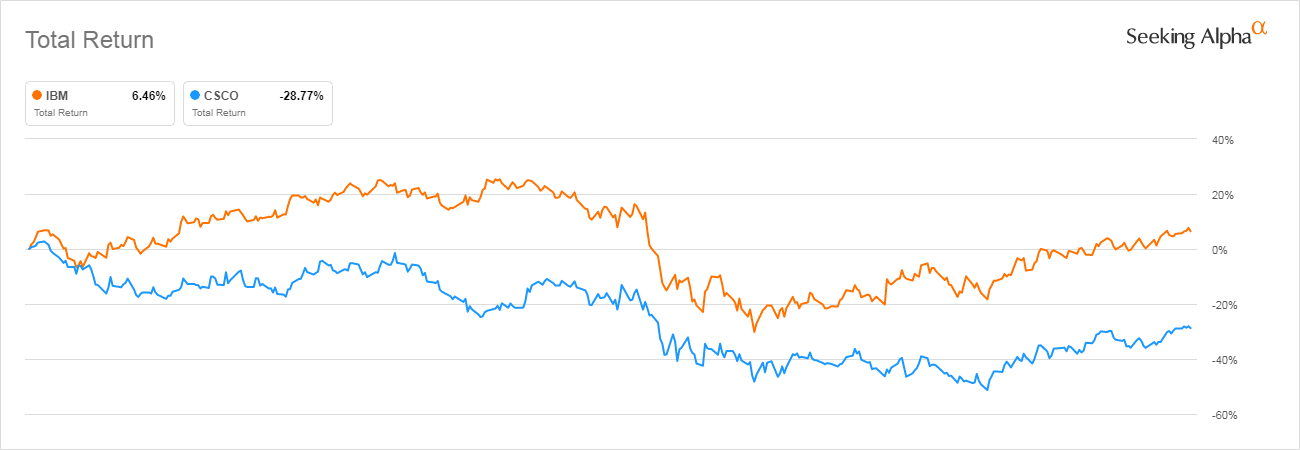
Dividends and share buybacks.
IBM has raised its dividend for 23 years in a row, a commendable record. Looking at the 5-year dividend chart below we can see that IBM has raised its dividend from $6.21 to $6.59 per year an increase of 6%.
Seeking Alpha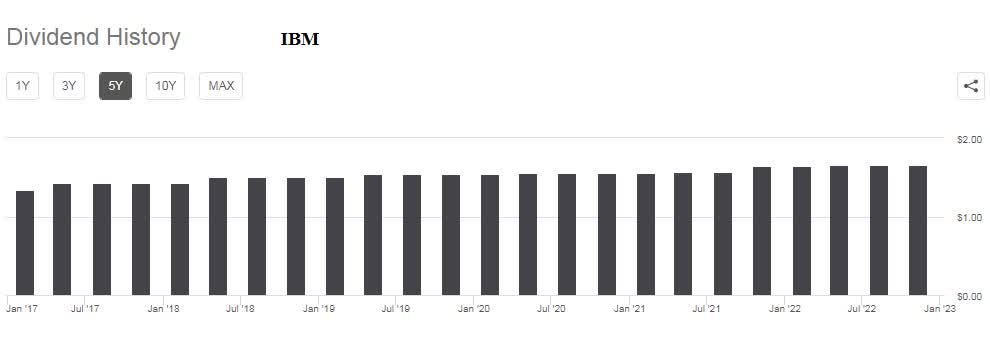
On the other hand, Cisco has done even better, raising its dividend by 18% over the same 5-year period.
Seeking Alpha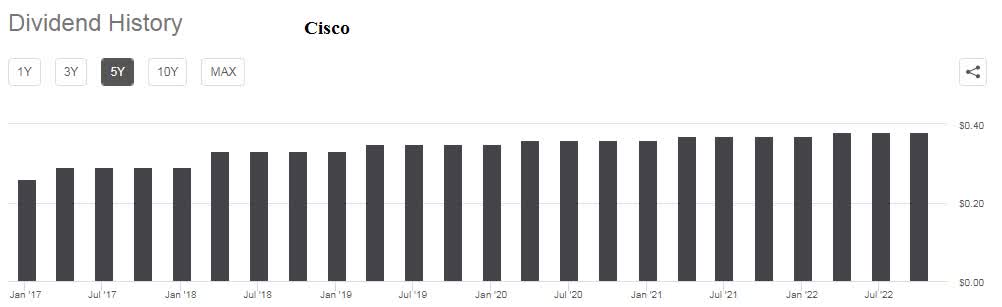
So, if you’re looking for a steady, consistently increasing dividend, either company is an excellent choice.
Share repurchases add to the stability of the dividend because fewer shares mean more dividends per share even if you pay out the same gross dollar amount.
When it comes to share repurchases, both companies have purchased more than 20% of their shares back in the last 10 years. However, in both cases, share repurchases have slowed considerably over the last 3 years.
To see more detail on both companies’ buyback authorizations go here.
Seeking Alpha and author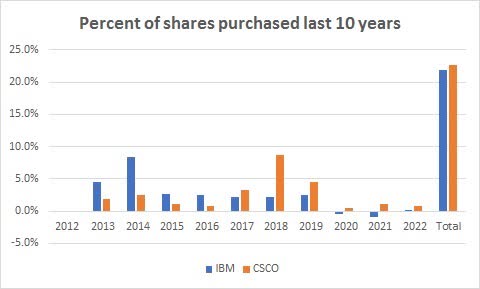
The dividend and share repurchase advantage goes slightly to Cisco.
Risks
Large, old tech companies tend to be much more stable than newer stocks such as Zoom and Twitter. But they are not immune to downdrafts as the following 10-year price chart shows.
Seeking Alpha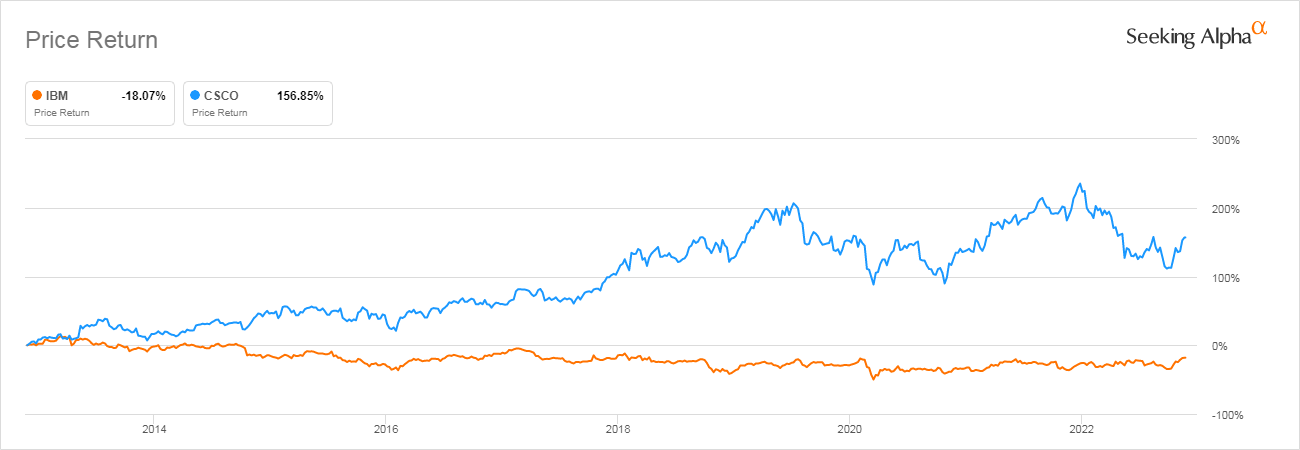
In a volatile environment like we’re facing now, cash is also a viable alternative. CD rates are now in excess of 4% a number we haven’t seen literally in years.
In addition, there could be a recession coming or even a depression according to several economists. That may make profits elusive at best and provide losses at worst.
So please, do your own due diligence on every investment option.
Conclusion
When making decisions about dividend stocks one of the main considerations has to be how long you plan on holding the stock. Obviously, we know from the dividend paragraph above that IBM has increased its dividend for 23 years in a row. Cisco is not bad at 11 years in a row.
Comparing IBM and Cisco over the last five years on the basis of Total Return (including dividends) shows a difference in returns, with IBM up 30% and CSCO up 53%. But that difference would be much larger if not for IBM’s dividend policy.
Seeking Alpha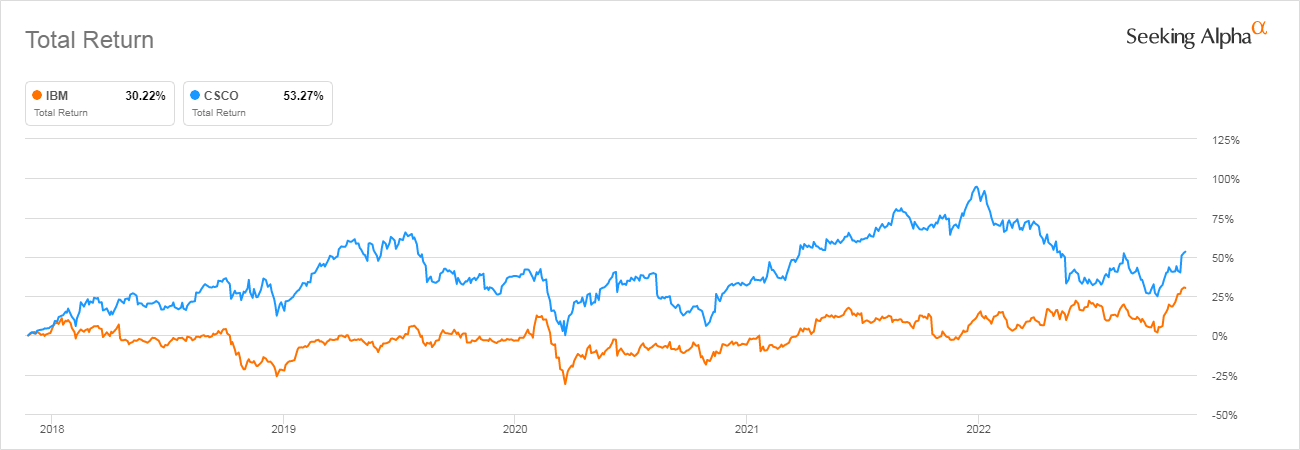
However, comparing Total Return only for the last one-year period, IBM has outperformed CSCO by 34% to 9%. So in the recent past, you would have received a higher dividend with IBM and a larger capital gain with IBM.
Seeking Alpha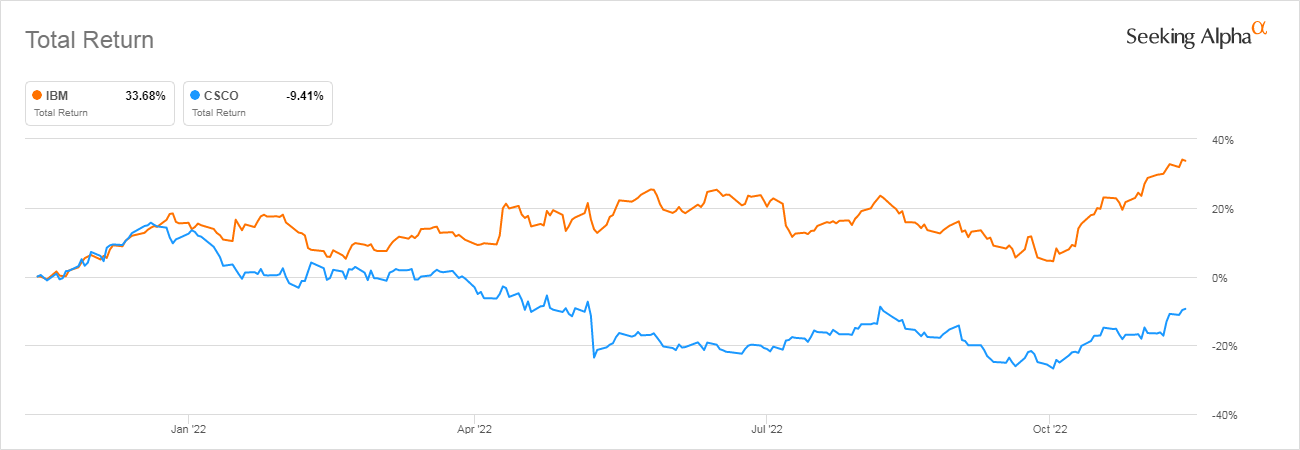
Looking at these two companies, I see CSCO as being better on the financial metrics, mainly because of a lower P/E ratio, lower Debt/EBITDA ratio, and higher dividend. But IBM has been performing better over the last year.
Based upon the above analysis, IBM is a Buy, and Cisco is a Hold.
Be the first to comment