

Oat_Phawat
Introduction
Canada-based IAMGOLD Corporation (NYSE:IAG) reported the second quarter of 2022 on August 3, 2022.
Note: I have followed IAG quarterly since 2014 with 49 articles and counting. This new article is a quarterly update of my article published on June 14, 2022.
1 – 2Q22 results snapshot
The company recorded $334.0 million in revenues and posted a loss per share of $0.02 with a net loss of $9.6 million. The adjusted net loss was a $0.01 per share loss.
Attributable Production for 2Q22 was 170K Au oz compared to 139K Au oz produced in 2Q21.
1.1 – 2Q22 Presentation Highlights
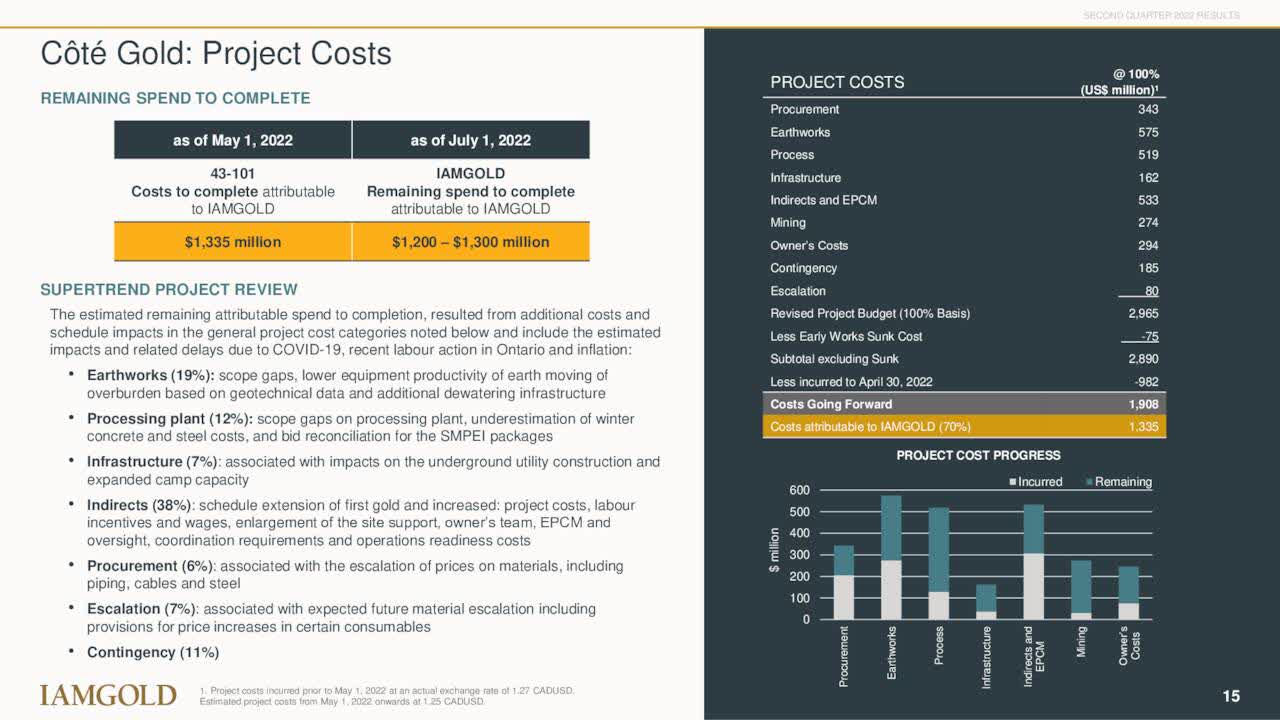
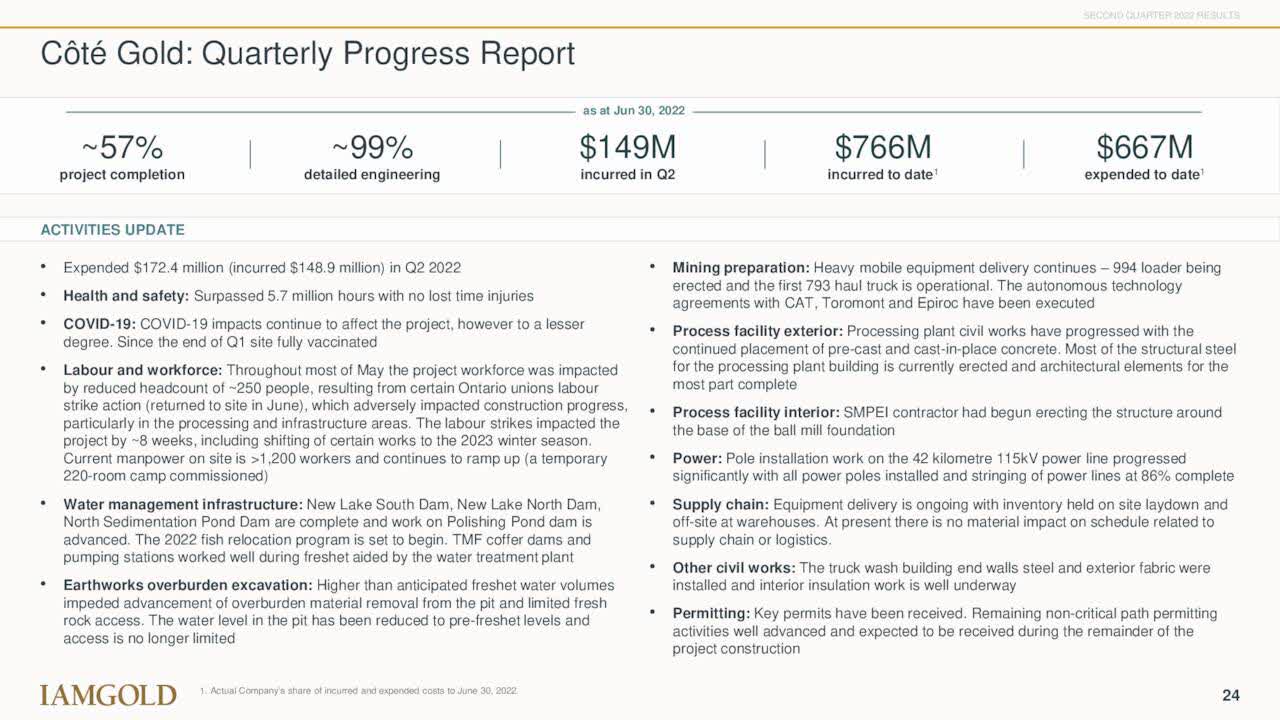
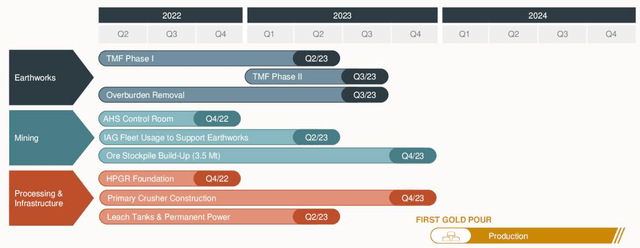
IAG 2Q22 highlight (Iamgold Presentation) 1.2 – Côté project discussion The company currently estimates that its share of the remaining Côté project CapEx to completion as of July 1, 2022, is approximately $1,200 to $1,300 million. Inflationary pressure is now biting. IAG inflationary cost breakdown (IAMGOLD Corp.) The company said that the remaining attributable spend to completion resulted from additional costs and schedule impacts in the general project cost categories, including the effects estimated and related delays due to COVID-19, recent labor action in Ontario, and inflation. IAG Cote Gold project costs (IAMGOLD presentation) CapEx continues to be high due to the Côté Gold project, with 57% overall project completed and 99% detailed engineering achieved by the end of June. IAG spent $148.9 million in 2Q22 and $766 million to date (construction commenced in 3Q20). Below is a complete report as of June 30, 2022: IAG Cote Gold progress report (Iamgold presentation) The higher CapEx severely affected the stock price, which dropped to a record low. However, the first gold pour is now delayed to 4Q23, and commercial production starts in 1Q24. Here are some numbers to grasp the Côté Gold: Mine life of 18 years with initial production expected in early 2024; Average annual production of 495k ounces (320,500 ounces attributable) during the first six years following commercial production and 365k ounces (236,000 ounces attributable) over the LOM; LOM average cash costs of $693 per ounce gold (“/oz Au”) sold, and all-in sustaining costs (“AISC”) of $854/oz Au sold; Côté Gold LOM plan is based on Mineral Reserves of 7.2 million ounces. We are faced with a four to five months delay due to COVID absenteeism, weather, lower contractor productivity rates, and the impact of the batch plant fire. IAG new schedule for Cote Gold Presentation (IAMGOLD corp.) So far, no financing has been disclosed for the project, but the company may need external funding in 2023, which could further affect the stock price. Interim CEO Maryse Belanger said in the conference call: Given the strategic importance of Côté to achieve our goal of becoming a leading high margin gold producer, we are actively pursuing various alternatives to increase liquidity to deliver Côté on its updated schedule. I am confident we will address the near-term challenges in order to advance Côté and better position IAMGOLD as a more resilient, agile company for the current environment.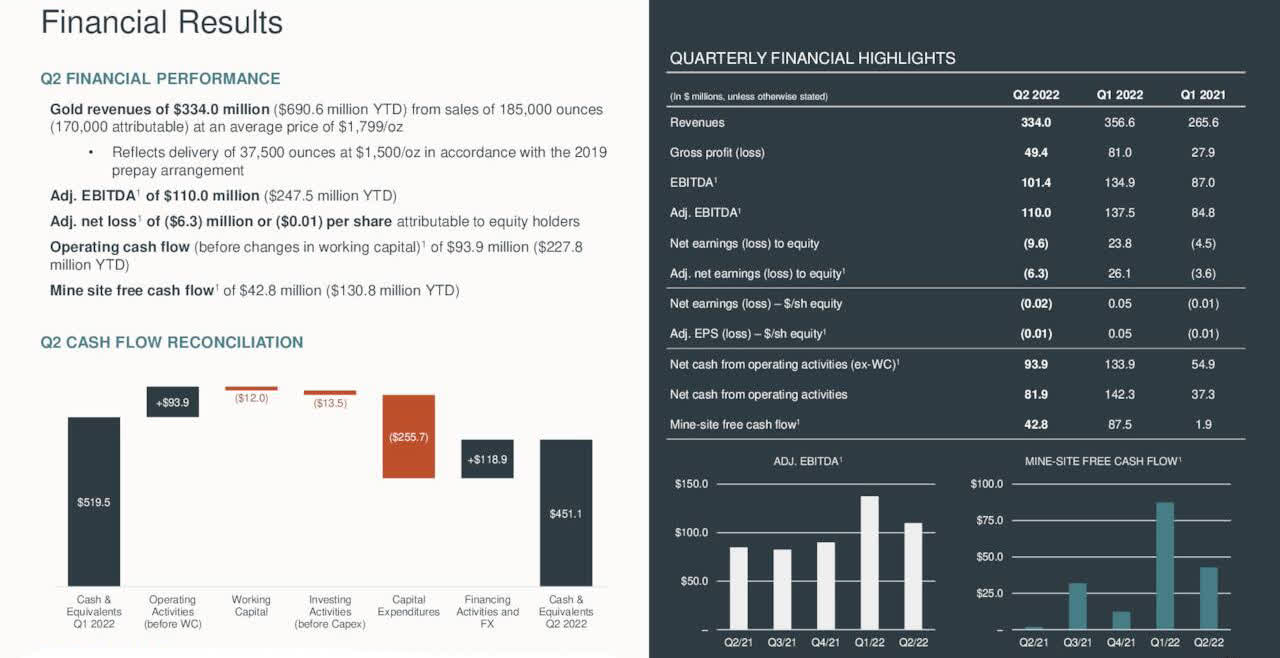
2 – Stock performance
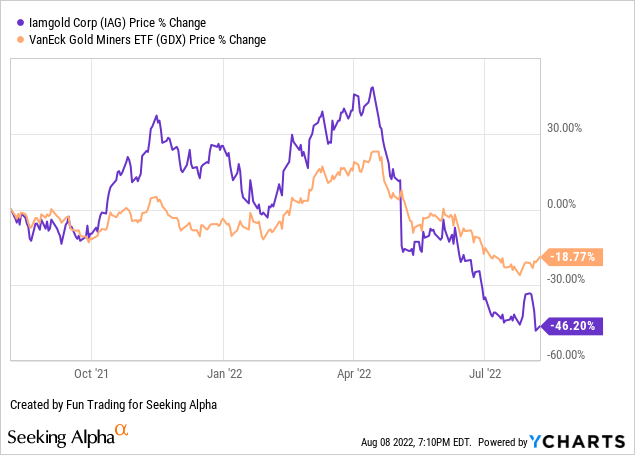
IAMGOLD dropped precipitously in early May and is now down 46% on a one-year basis, underperforming the GDX and most of its peers. The news related to Cote Gold has been highly caustic for the stock.
3 – Presentation
IAMGOLD is a mid-tier gold mining company operating in three regions: North America, South America, and West Africa.
The company also owns the Côté Gold construction project in Canada and the Boto Gold development project in Senegal. The flagship mine Essakane in West Africa represents 62.9% of the company’s total output in 1Q22.
IAG Quarterly Production 1Q22 versus 2Q22 per mine (Fun Trading)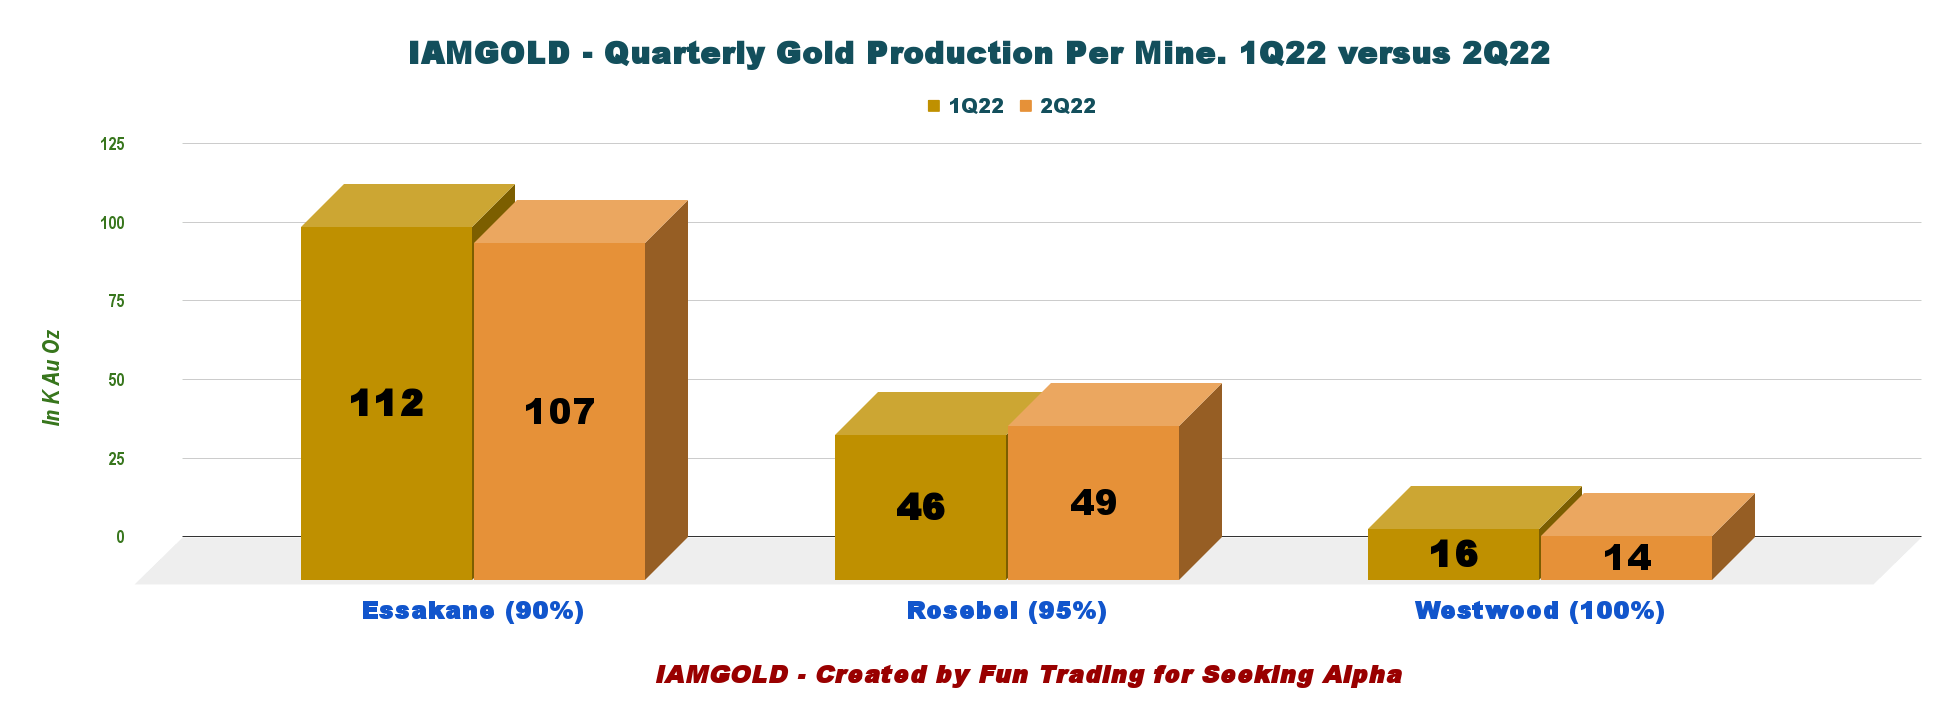
4 – Investment thesis
The investment thesis for IAG is a problematic one. If you decide to invest in IAG now, with a stock price almost at its all-time low, it is because you believe that the company will be able to complete the Côté Gold project at the end of next year. It is a massive project that will generate an enormous increase in gold production starting in early 2024.
There is also tremendous potential for future expansion with the Gosselin deposit, located immediately adjacent to the Côté pit containing 3.4 Moz in Indicated Mineral resources and an additional 1.7 Moz in Inferred Resources.
However, if you lack confidence in IAG and feel the risk level is too high due to a significant CapEx required to complete Côté Gold, then I suggest trading the stock exclusively.
Hence, I recommend trading about 80% of your short-term LIFO and keeping a small core long-term position for a much higher target. Trading LIFO is the most adapted strategy that allows you to profit while waiting for a significant uptrend.
IAMGOLD Corp. – Financial Snapshot 2Q22 – The Raw Numbers
| IAMGOLD | 2Q21 | 3Q21 | 4Q21 | 1Q22 | 2Q22 |
| Total Revenues in $ Million | 265.6 | 294.1 | 294.6 | 356.6 | 334.0 |
| Net Income in $ Million | -4.5 | -75.3 | -194.1 | 23.8 | -9.6 |
| EBITDA $ Million |
86.2 |
15.8 |
-187.2 |
134.9 |
100.1 |
| EPS diluted in $/share | -0.01 | -0.16 | -0.40 | 0.05 | -0.02 |
| Operating Cash flow in $ Million | 37.3 | 78.5 | 67.5 | 142.3 | 81.9 |
| Capital Expenditure in $ Million | 161.1 | 139.1 | 266.8 | 169.1 | 270.0 |
| Free Cash Flow in $ Million | -123.8 | -60.6 | -199.3 | -26.8 | -188.1 |
| Total cash $ Million | 829.8 | 748.3 | 552.5 | 524.4 | 452.9 |
| Long-term Debt in $ Million | 456.5 | 466.8 | 464.4 | 463.3 | 612.0 |
| Shares outstanding (diluted) in Million | 476.6 | 476.8 | 476.8 | 482.4 | 478.9 |
Data Source: Company release
Gold Production And Balance Sheet Details
1 – Revenues were $334.0 million in 2Q22
IAG Quarterly Revenues history (Fun Trading) For the second quarter ended June 30, 2022, quarterly revenues came in at a record $334.0 million, up 25.8% from the same quarter last year. Net cash from operating activities for the second quarter of 2022 was $81.9 million, a decrease of $60.4 million from the prior quarter. The net earnings and adjusted earnings per share attributable to equity holders were minus $0.02 and $0.01. Also, EBITDA was $100.1 million, and adjusted EBITDA was $110.0 million.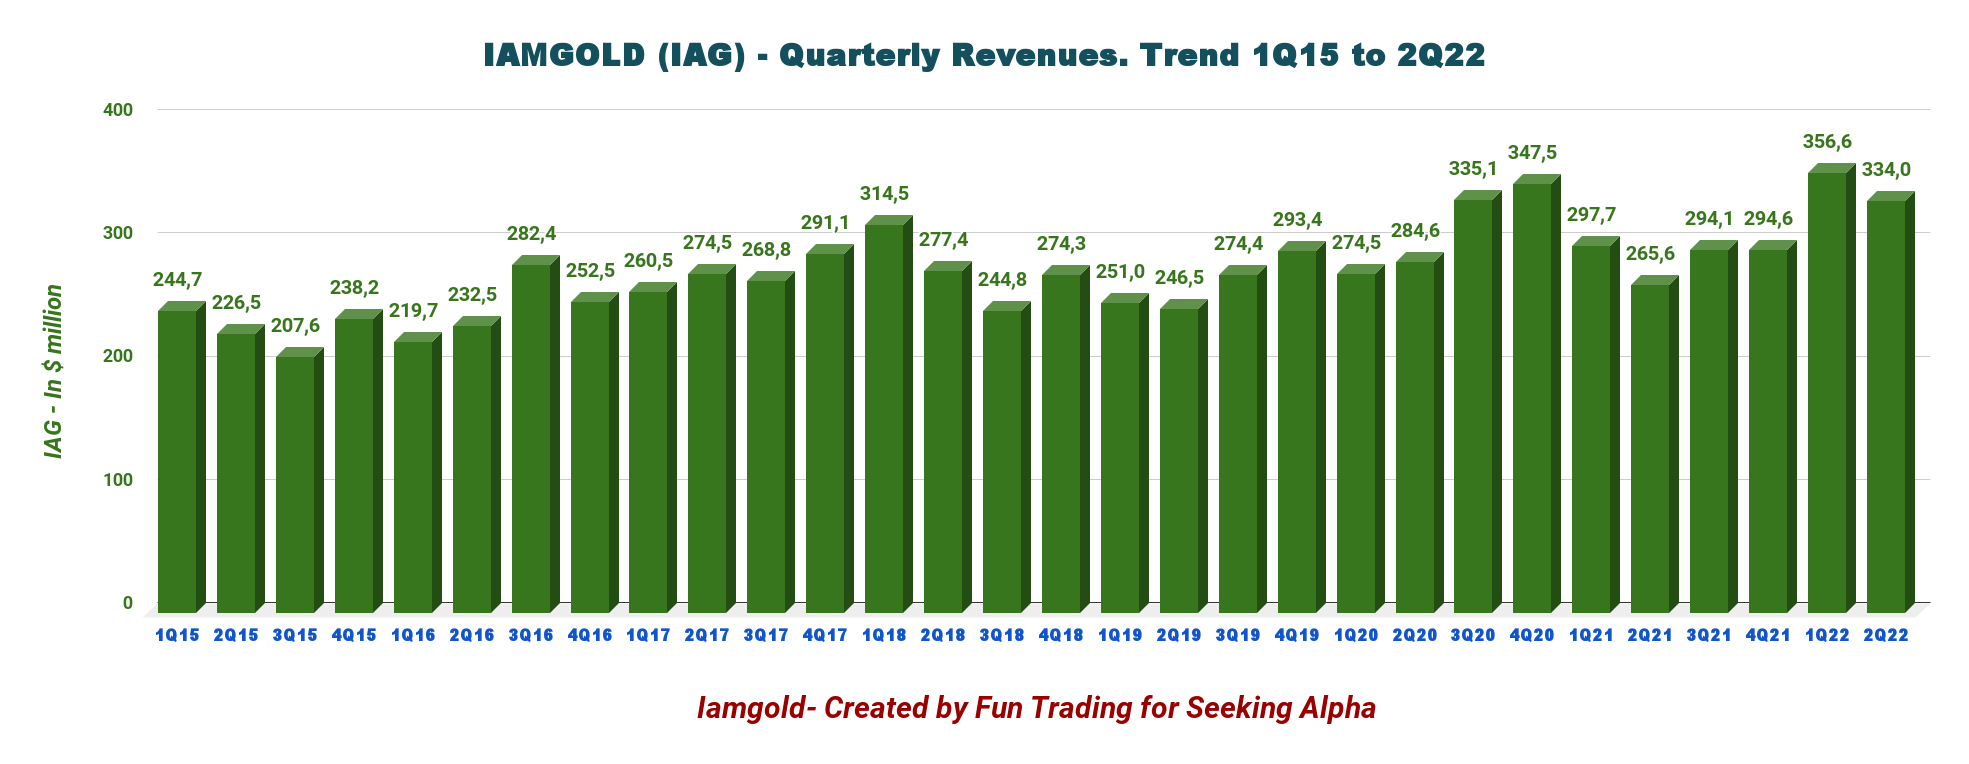
CEO Maryse Belanger said in the conference call:
IAMGOLD had another strong quarter benefitting from recent productivity initiatives at our operations. We are on track to achieve the upper end of our production guidance for the year, and there are many positive developments expected in the second half.
2 – Free cash flow was a loss of $26.8 million in 2Q22.
IAG Quarterly Free cash flow history (Fun Trading)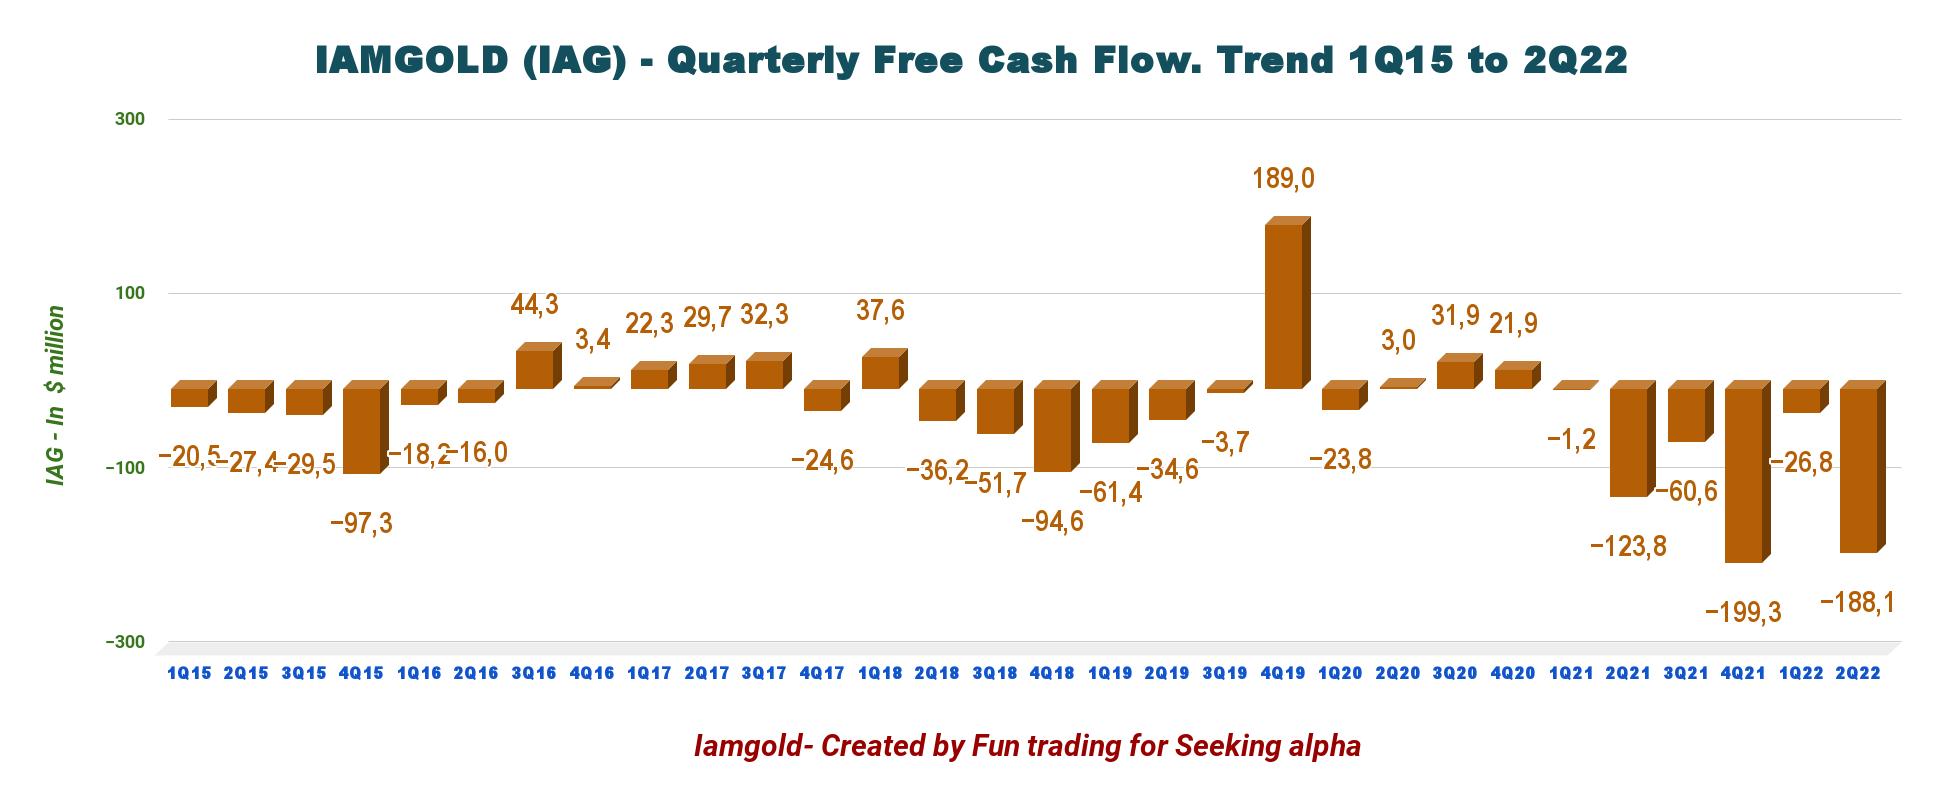
Free cash flow continues to be a recurring issue for IAMGOLD and will persist until the Côté Gold project is completed in early 2024.
Elevated CapEx affected free cash flow and was $270 million in 2Q22.
IAG’s trailing 12-month free cash flow is now a loss of $474.8 million and another $188.1 million in the second quarter.
3 – Gold Production Details; Total Production Was 170K Au Oz in 2Q22
3.1 – Gold production details
IAG Quarterly attributable Production history (Fun Trading)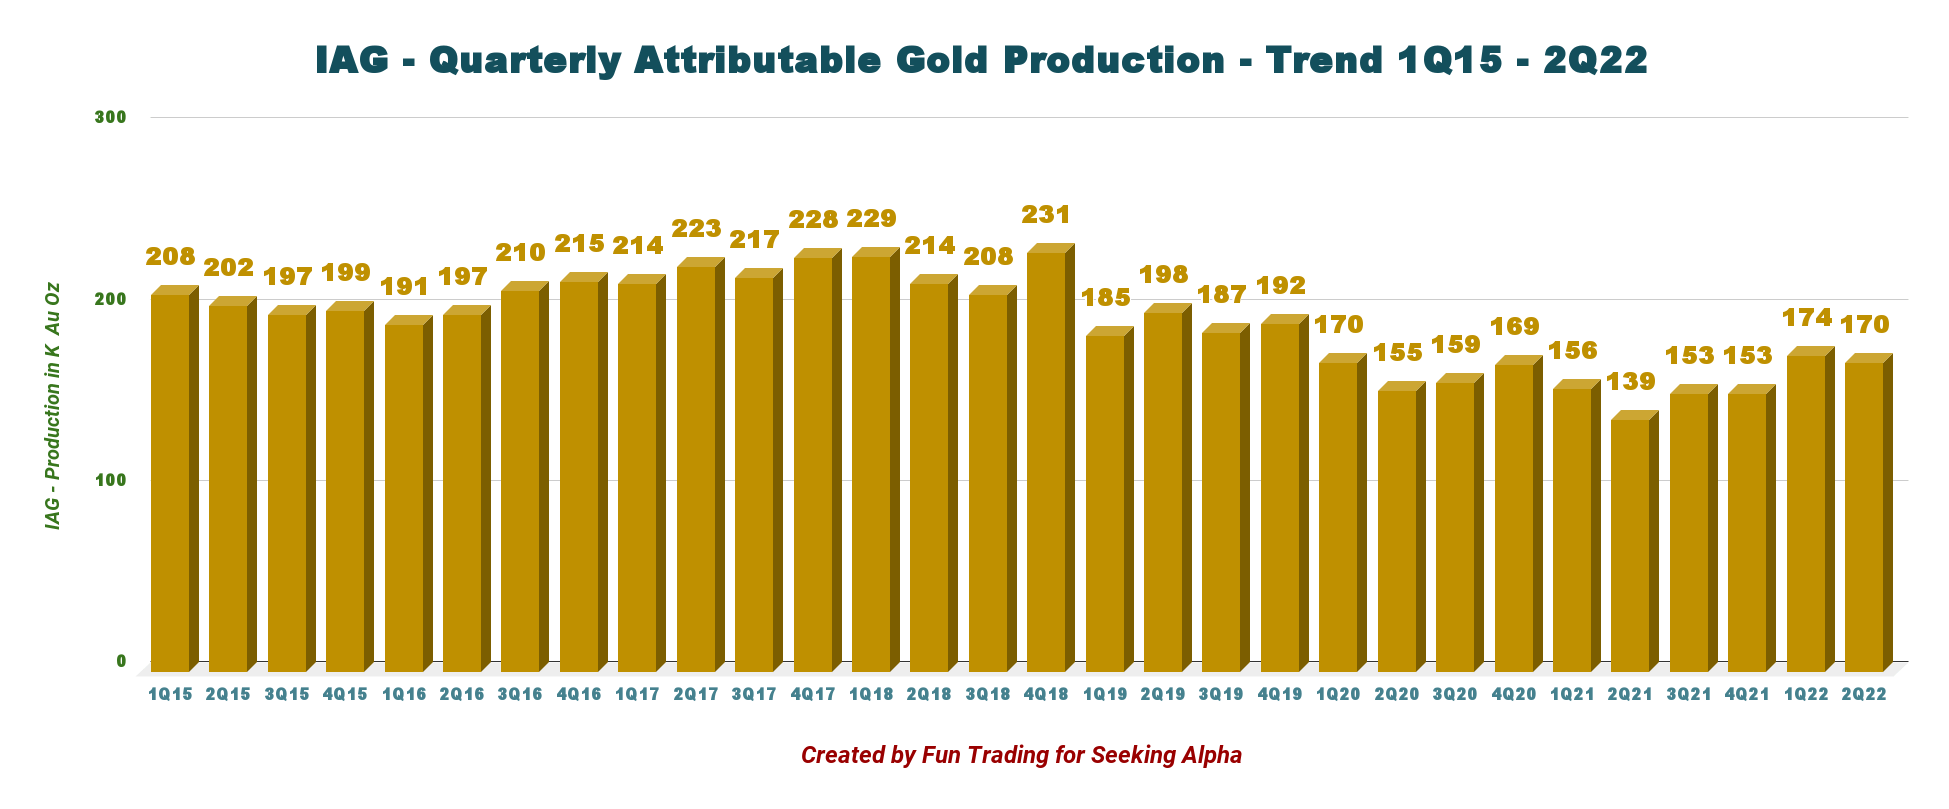
IAMGOLD produced 170K Au oz during the second quarter of 2022, compared to 139K Au oz during 2Q21 on continued strong performance from Essakane and Rosebel, as shown in the graph below.
IAG Quarterly Production per mine in 2Q22 (Fun Trading) Cash cost per ounce sold in the second quarter was $1,130.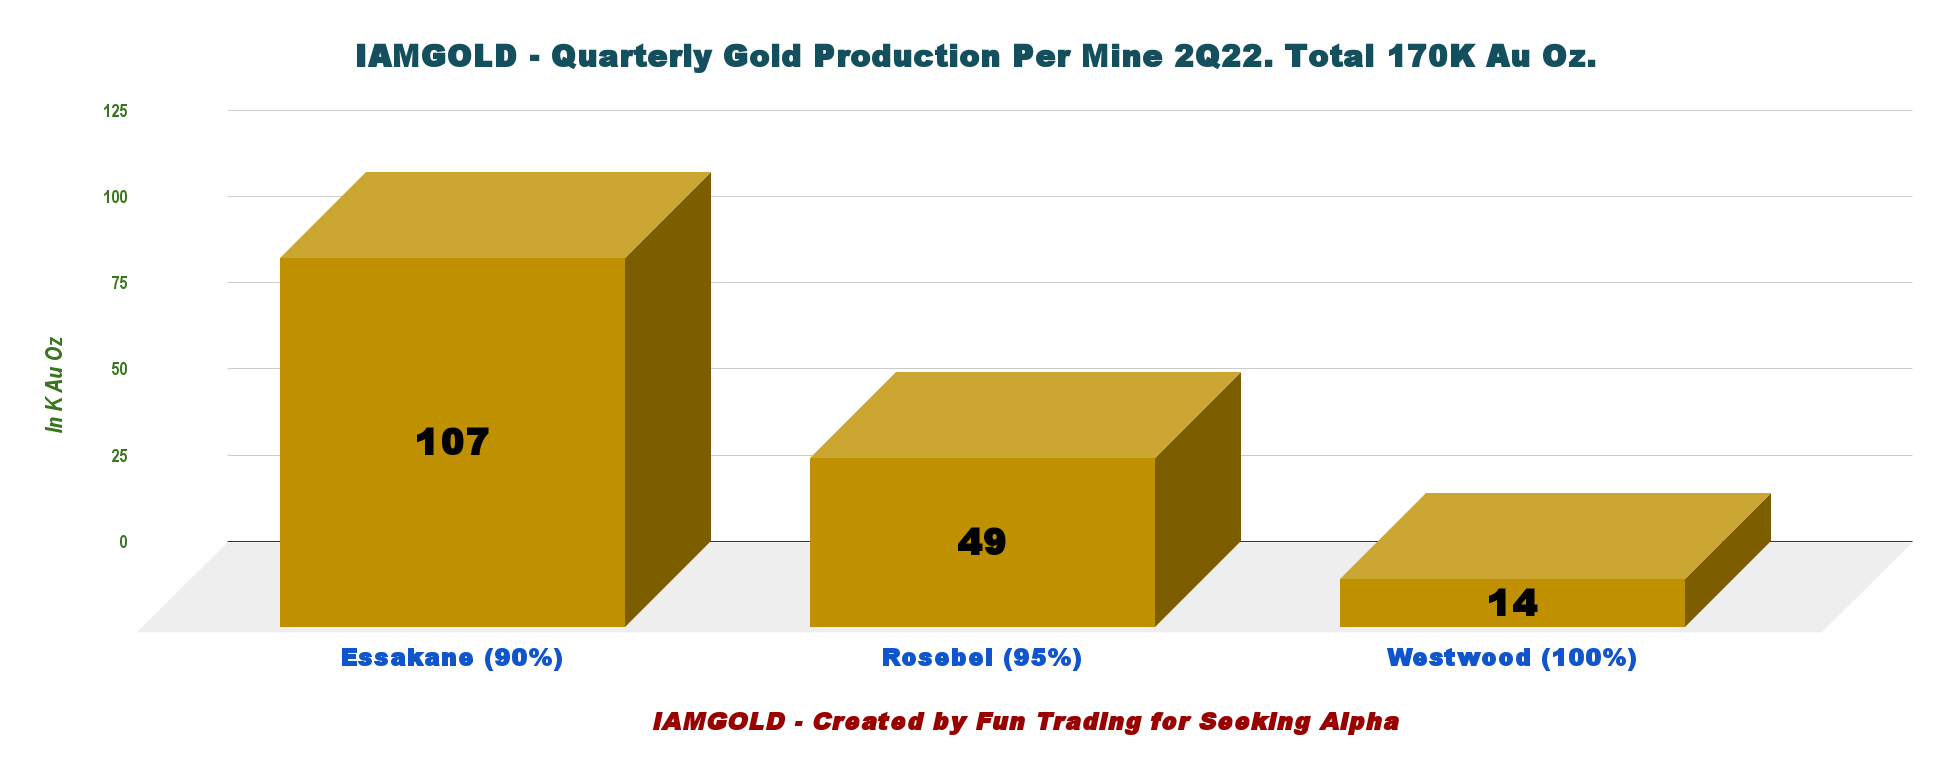
3.2 – Quarterly AISC and Gold price.
AISC is now $1,604 per ounce. A non-cash NRV write-down of short-term ore stockpiles and finished goods inventories of $19 per ounce sold.
IAG Quarterly AISC and Gold price history (Fun Trading)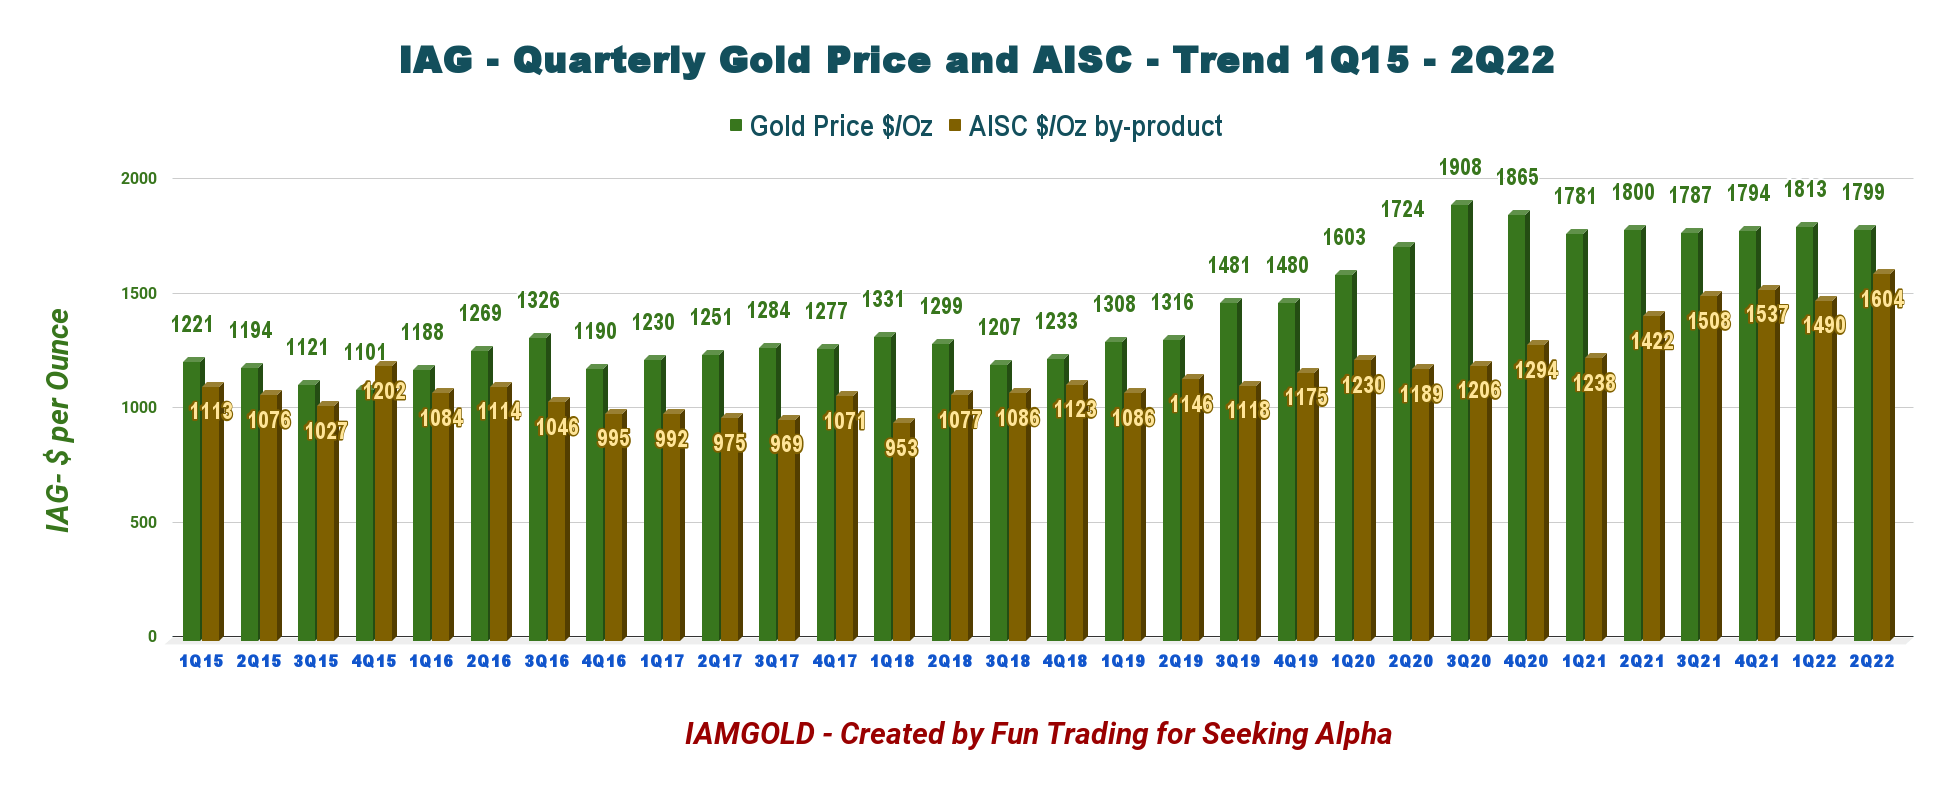
3.3.1 – 2022 Guidance unchanged.
Interim CEO Maryse Belanger said in the conference call:
IAMGOLD delivered another strong quarter with attributable gold production of 170,000 ounces on continued strong performance from Essakane and improvements at Rosebel, and that’s bringing our year-to-date production to 344,000 ounces, positioning us on track to achieve the top end of our guidance range of 570,000 to 640,000 ounces.
Guidance is expected to be between 570K and 640K Oz in 2022, with CapEx up to $745 million and AISC going up the roof at about $1,415 per ounce.
IAG 2022 Guidance (IAMGOLD Corp)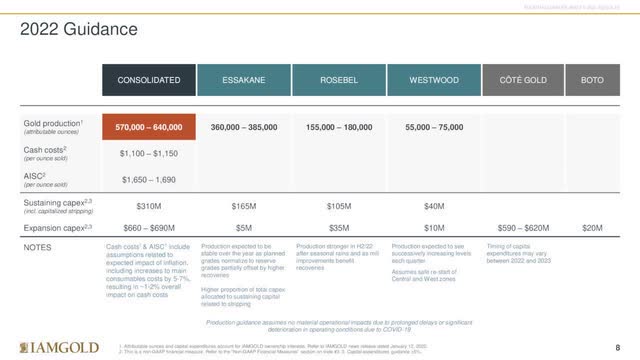
4 – The company had $159.1 million in net debt and strong liquidity of $807 million on June 30, 2022.
Note: the company used $150 million in its revolving facility.
IAG Quarterly Cash versus Debt history (Fun Trading) IAMGOLD has a net debt of $159.1 million and total liquidity of approximately $807 million as of June 30, 2022. Total cash is now $452.9 million. IAG Liquidity (IAMGOLD Corp)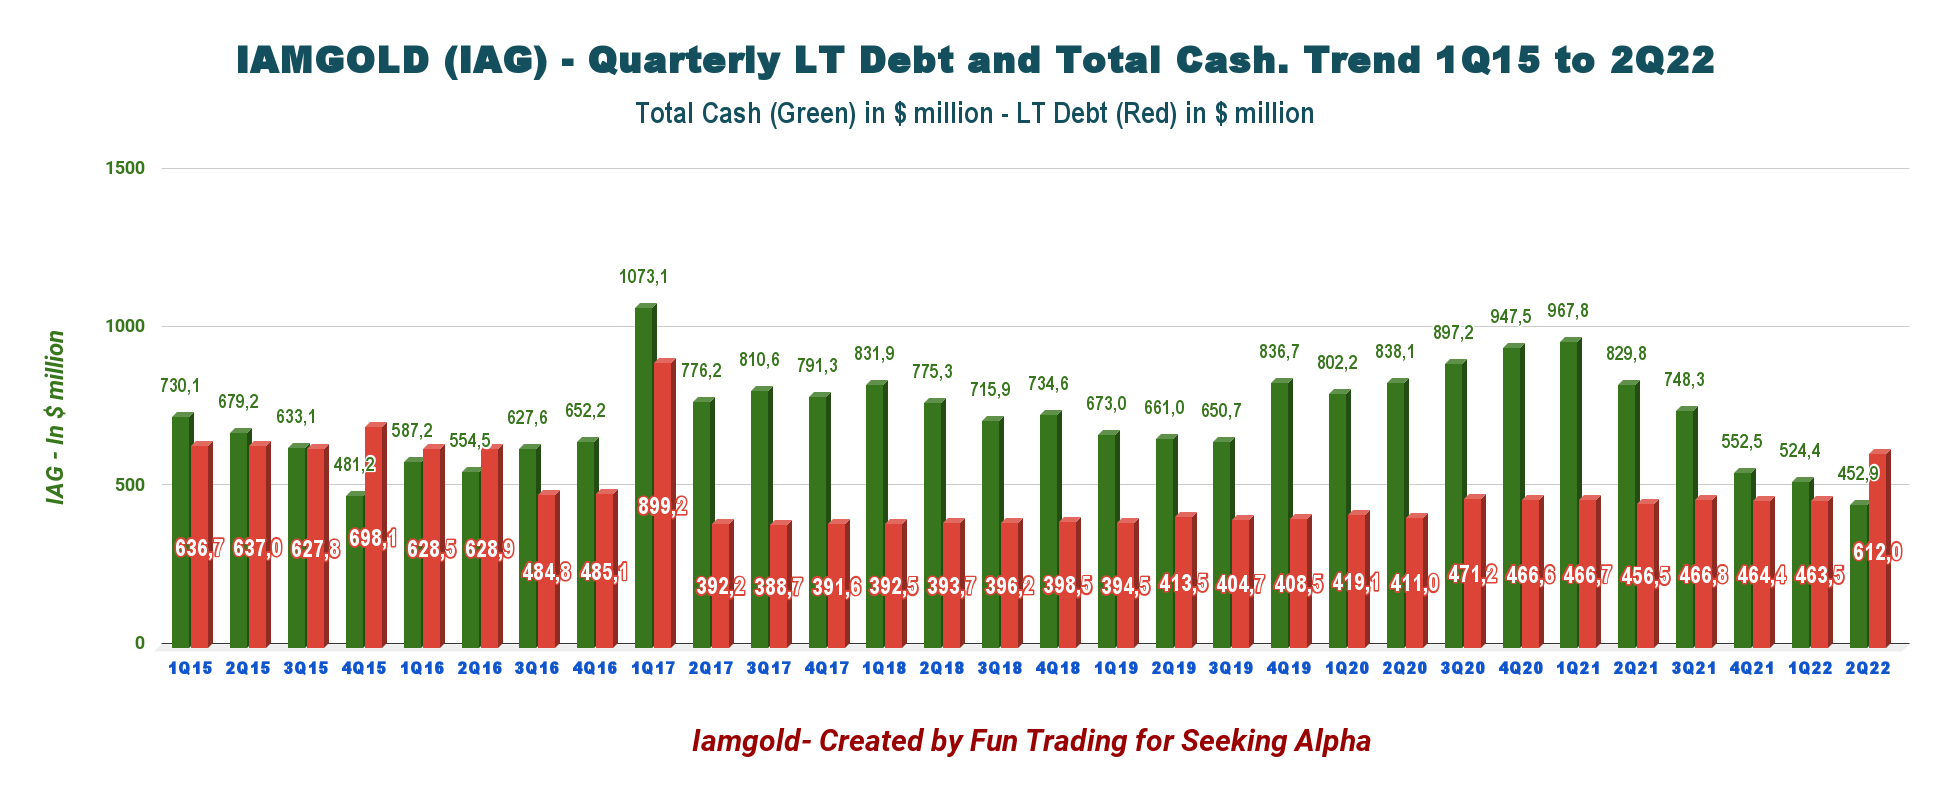

Warning: The company is indicating that additional financing will be necessary to complete the Cote Gold project, expected to be announced at the end of 2022. It could be other secured debt or unsecured debt, including unsecured and convertible notes, sales of common shares, etc.
Technical Analysis (Short Term) and commentary
IAG TA chart short-term (Fin Trading)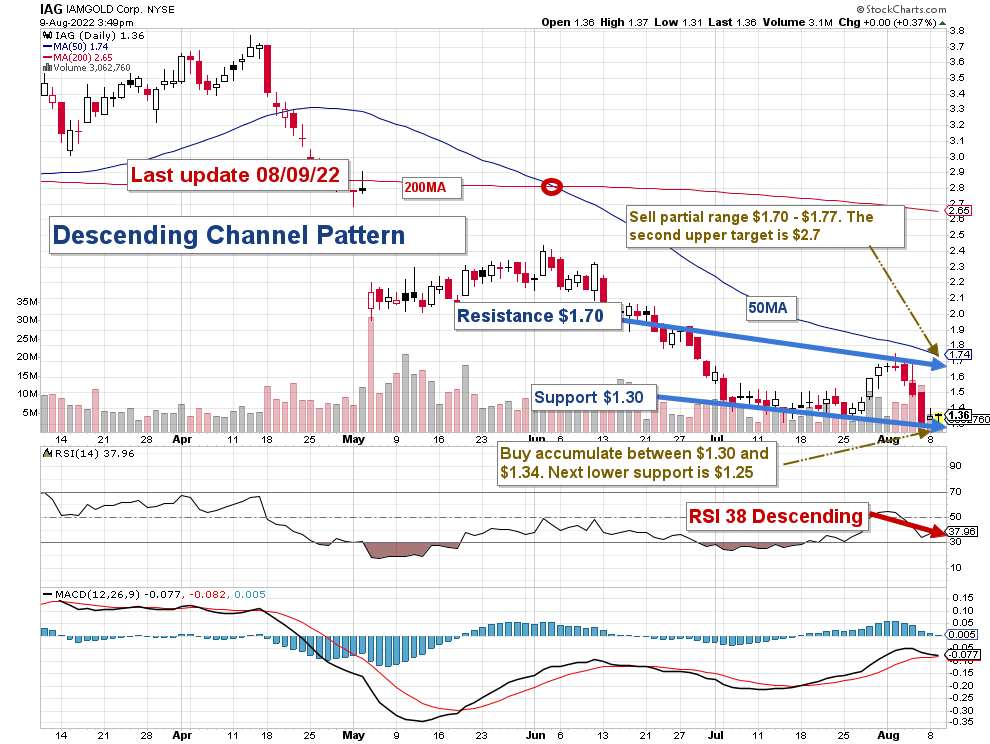
IAG forms a descending channel pattern with resistance at $1.70 and support at $1.30.
The short-term trading strategy is to trade LIFO about 75% of your position. I suggest selling between $1.70 and $1.77 and waiting for a retracement at or below $1.34 to $1.30.
However, the mid-resistance/support is now $1.53 and could be used for trading in correlation with the RSI. In this case, I suggest selling about 30% at $1.53 and potentially selling 35% at or above $1.70.
IAG will probably stay within the descending channel that could eventually evolve into a descending triangle with strong support at $1.30. It is valid if the gold price can remain between $1,750 and $1,800 per ounce.
Watch the gold price like a hawk.
Note: The LIFO method is prohibited under International Financial Reporting Standards (IFRS), though it is permitted in the United States by Generally Accepted Accounting Principles (GAAP). Therefore, only US traders can apply this method. Those who cannot trade LIFO can use an alternative by setting two different accounts for the same stock, one for the long-term and one for short-term trading.
Warning: The TA chart must be updated frequently to be relevant. It is what I am doing in my stock tracker. The chart above has a possible validity of about a week. Remember, the TA chart is a tool only to help you adopt the right strategy. It is not a way to foresee the future. No one and nothing can.
Author’s note: If you find value in this article and would like to encourage such continued efforts, please click the “Like” button below to vote for support. Thanks.
Be the first to comment