

onlyyouqj
I – The case for a gold reversal in H2 2023
In the first half of 2022, the price of gold went through unprecedented volatility. It started with the surprising Russian invasion of Ukraine, which triggered a gold rally to about $2,070 per ounce.
Meanwhile, in early January, the FED grew concerned about inflationary pressures and became increasingly hawkish, signaling a shift in interest rate policy.
The Federal Reserve on Wednesday said it is likely to hike interest rates in March and reaffirmed plans to end its bond purchases that month in what U.S. central bank chief Jerome Powell pledged will be a sustained battle to tame inflation.
Gold was the first to be affected by the FED’s new policy and commenced a long slide while the Federal Reserve raised the fed funds rate from March 17 to November 2. The Gold price dropped to a low of $1,625 per ounce in early November.
The CPIF (Consumer Price Index with fixed interest rate) 12-month inflation rate reached 9.2% in October 2022. However, the annual inflation rate in the USA slowed for a fifth straight month to 7.1% in November, which marked the lowest since December last year, and below forecasts of 7.3%, showing that the FED rate policy was working against inflation.
2022 US CPI percentage (Tradingeconomics.com)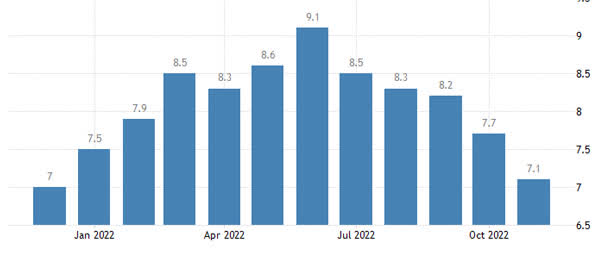
The gold price began to recover in November, expecting the FED to switch to a smaller interest rate increase of 50 points in December, which it recently did. However, the FED warned that the job is not done yet, and more increases are expected in 2023.
Federal Reserve officials expect to switch to smaller interest rate increases “soon,” according to minutes from the November meeting released Wednesday.
Gold price one year chart. Cup and Handle pattern (Fun Trading, StockCharts)
The gold price crossed the 200MA to $1,825 per ounce but is now receding. A look at the chart above indicates that gold forms a cup and handle pattern, a bullish continuation pattern that marks a consolidation period followed often by a breakout.
1.1 – Now what?
I will not play another senseless Nostradamus because I know how unpredictable and dangerous this exercise can be.
However, as a technical analysis trader, I believe the chart pattern above can give us valuable clues about what to expect in the first part of 2023 and beyond.
If we add some fundamentals related to the FED, inflation, and the world economy, we have something solid that can be used as the basis of a winning strategy.
In short, we are entering a consolidation period, which is the second handle of the pattern, with probably a short descending channel pattern around $1,730 per ounce followed by a strong reversal with a breakout and new highs potentially reaching $1,900+ per ounce in H1 2023. Look at the chart below.
Gold price: Cup and Handle pattern (Option Strategies Insider)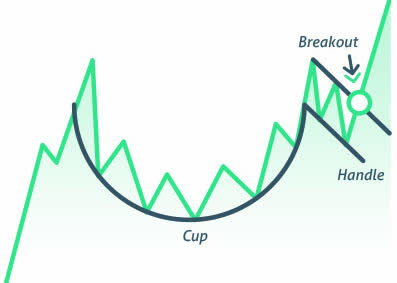
2.2 – What to do?
We know that we are now in the second handle, meaning the gold price could drop as low as $1,730 per ounce before resuming a bullish reversal.
This period of weakness will provide an opportunity to accumulate a few solid gold majors that have suffered significantly in the past six months, albeit they have recovered quite a bit recently.
Note: The descending channel pattern indicated above will allow traders and investors to accumulate safely while trading LIFO successfully.
The only remaining hurdle is choosing a few reliable companies in this segment.
II – Three Gold Major companies worth accumulating in 2023
1 – Agnico Eagle (AEM)
1.1 – A quick look
For those who want a complete analysis, I recommend reading my article published on October 27, 2022, by clicking here.
Agnico Eagle presents a solid financial profile for a savvy investor’s balanced portfolio. Nothing has changed for the past five years, even if the company has grown in size after the Kirkland Lake Gold acquisition. In a previous article on AEM, I said:
Agnico Eagle had total cash of $821.76 million in 3Q22 compared with $191.07 million as of December 31, 2021. Long-term debt was around $1,341.6 million, compared with $1,441.2 million in 2Q22. Excellent profile here.
AEM Quarterly Revenues history (Fun Trading)
The new company is generating a free cash flow estimated at $139.78 million in 3Q22 and pays a secure and attractive dividend with a yield of 3.13%.
The company’s 2022 outlook remains unchanged in the third quarter, with payable gold production for 2022 in the 3.2-3.4 Moz range.
It also projects total cash costs per ounce of $725-$775 and AISC of $1,000-$1,050 per ounce for 2022. The forecast for 2022 CapEx is set at roughly $1.4 billion.
Note: 2021 Reserves (Proven and Probable) – Total AEM and KL combined are 44.7 Moz.
AEM Assets presentation (AEM Presentation)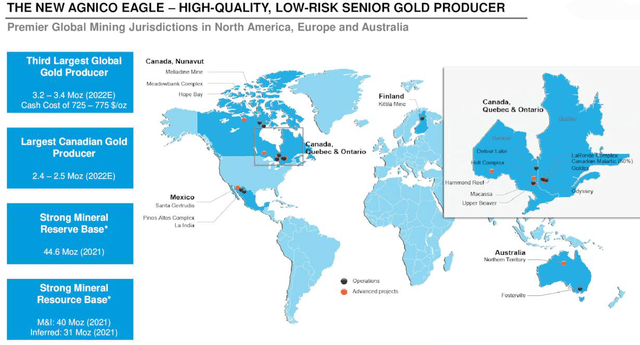
Agnico Eagle production was 816,795 Au Oz in 3Q22 from 660,604 Au ounces the preceding quarter.
AEM Quarterly Gold production history (Fun Trading)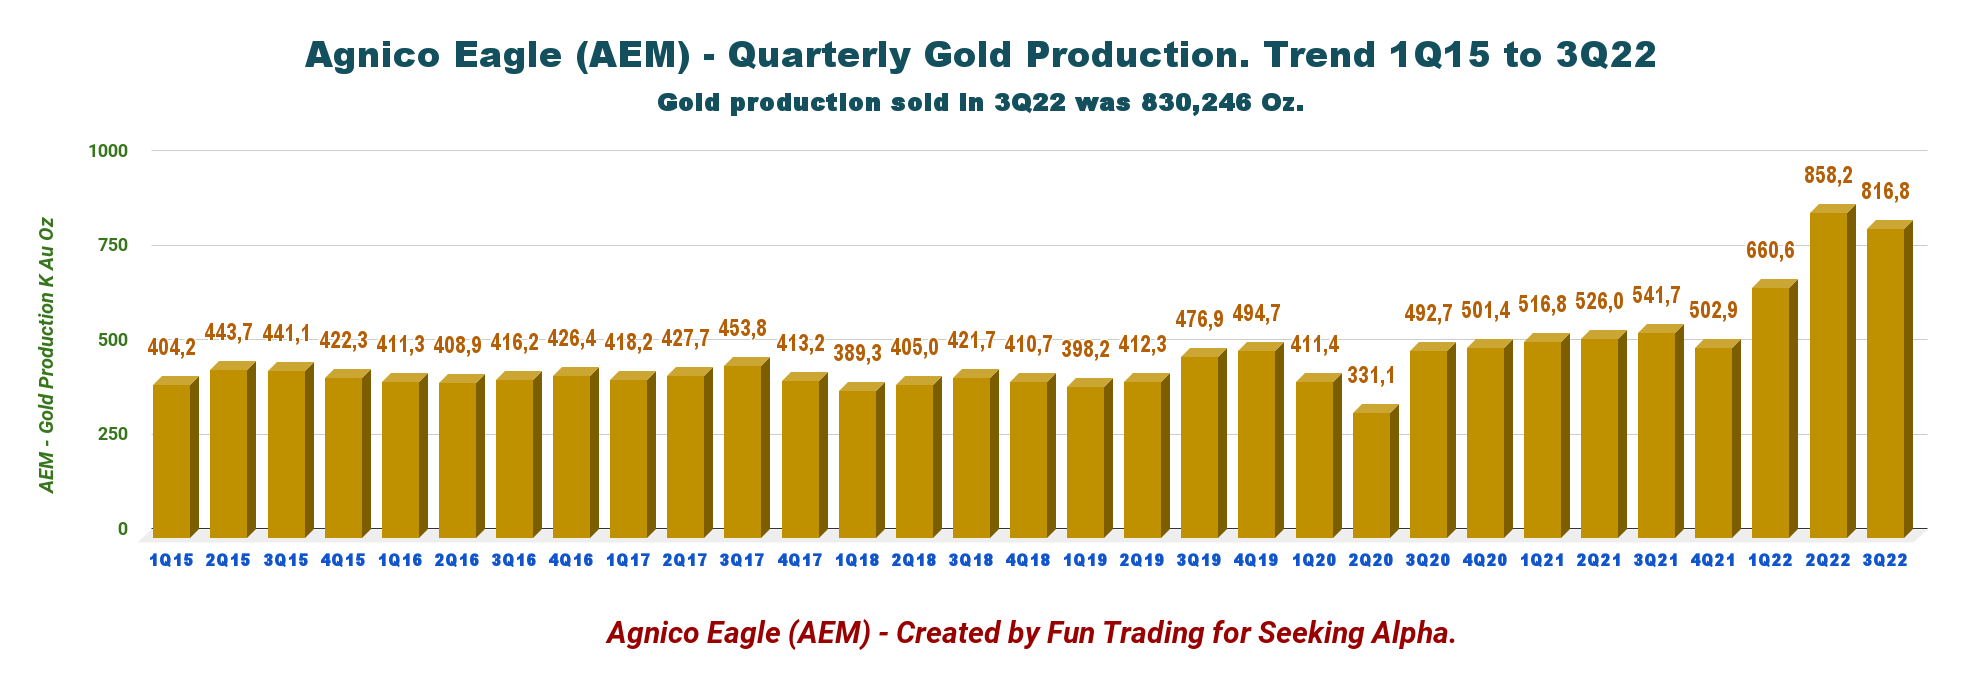
The Company produced 816.8K Au ounces, 553K Ag Oz, 2,108 Zinc, and 653 Tonnes of Copper. Gold sold for $1,726 per ounce, and copper sold at $2.57 per pound.
AEM 3Q22 Gold production per mine (Fun Trading)
1.2 – Technical Analysis
AEM TA Chart short-term (Fun Trading, StockCharts)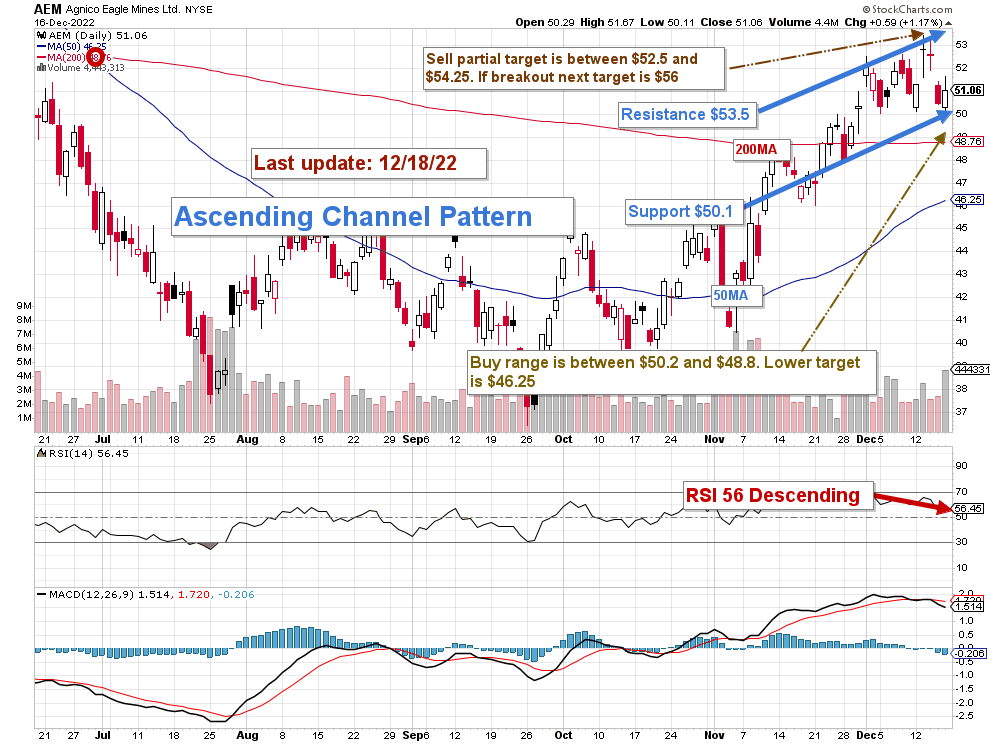
Note: The chart has been adjusted for dividends.
AEM forms an ascending channel pattern with resistance at $45.8 and support at $42.
Ascending channel patterns or rising channels are short-term bullish in that a stock moves higher within an ascending channel, but these patterns often form within longer-term downtrends as continuation patterns. The ascending channel pattern is often followed by lower prices, but only after a downside penetration of the lower trend line.
The trading strategy I recommend is to sell about 40% between $52.5 and $54.25, with a potential upper resistance at $56. On the other side, I recommend buying between $50.2 and $48.8, with possible lower support at $46.25.
It is crucial to allocate a sizeable portion of your investment in AEM to trade short-term LIFO and take advantage of the volatility.
2 – Barrick Gold (GOLD)
2.1 – A quick look
Note: For those who want a complete analysis, I recommend reading my article published on October 27, 2022, by clicking here.
Barrick Gold is one of my gold producers of choice. The company’s assets are more diversified than Newmont Corp and Agnico Eagle. Also, Barrick Gold is producing a good amount of Copper in the Middle East. However, Barrick has significant exposure in Africa, which is an additional risk.
Barrick Gold offers an excellent balance sheet with net cash of $145 million. Total debt was $5.095 billion at the end of the third quarter, and the total cash was $5,240 million.
The company paid a total quarterly dividend of $0.15 per share in 3Q22, or a yield of 3.55%.
Quarterly revenues were $2,527 million in 3Q22, with a net income of $241 million.
GOLD Quarterly Revenues history (Fun Trading)
Barrick Gold generated a free cash flow loss of $34 million in 3Q22, with a trailing 12-month free cash flow of $1,246 million.
Gold production was 988K Oz in 3Q22, and Copper production was 123 M pounds. Gold sold for $1,722 per ounce, and copper sold at $3.24 per pound.
Barrick Gold remains on track to achieve 2022 production guidance, with gold at the low end of the range and copper at the midpoint.
GOLD Quarterly gold production history (Fun Trading)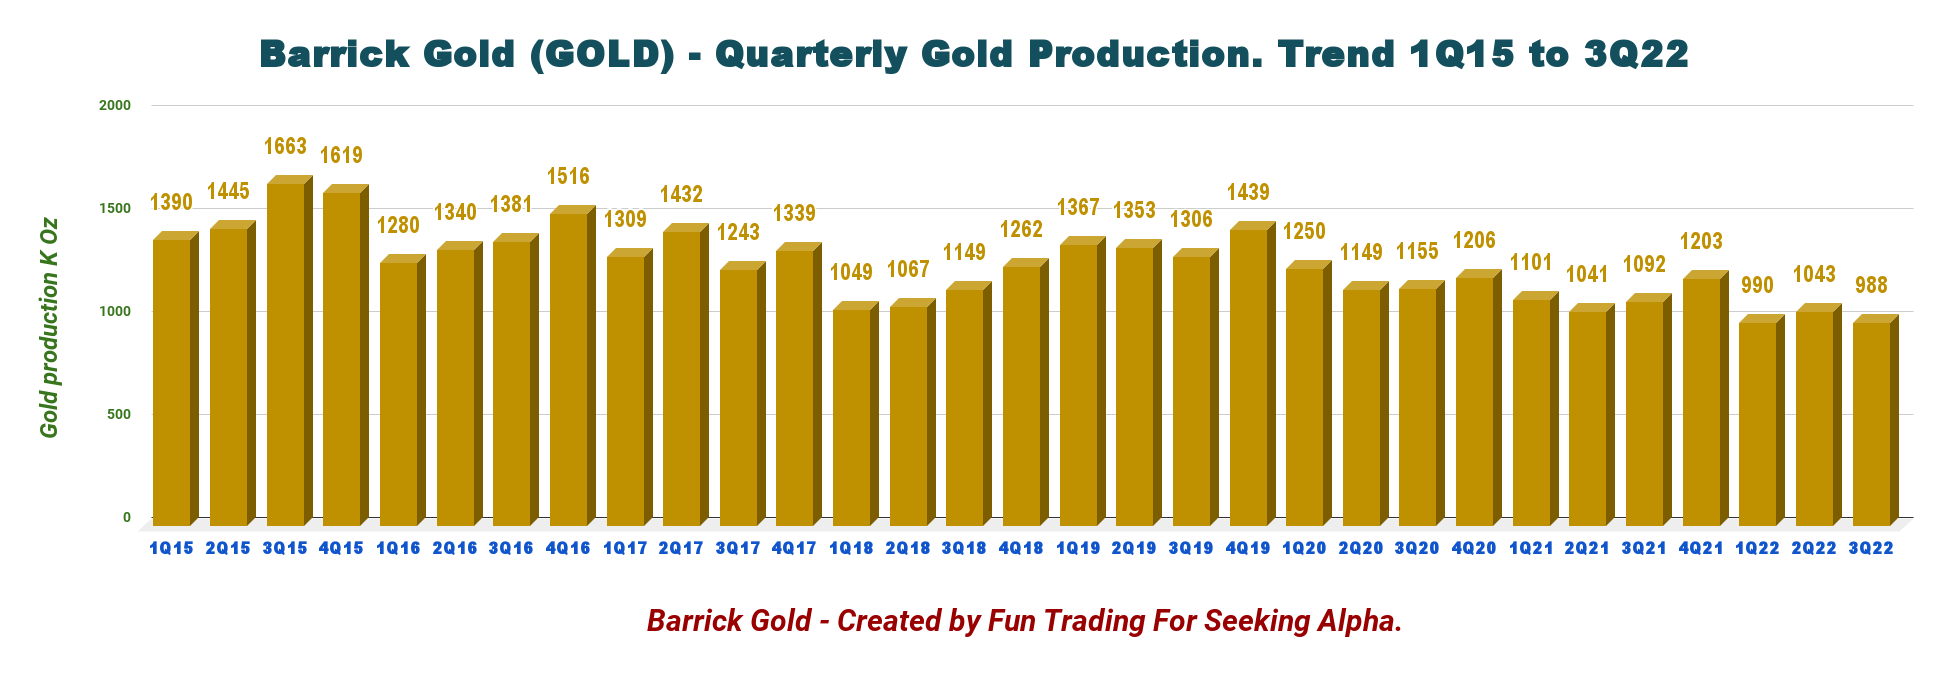
Barrick Gold produced gold from nine mines. Some of which are part of Nevada Joint Venture with Newmont Corporation.
GOLD 3Q22 Gold production (Fun Trading)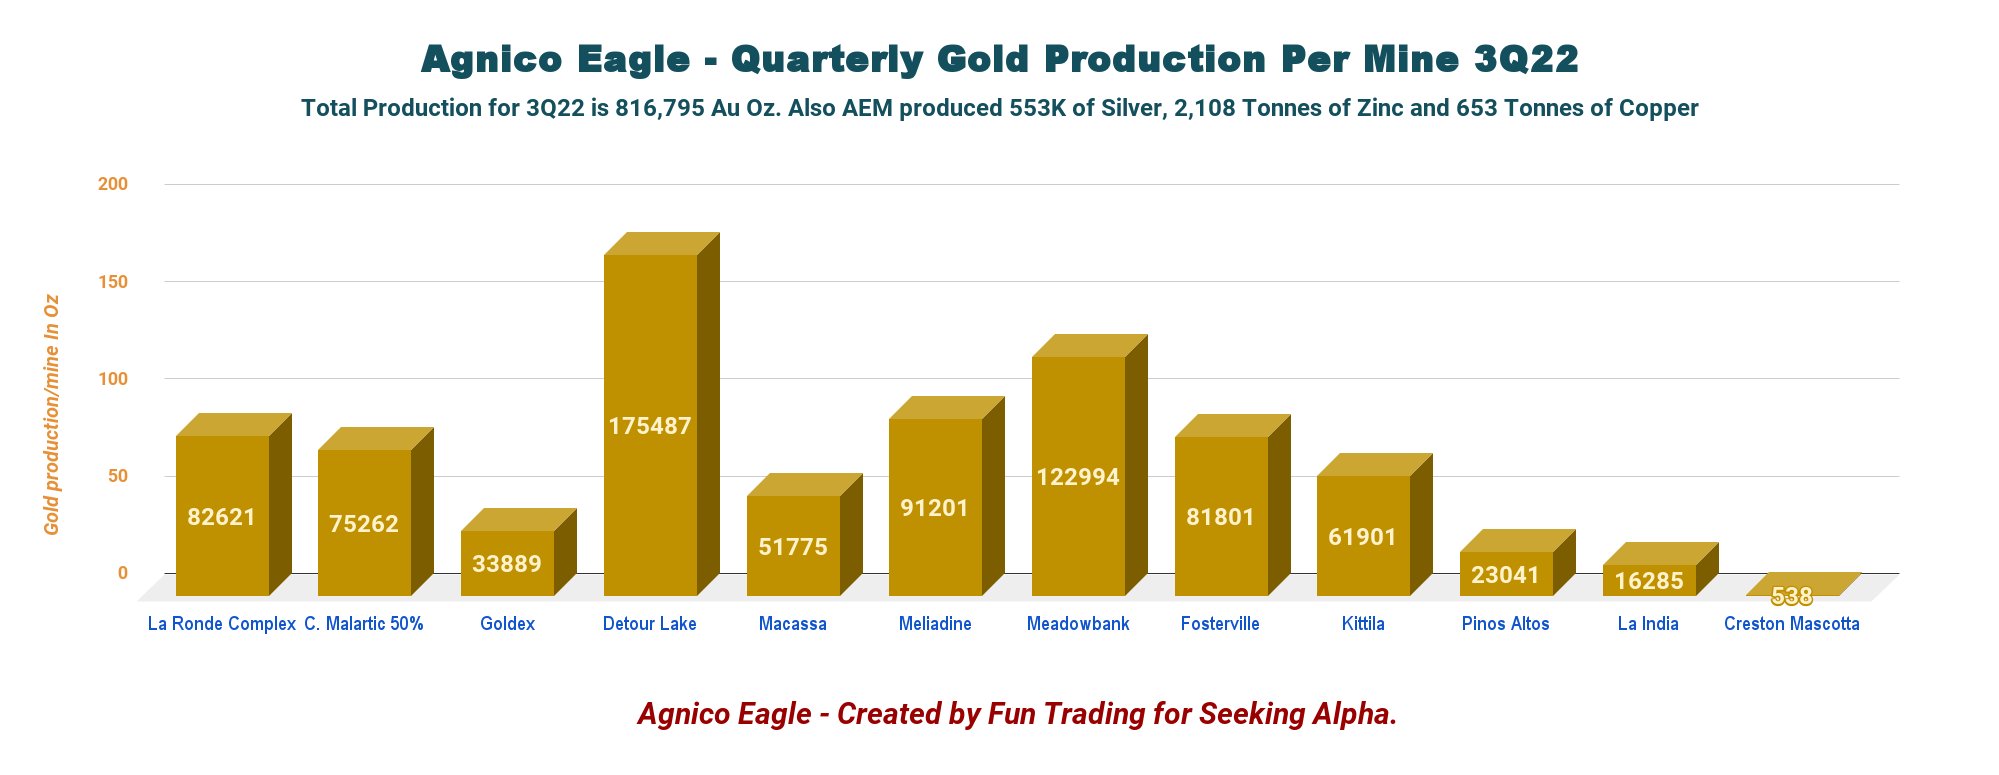
2.2 – Technical Analysis
GOLD TA Chart short-term (Fun Trading, StockCharts)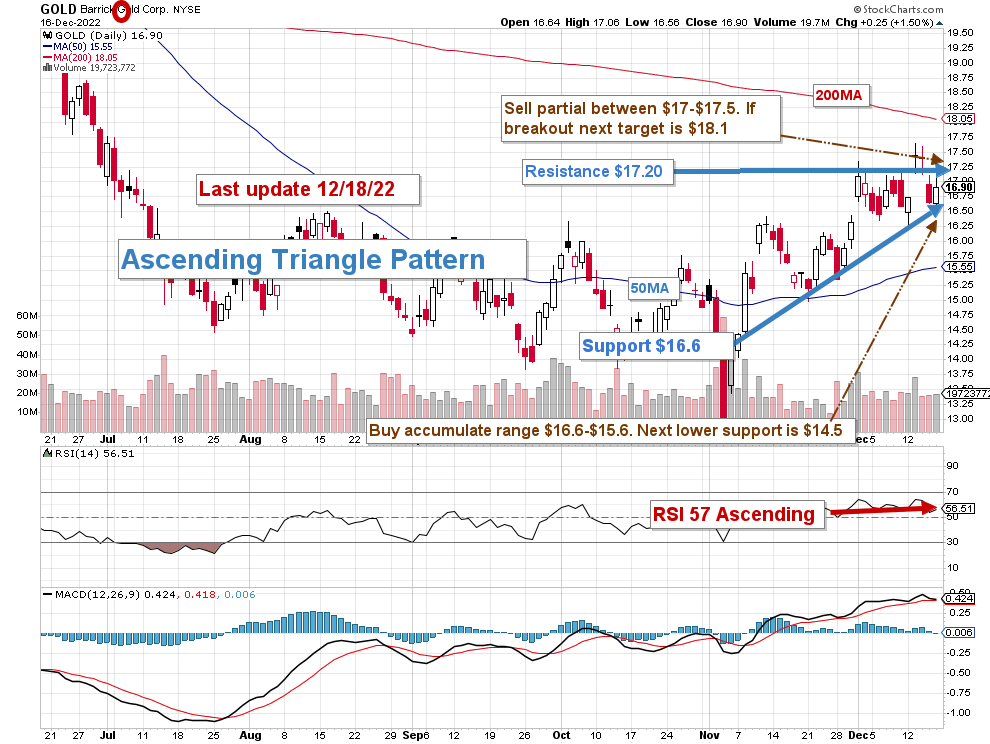
Note: The chart is adjusted for the dividend.
GOLD forms an ascending triangle pattern with resistance at $16.2 and support at $14.
Ascending triangles are bullish formation that usually forms during an uptrend as a continuation pattern. We can also assume a cup and handle pattern starting in July 2022. In this case, it is also a bullish pattern that could eventually suggest a future top at around $19.50.
The overall strategy that I suggest in my marketplace, “The Gold And Oil Corner,” is to keep a core long-term position and use about 40% to trade LIFO (see note below) while waiting for a higher final price target for your core position between $20 and $25 and pocketing the dividend while waiting.
The trading strategy is to sell 40% between $17 and $17.50 and another 10% above $18.1. I suggest waiting for a retracement between $16 and $15.6 to accumulate again, with potential lower support at $14.50.
3 – Newmont Corporation (NEM)
3.1 – A quick look
Newmont Corporation is the world’s leading gold miner, producing primarily gold and copper, silver, zinc, and lead.
NEM 3Q22 Revenues per metal (Fun Trading)
Total gold production is expected to be 6 Moz at an AISC of $1,150 per ounce for 2022. Gold sold at $1,726 per ounce, and copper sold at $2.57 per pound.
NEM 2022 outlook (NEM Presentation)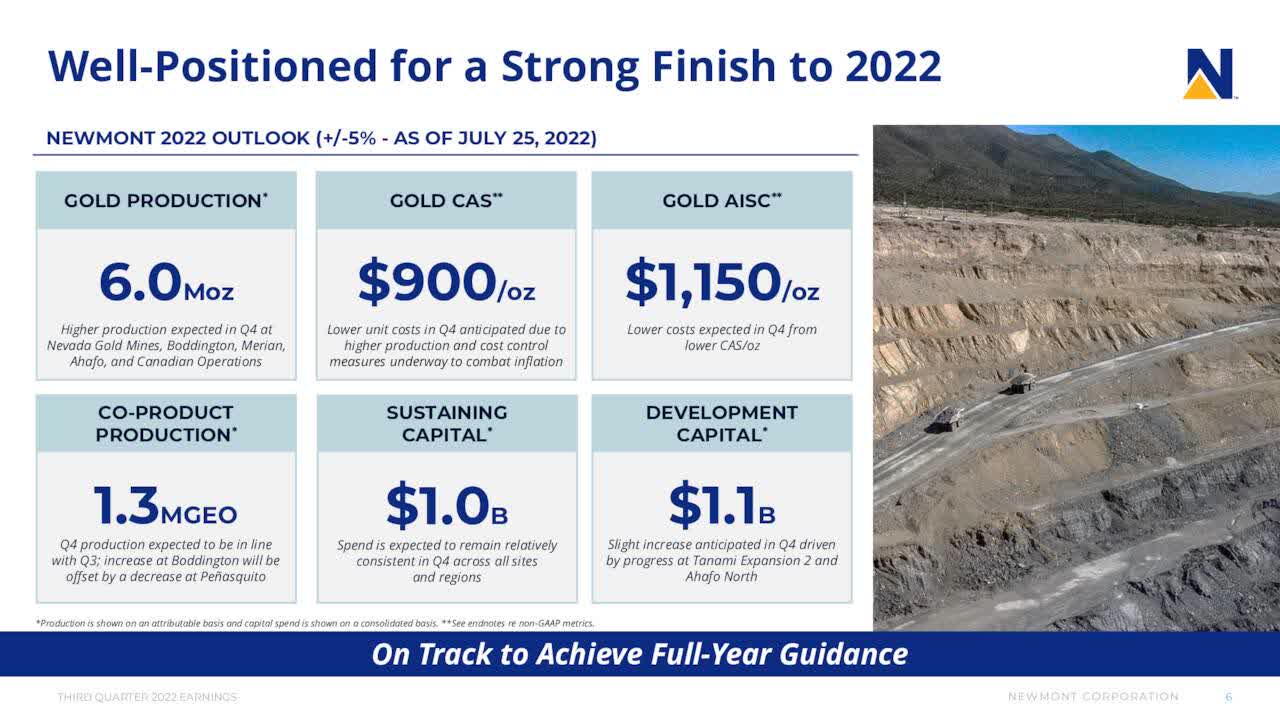
Quarterly revenues were $2,634 million in 3Q22, with a net income of $213 million. Newmont generated a free cash flow loss of $56 million in 3Q22 with a trailing 12-month free cash flow of $1,583 million.
NEM Quarterly Revenues history (Fun Trading)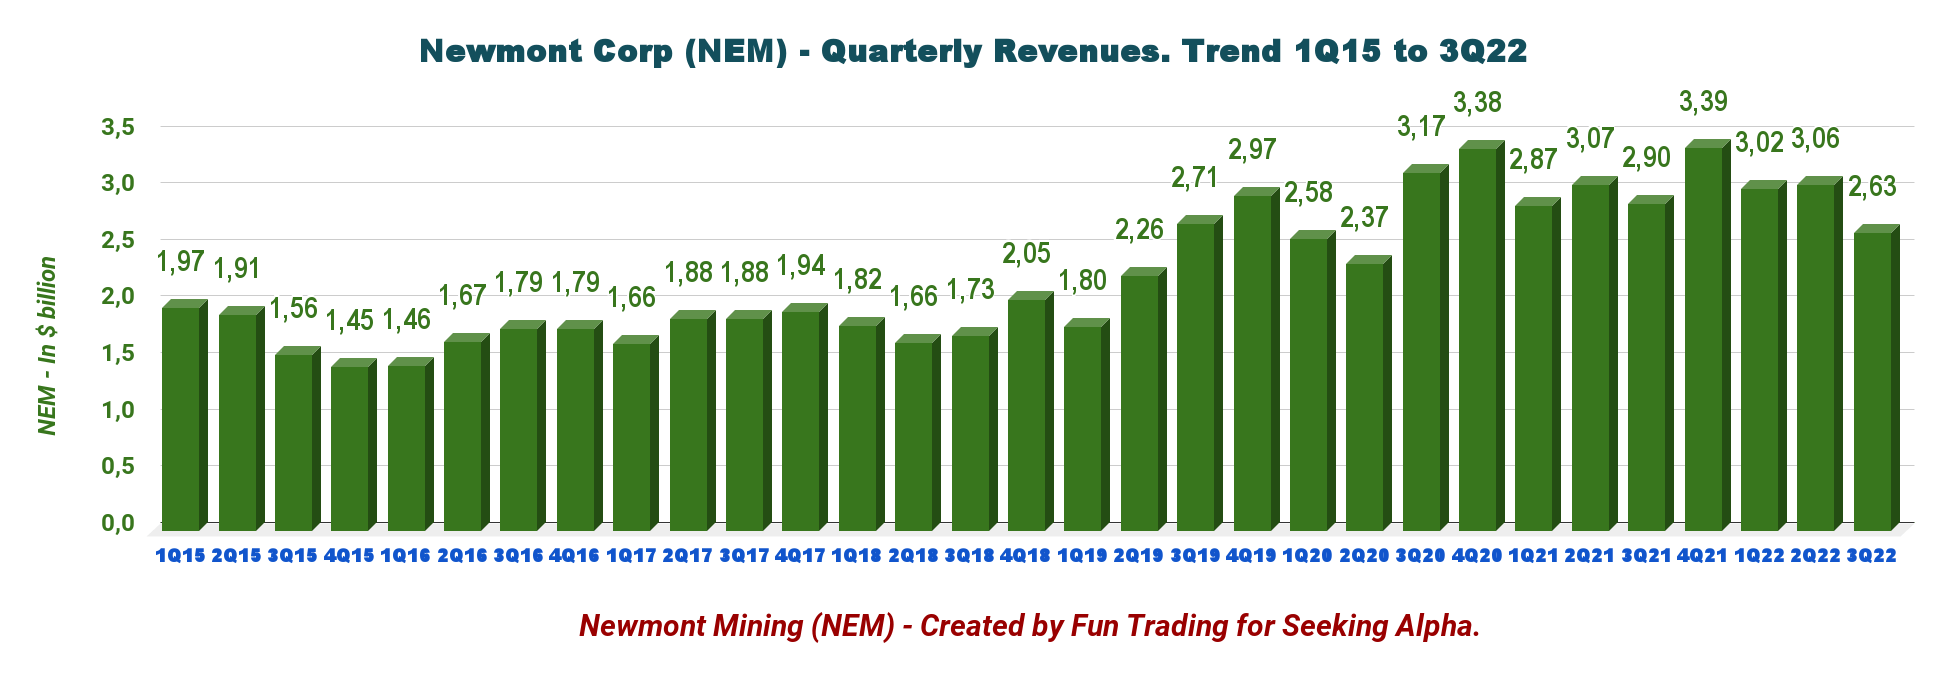
Newmont Corporation’s production was 1,486K Au Oz in 3Q22 (sold 1,369K Au Oz) from 1,495K Au ounces the preceding quarter. However, the production gold equivalent was 1,786K GEOs in 3Q22.
The Company produced 816.8K Ag ounces, 553K Ag Oz, 2,108 Zinc, and 653 Tonnes of Copper.
NEM Quarterly Gold production history (Fun Trading)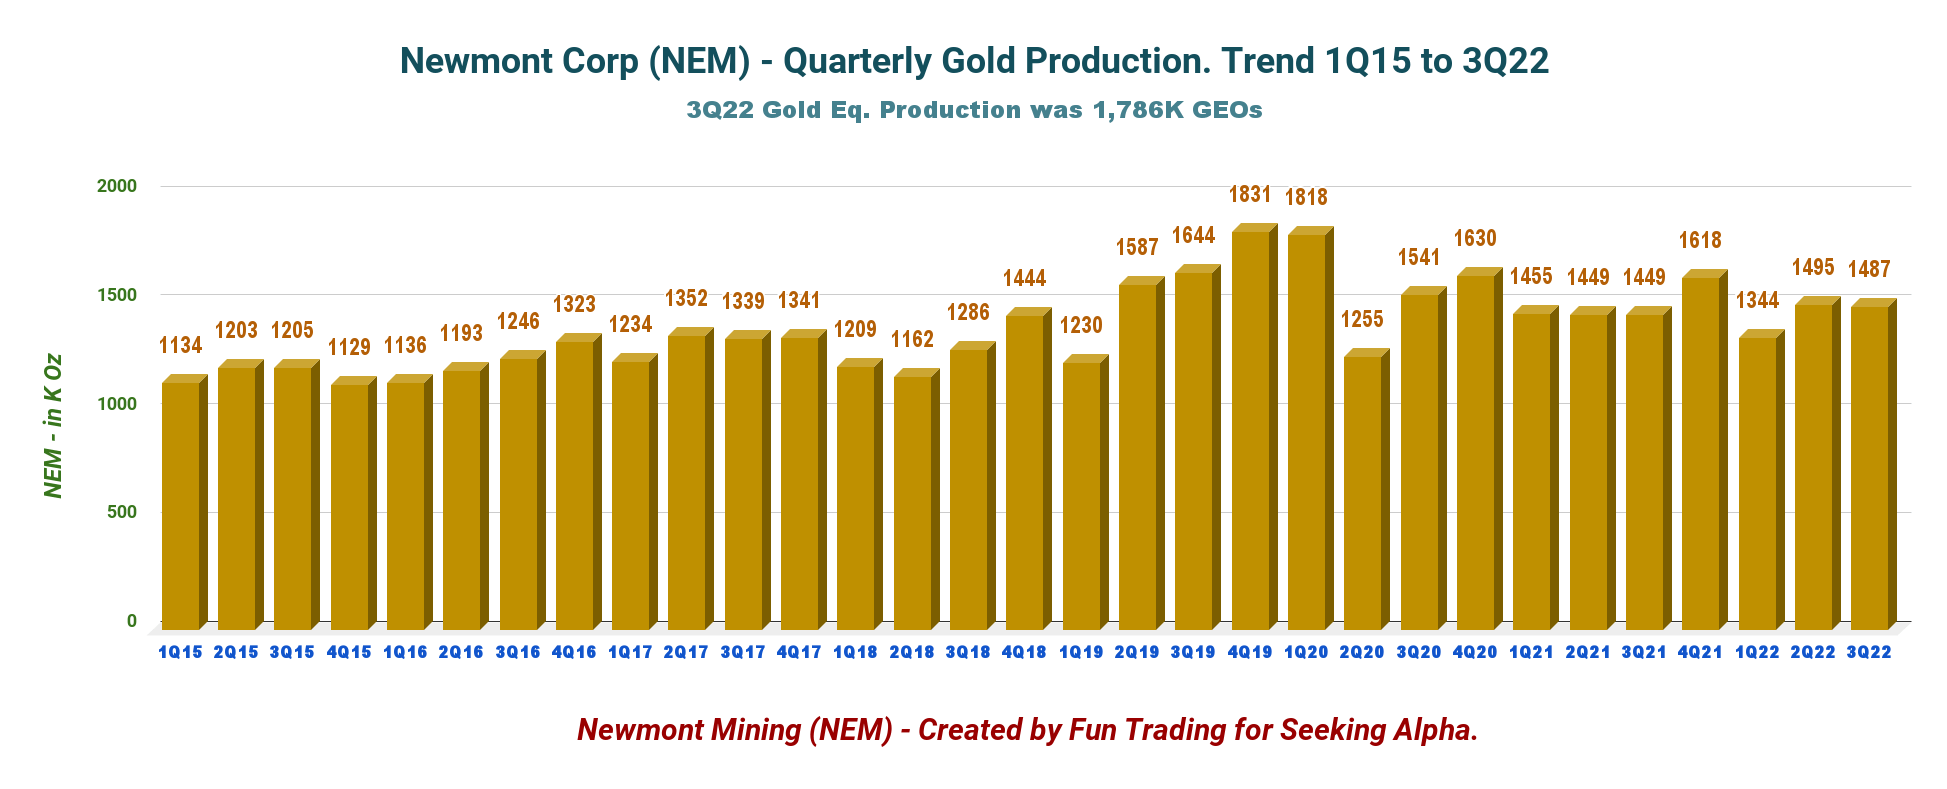
Newmont Corporation produces gold and other metals from 13 mines:
NEM 3Q22 Production per mine (Fun Trading)
Newmont has a strong balance sheet and pays a quarterly dividend of $0.55 or a yield of 4.77%.
NEM Balance sheet (NEM Presentation)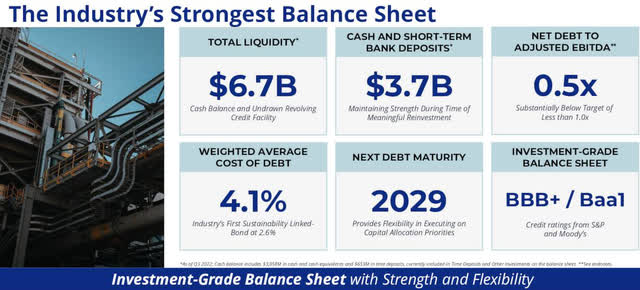
2.2 – Technical Analysis
NEM TA Chart short-term (Fun Trading, StockCharts)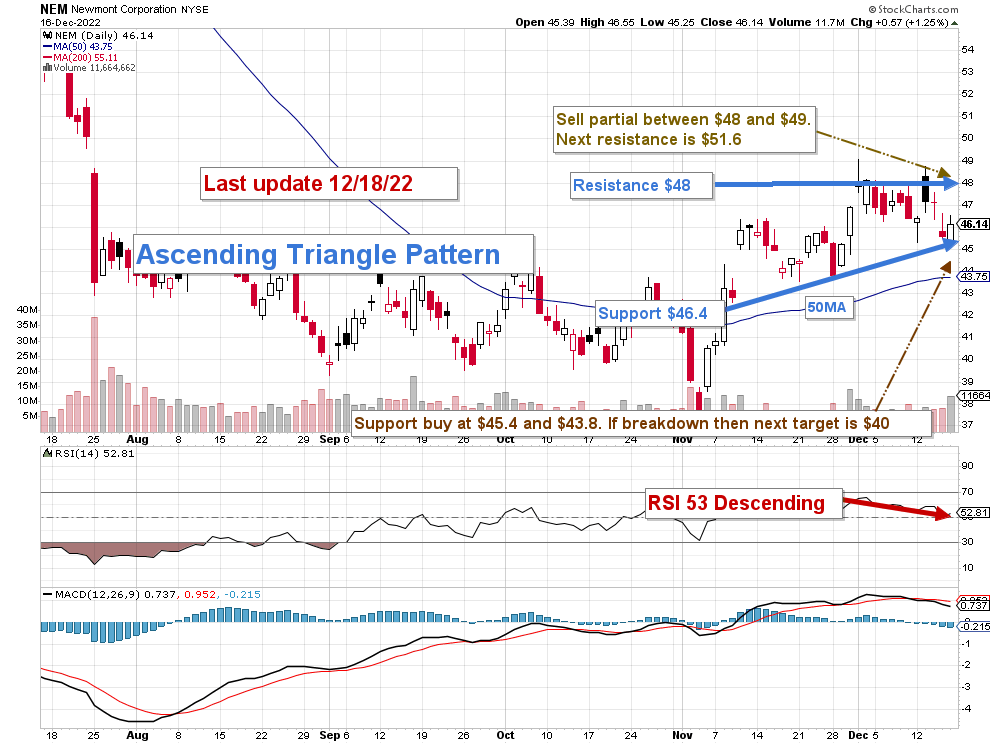
Note: The chart has been adjusted for dividends.
NEM forms an ascending triangle pattern with resistance at $48 and support at $46.4. Ascending triangles are bullish formation that usually forms during an uptrend as a continuation pattern.
The short-term trading strategy is to trade LIFO about 30%-40% of your position and keep a core long-term amount for a much higher payday. I suggest selling between $48 and $49 with possible higher resistance at $51.6 and waiting for a retracement below $45.4-$43.8 with potential lower support at $40.
III – Conclusion
I believe it is the right time to start a long-term position in gold and take advantage of the volatility to build up a solid position for a potential strong gold price recovery when the FED is done with its interest rate adjustments.
The uptrend has started already and should accelerate in H1 2023, which leaves us plenty of time to accumulate and trade LIFO. Thus, I recommend buying my three selected miners equally to reduce the risk.
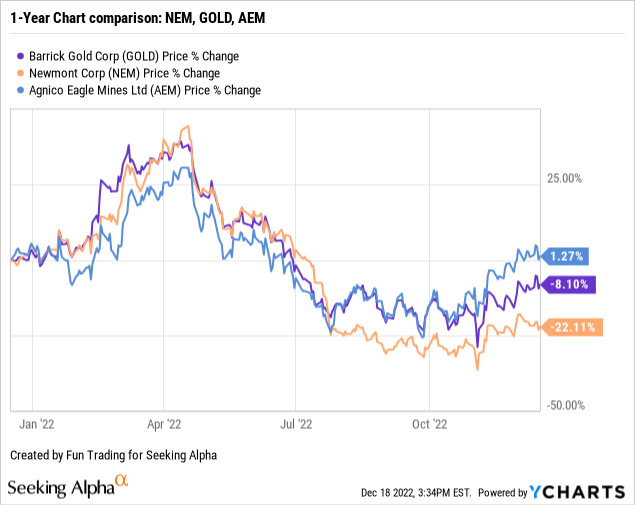
AEM is up 1% and has outperformed GOLD and NEM. NEM is lagging and is down 22% on a one-year basis. However, all three are up from their recent lows in October.
Best of luck.
Be the first to comment