

Manufactured Home parks can be an excellent investment. Today, SUI is available at a bargain price.
felixmizioznikov/iStock via Getty Images
Sun Communities (NYSE:SUI) is already one of our larger positions and is a poster child for what we like to see in an equity REIT. We responded to the very recent dip by raising our position. When analyzing a REIT, it helps to look at the REIT from multiple angles. On one hand, we want to be able to dig in deep to catch details. However, we don’t want to miss the forest for the trees. With SUI, when we dig in deep, it simply confirms that the forest matches our expectations. Consequently, I want to focus on the big picture factors today.
Brief Overview
If you’re not familiar with SUI, this is a brief history. SUI primarily owns MH (manufactured home) parks, RV (recreational vehicle) parks, and marinas. They also own some holiday properties from a recent acquisition. They’ve delivered outstanding growth in same-property NOI, AFFO per share, and NAV per share over the last two decades. Consequently, they also delivered enormous returns to shareholders.
My Positions
SUI is one of our largest positions. Among our equity REIT positions, it is the third largest position. It only lands behind American Tower (AMT) and Crown Castle (CCI). We recently increased our position in SUI by buying another 100 shares at $160.40, as shown below:
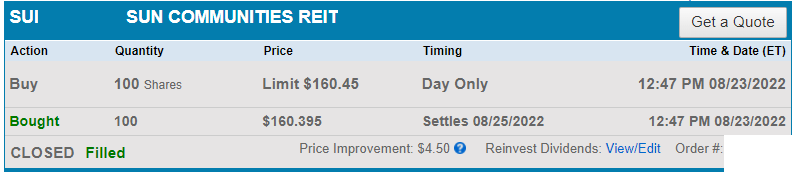
Charles Schwab
For anyone who wonders:
“Is the analyst really bullish or just writing an article?”
I have to ask:
“How would I justify that investment if I wasn’t confident in my call?”
This article won’t bring in $16,040. Not even close. Seriously, even a popular article won’t do that and writing about SUI is not a popular topic. The stock just delivers investors growing dividends, AFFO, and NAV year after year.
Who wants something that consistently performs when they could gamble on junk that could have them replacing feasts in retirement with Fancy Feast in retirement? I’m kidding, of course. I’d never suggest eating Purina, no matter what happened to their portfolio. Losing their retirement money is no reason to buy a brand from Nestlé (OTCPK:NSRGF).
We’ve been investing in SUI for several years. Our oldest four open positions are all in SUI and we’ve bought shares a few other times over the years. The following chart shows all of our open positions in equity REITs:
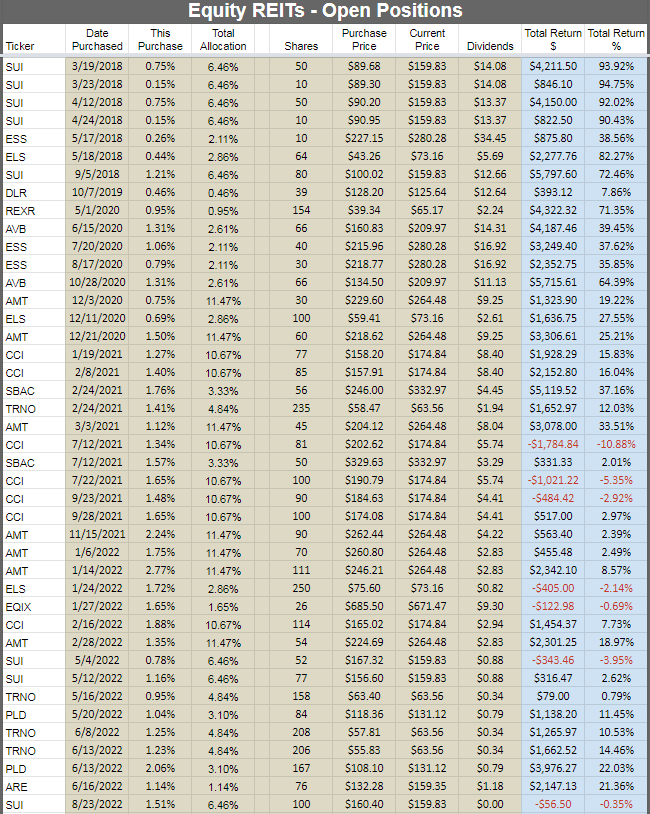
The REIT Forum
We don’t simply “sell the losers to hide them”. However, I don’t want to derail the article by just posting a long trade history. The point is that SUI now stands at over 6.4% of our total portfolio.
Clearly, some of my positions are more concentrated than most investors should be. However, as a REIT analyst, I should be eating my own cooking. I should be willing to stake my own portfolio on my calls. Most people following my research won’t be putting 100% of their portfolio into REITs, but this method makes it easy to compare my calls and performance with the indexes for the sector.
That’s enough about me. It’s time to get back to SUI.
AFFO Growth
The first trait we want to see is consistent growth in AFFO per share. It’s okay for the growth to be lumpy, but negative values should be rare and require a deep understanding of precisely what went wrong. With SUI, literally nothing has gone wrong in a decade. You can tell that just by looking at the AFFO per share:
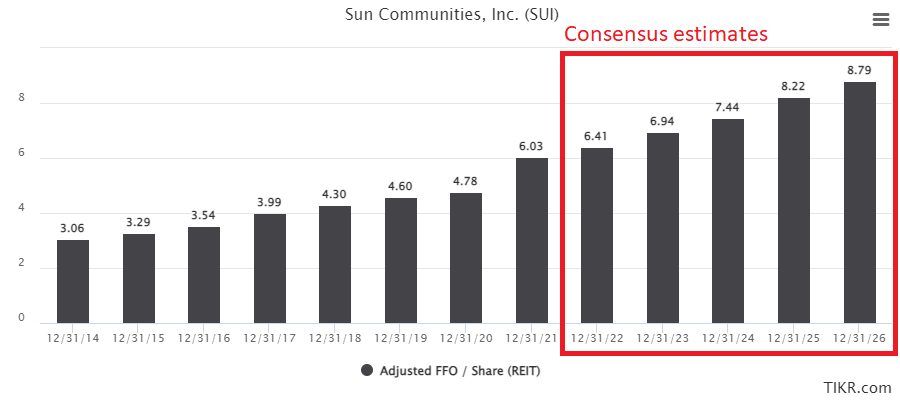
TIKR
AFFO per share grew rapidly with the best growth coming in 2021. That makes sense when you consider that results for 2020 were limited by the pandemic. The high bar set in 2021 also made the year-over-year comparison for 2022 a bit harder.
To look at valuation, we can swap over to using a chart for NTM (Next Twelve Months) AFFO per share. We combine that with the AFFO multiple, and we can see how the share price is moving relative to the cash flows (as represented by AFFO):
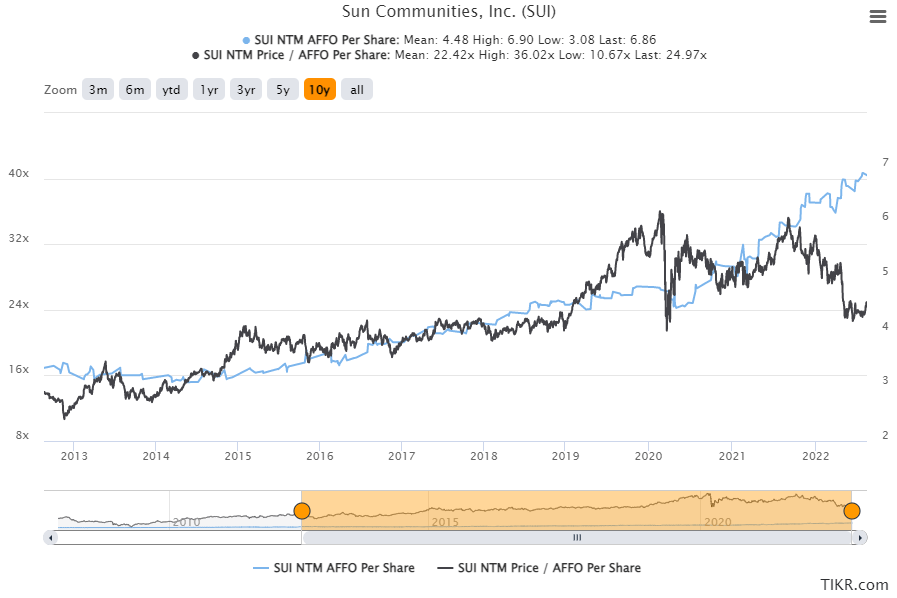
TIKR
As an AFFO multiple, shares were trading slightly above the levels seen from 2015 to early 2019 when they were $171.36 (we just bought more at $160.395). However, they are far below the levels seen from mid-2019 to early 2022. Even during the pandemic, the multiple was only slightly lower. The share price was materially, but cash flow was lower.
So, what’s dragging SUI lower? The “easy” answer might be to say that cap rates moved up and that means NAV (net asset value) is lower. That’s a simple explanation, but it’s not a good one. When you really drill in on the two values, you’ll see an issue:
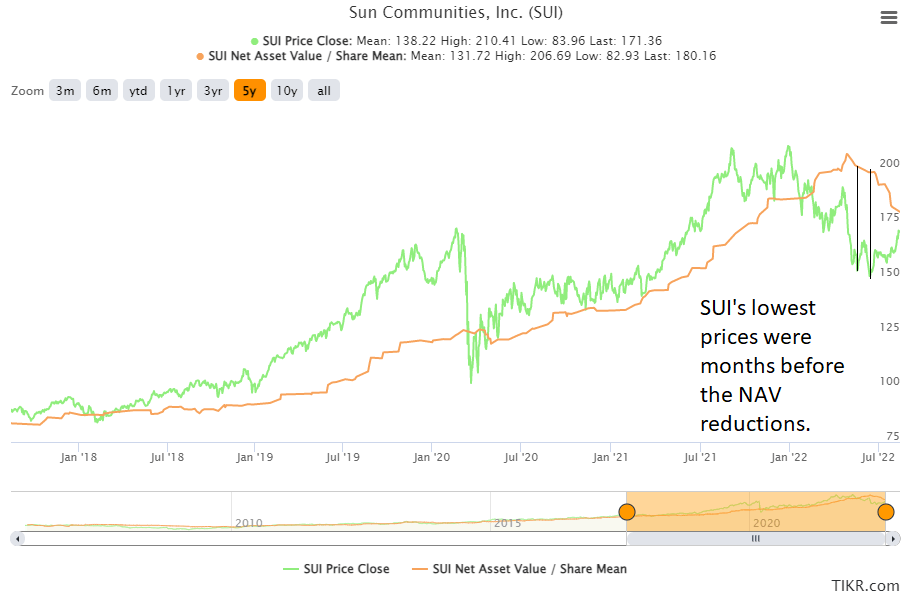
TIKR
For SUI, the consensus NAV estimate dropped by 12.9% from $206.69 to $180.16.
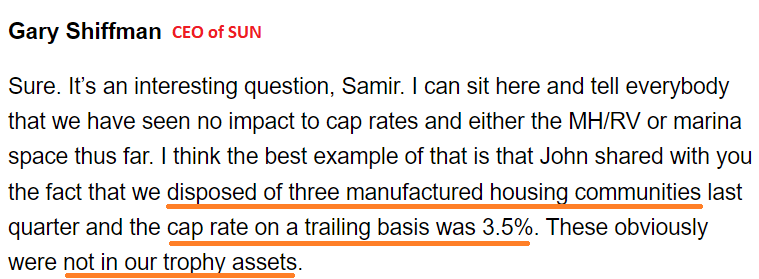
So why are NAV estimates going lower? Management for SUI is quite transparent, and they’ve indicated that cap rates on MH parks moved a bit higher. We can see that development across the earnings calls. We will start with the Q4 2021 earnings call:
Seeking Alpha
After that commentary, NAV estimates bumped a little bit higher.
This is from the commentary on the Q1 2022 earnings call:
Seeking Alpha
Following the call, consensus NAV estimates topped out about two days later at $206.59. NAV estimates slide lower by about 10% prior to the Q2 2022 earnings call:
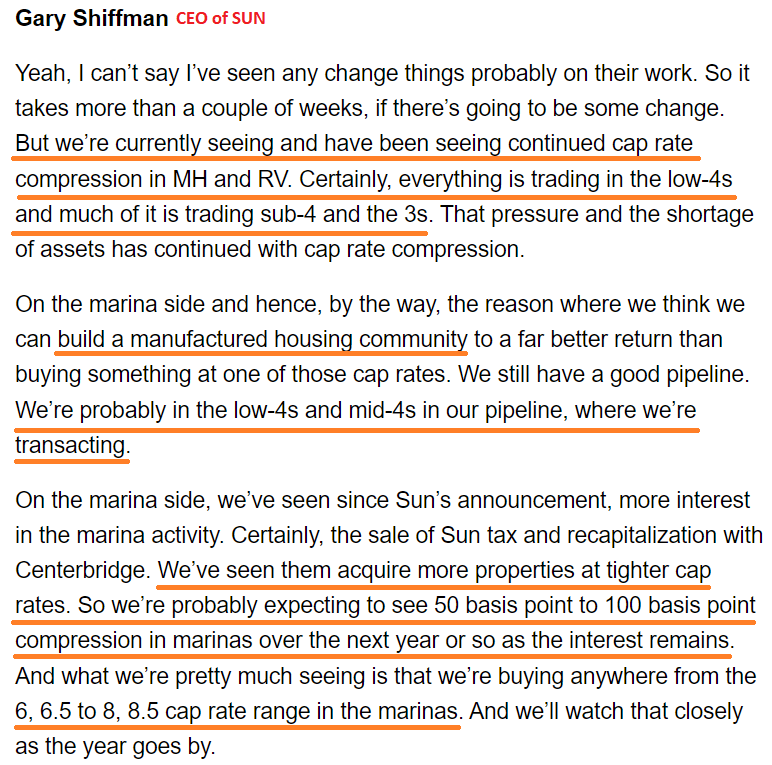
Seeking Alpha
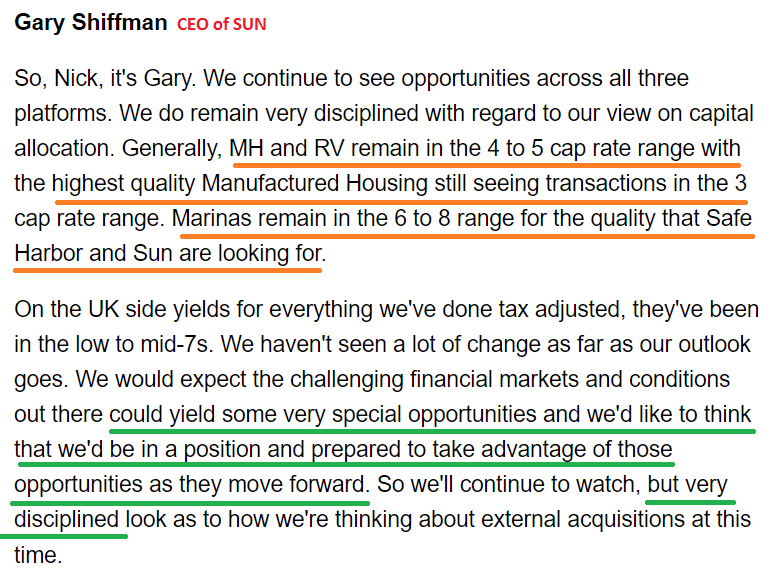
In the Q2 call, we can see marinas are still in the 6% to 8% range, which is a bit lower than the 6% to 8.5% range referenced in Q1. However, the cap rates on MH park and RV transactions moved a bit higher. That brings NAV down, but it hasn’t reduced cash flow at all. Some of the impact from higher cap rates should be offset just by the increase in NOI (Net Operating Income). Given that SUI uses relatively little debt, there isn’t much leverage to swing NAV values.
Should Cap Rates Be Rising?
Clearly, there is a challenge for investors wanting to use debt leverage to juice returns. When those investors can only borrow at rates above the cap rate on the property, it becomes a challenge for leverage. That reduces the pool of buyers and can negatively impact NAV.
However, SUI doesn’t use much debt and our interest in SUI goes deeper than NAV. Higher interest rates should be a fairly small headwind for their ability to generate cash flows for shareholders. When debts are rolled over it has a negative impact on financing costs, but higher rates are also reducing demand for single-family housing. As construction of new housing is insufficient to satisfy demand, it maintains an imbalance between supply and demand. That helps landlords continue to raise rents.
Given the strong growth in rental rates, we should expect AFFO per share to continue growing significantly. This is a major part of our valuation process for SUI, so we see shares offering a great opportunity for investors.
The Cap Rate Problem
If cap rates on MH parks are rising, it makes sense for the cap rates on apartments and single-family rentals to be rising also. Are they? We can certainly argue that with prices steady, cap rates have to be slightly higher. Net Operating Income is increasing. If prices are steady with higher net operating income, the cap rates must be higher. That’s simple math:
Net Operating Income / Cap Rate = Real Estate Price
The question is why analysts are applying higher cap rates more aggressively to SUI than to other housing REITs. It can’t be a reduction in Net Operating Income, because NTM consensus AFFO estimates are very close to record highs. Yet SUI saw consensus NAV estimates hammered while other housing REITs, including Equity LifeStyle (ELS) (similar assets), saw only modest reductions:
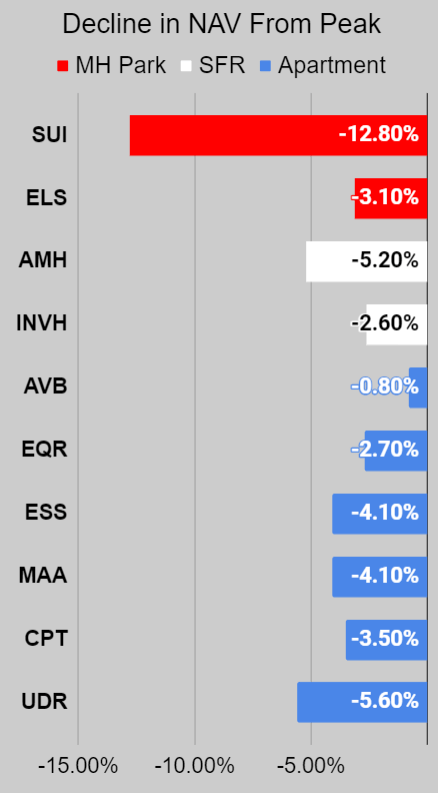
Chart by The REIT Forum, Data from TIKR
Given that future cash flows for SUI remain strong, I’m inclined to disregard the change in consensus NAV estimates. As it stands there are only 5 analysts feeding in estimates and the number has varied between 5 and 7 over the last year, which can distort the average.
I think the estimates for the other housing REITs are pretty reasonable on average. SUI is the outlier.
This is a benefit of covering several REITs with similar property types. An analyst who tries to cover stocks from every sector just to “have coverage” in their service could easily forget to run comparisons on several of the other REITs.
Conclusion
With shares of SUI dipping down to about $160, shares look great. We bought more to take advantage of the fall into the Strong Buy range:
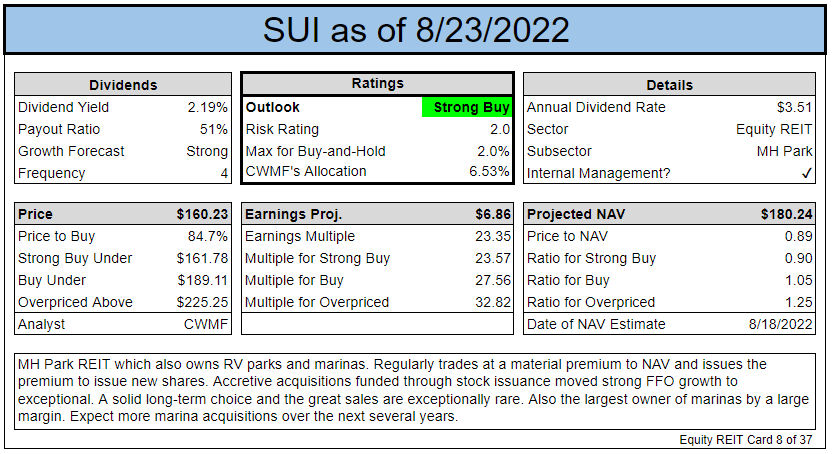
The REIT Forum
They carry a material discount to the consensus NAV, which looks a bit low anyway. On an AFFO basis, SUI is trading at only 23.35x forward consensus AFFO. That is unusually cheap:
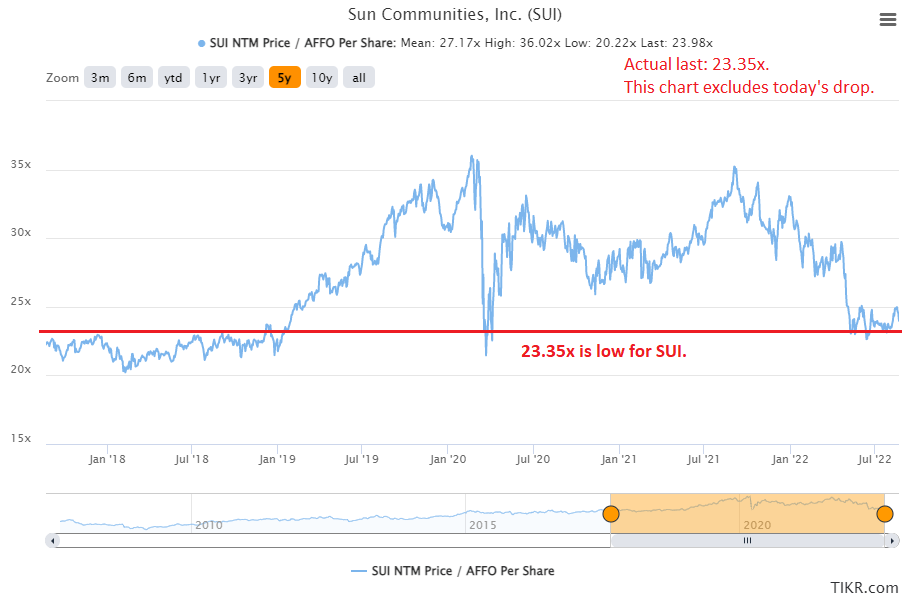
TIKR
With AFFO growth projected to average about 8% over the next several years, investors are looking at returns driven by a combination of:
- Dividend yield (2.2%)
- AFFO growth (8% average)
- Multiple adjustment
Even if the multiple only remained at 23.35x, the combination of dividend yield and AFFO growth would suggest returns above 10%. That’s excellent.
Of course, we could always say that 8% growth plus over 2% in yield would be above 10%. When the price falls, it doesn’t move the yield that much. However, it does provide a more attractive starting multiple and that gives us a greater margin for safety so long as we’re getting the same high-quality REIT. SUI is certainly a high-quality REIT.
Buying weak REITs at a low multiple is not even remotely safe. Weak REITs tend to demonstrate declines in AFFO per share or inflate AFFO per share with low-quality adjustments. We don’t want those.
However, buying high-quality REITs at a below-average multiple (27.17x average vs. 23.35 today) has been a great technique. If the AFFO multiple increases in the next few years, it would further enhance returns to investors.
Note: I believe the consensus estimates for AFFO per share growth are reasonable on average. In practice, there will probably be some volatility. Clearly, 2021 is an example of extreme volatility within the growth rate. If the estimates were materially different from our expectations, it would be important to address.
Be the first to comment