

Gregory Machiniak/iStock via Getty Images
Introduction
I’ve written a lot of articles this year on high-quality businesses where I share the prices I would be willing to buy the stocks. Often those “buy prices” are much deeper than the prices the stocks were trading at the time I wrote the articles, and readers thought my buy prices were unrealistically low. So, in today’s article, I thought I would share a stock I recently purchased that has fallen to buyable levels: Fidelity National Information Services (NYSE:FIS).
According to their annual report:
FIS is a leading provider of technology solutions for merchants, banks, and capital markets firms globally. Our employees are dedicated to advancing the way the world pays, banks and invests by applying our scale, deep expertise and data-driven insights. We help our clients use technology in innovative ways to solve business-critical challenges and deliver superior experiences for their customers.
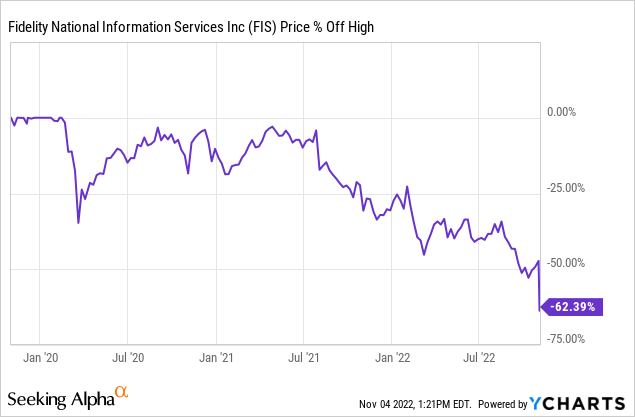
Here is how far the stock is off its recent highs.
In this article, I will take readers through my process for valuing the stock.
My Valuation Method For Fidelity National Information Systems
The valuation method I use for FIS first checks to see how cyclical earnings have been historically. Once it is determined that earnings aren’t too cyclical, then I use a combination of earnings, earnings growth, and P/E mean reversion to estimate future returns based on previous earnings growth and sentiment patterns. I take those expectations and apply them 10 years into the future, and then convert the results into an expected CAGR percentage. If the expected return is really good, I will buy the stock, and if it’s really low, I will often sell the stock. In this article, I will take readers through each step of this process.
Importantly, once it is established that a business has a long history of relatively stable and predictable earnings growth, it doesn’t really matter to me what the business does. If it consistently makes more money over the course of each economic cycle, that’s what I care about.
FAST Graphs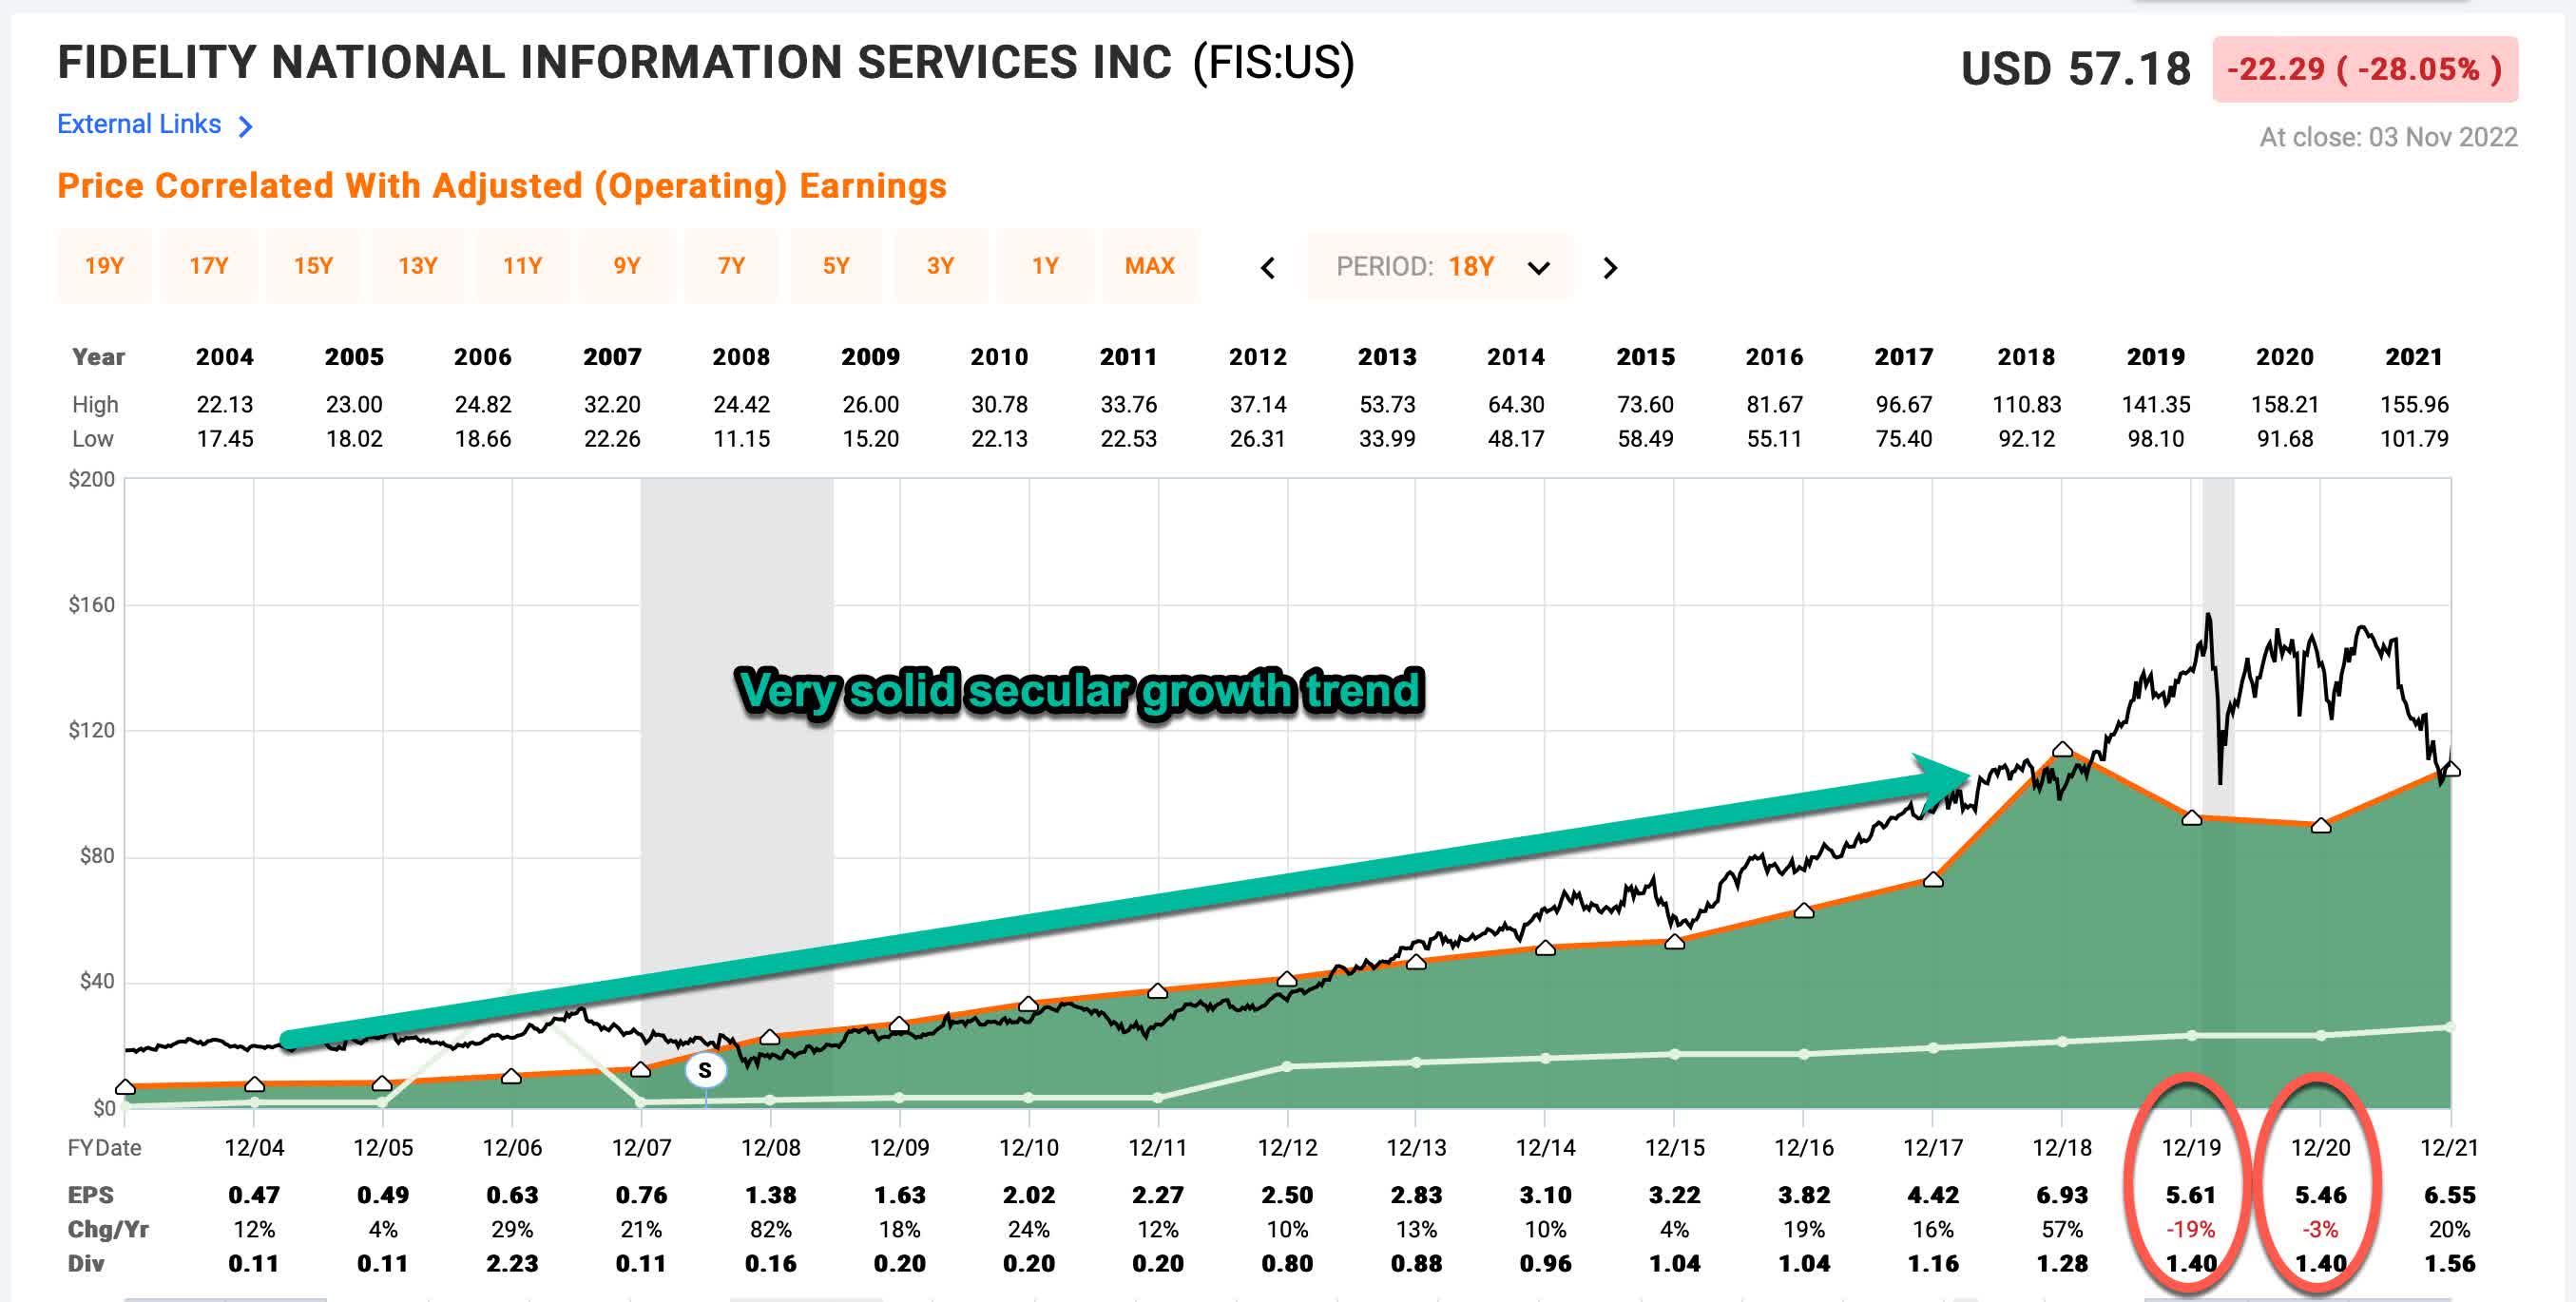
For most of the past 20 years, FIS has grown earnings at a very steady and consistent rate. They even grew EPS through the 2008/9 recession which is very impressive and rare to see. They have only had two negative EPS growth years, both of them fairly recently. One was in 2019 and was on the back of an unusually big EPS growth year in 2018, so one shouldn’t be surprised if EPS fell back to the historical trend the following year. And in 2020 we had COVID issues that muddied the waters of EPS as well. But EPS growth recovered nicely in 2021, so I’m inclined to give FIS the benefit of the doubt when it comes to the longer positive EPS growth trend.
Even if we took a pessimistic view of the EPS declines in 2019 and 2020, they still are only moderately deep, and wouldn’t be enough for me to classify FIS as a deep cyclical stock. For that reason, it is appropriate to use an analysis based on earnings and earnings growth expectations. (If earnings had been more cyclical, I would use a different valuation technique.)
FIS – Market Sentiment Return Expectations
In order to estimate what sort of returns we might expect over the next 10 years, let’s begin by examining what return we could expect 10 years from now if the P/E multiple were to revert to its mean from the previous economic cycle. For this, I’m using a period that runs from 2015-2022.
FAST Graphs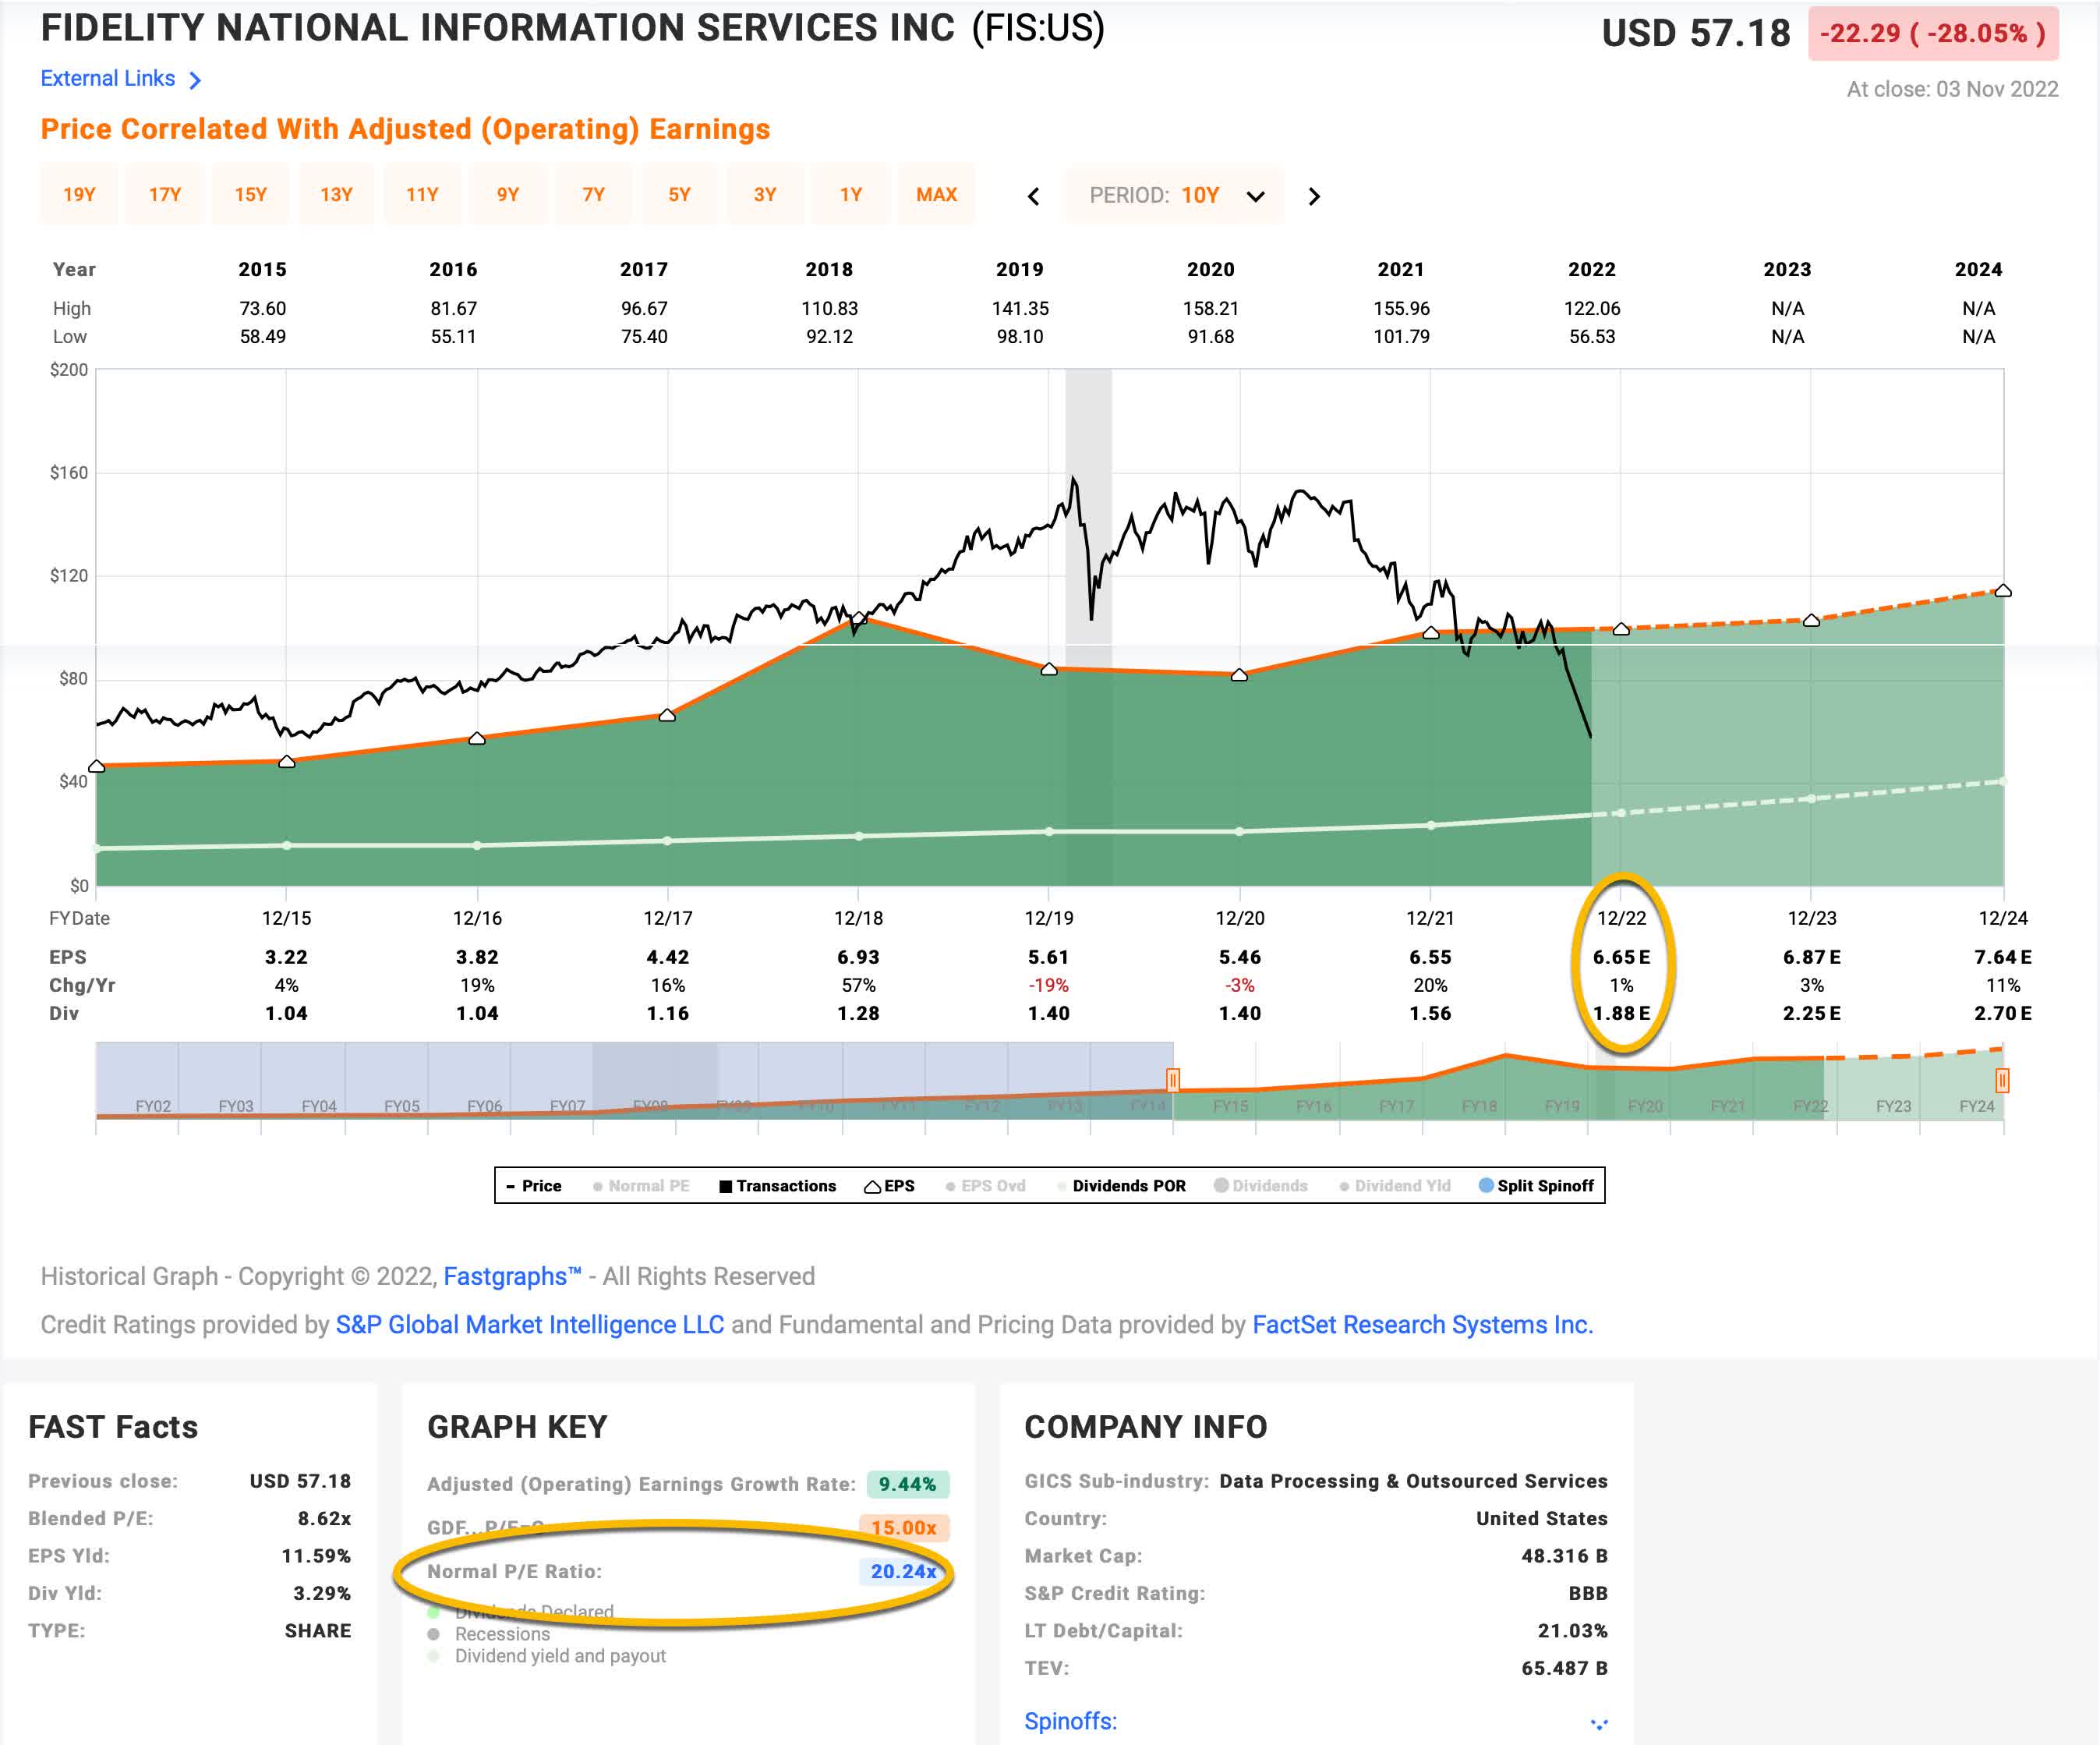
FIS’s average P/E from 2015 to the present has been about 20.24 (the blue number circled in gold near the bottom of the FAST Graph). Using 2022’s forward earnings estimates of $6.65 Fidelity National has a current P/E of 9.02. If that 9.02 P/E were to revert to the average P/E of 20.24 over the course of the next 10 years and everything else was held the same, FIS’s price would rise and it would produce a 10-Year CAGR of +8.42%. That’s the annual return we can expect from sentiment mean reversion if it takes 10 years to revert. If it takes less time to revert, the return would be higher.
Business Earnings Expectations
We previously examined what would happen if market sentiment reverted to the mean. This is entirely determined by the mood of the market and is quite often disconnected, or only loosely connected, to the performance of the actual business. In this section, we will examine the actual earnings of the business. The goal here is simple: We want to know how much money we would earn (expressed in the form of a CAGR %) over the course of 10 years if we bought the business at today’s prices and kept all of the earnings for ourselves.
There are two main components of this: the first is the earnings yield and the second is the rate at which the earnings can be expected to grow. Let’s start with the earnings yield (which is an inverted P/E ratio, so the Earnings/Price ratio). The current earnings yield is about +11.11%. The way I like to think about this is, if I bought the company’s whole business right now for $100, I would earn $11.11 per year on my investment if earnings remained the same for the next 10 years.
The next step is to estimate the company’s earnings growth during this time period. I do that by figuring out at what rate earnings grew during the last cycle and applying that rate to the next 10 years. This involves calculating the historical EPS growth rate, taking into account each year’s EPS growth or decline, and then backing out any share buybacks that occurred over that time period (because reducing shares will increase the EPS due to fewer shares).
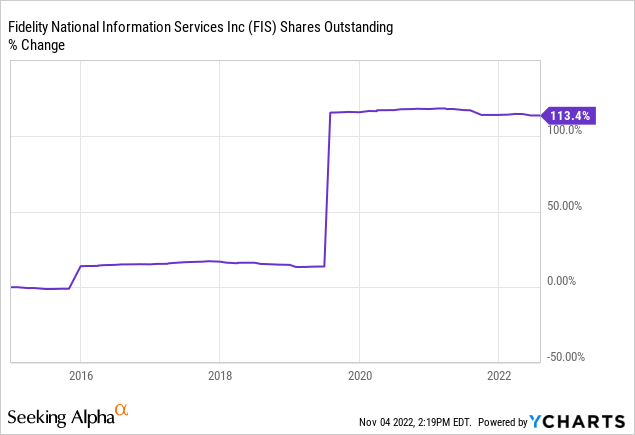
Since FIS issued a lot of shares for M&A over this time period, shares outstanding have actually increased, so I don’t need to control for them. However, this does bring up the issue of big M&A. Since I use adjusted earnings for my valuations and because usually M&A doesn’t work out nearly as well as management expects it to, my rule of thumb is that if a company has had big M&A that represents more than 20% of its market cap, then I avoid buying the stock for 3 years after the M&A. This usually gives enough time for the earnings of the new company to reflect reality, and for write-offs to occur, or at least give time for any unrealistic expectations to wear off. FIS has just recently passed that 3-year marker.
While I don’t need to make any adjustments for share buybacks, I will adjust for the two down EPS years in 2019 and 2020. When I do that, I get an earnings growth rate of +10.04% for this period.
Next, I’ll apply that growth rate to current earnings, looking forward 10 years in order to get a final 10-year CAGR estimate. The way I think about this is, if I bought FIS’s whole business for $100, it would pay me back $11.11 plus +10.04% growth the first year, and that amount would grow at +10.04% per year for 10 years after that. I want to know how much money I would have in total at the end of 10 years on my $100 investment, which I calculate to be about $295.17 including the original $100. When I plug that growth into a CAGR calculator, that translates to a +11.43% 10-year CAGR estimate for the expected business earnings returns.
10-Year, Full-Cycle CAGR Estimate
Potential future returns can come from two main places: market sentiment returns or business earnings returns. If we assume that market sentiment reverts to the mean from the last cycle over the next 10 years for FIS, it will produce a +8.42% CAGR. If the earnings yield and growth are similar to the last cycle, the company should produce somewhere around a +11.43% 10-year CAGR. If we put the two together, we get an expected 10-year, full-cycle CAGR of +19.85% at today’s price.
My Buy/Sell/Hold range for this category of stocks is: above a 12% CAGR is a Buy, below a 4% expected CAGR is a Sell, and in between 4% and 12% is a Hold. A +19.85% expected CAGR makes Fidelity National Information Services a “Buy” at today’s price using my basic analysis, but since we are likely going into a recession in 2023, I’m going to factor that possibility in as well.
Recession Considerations
My base case is that the US economy starts a recession at some point in Q1 2023, and a lot of stocks are now (finally) starting to price that in. I believe that’s what FIS has done this past week after they missed earnings expectations. One of the methods I use to help keep me from buying too early while earnings for the businesses are in the process of being brought down is to use what I call the “Recession P/E” factor. The “Recession P/E” is the lowest monthly P/E the stock experienced during the previous cycle. Usually, it occurs during an economic recession, but not always. In FIS’s case, its low P/E actually occurred in 2011 when the monthly P/E bottomed at 10.06.
What I’ve been doing for stocks that I analyze using this strategy since March 2022, is to require that the current P/E be lower than the Recession P/E. In Fidelity’s case, their current 9.02 P/E is lower than 10.06, so after the stock price fell on Friday, this final condition was met, and in my marketplace service, The Cyclical Investor’s Club, we bought a 1% portfolio-weighted position in the stock.
Conclusion
I invest with a medium-term time frame in mind, which I consider to be about 3-5 years, so that’s how far forward I’m looking with this investment. If we have a recession as expected in 2023, it is absolutely possible the stock price goes lower from here. So, I’m not trying to pick the bottom. What I’m trying to do is buy at a price where I think the future medium-term returns will be attractive if the business returns to a similar earnings growth pattern that it had in the past. And I try to give myself as much of a margin of safety as I can, both in an effort to try to maximize returns, but also in case Fidelity National’s business emerges from the coming recession weaker than it was in the past, I can limit my potential losses.
My approach with this strategy is to be able to act swiftly and decisively when a stock meets the required conditions. I mitigate the risks of acting swiftly, rather than doing weeks of deep work on the business and industry, by taking small, 1% portfolio-weighted positions. If an investor wanted to invest a higher portfolio-weighted position than 1% or 2%, I would strongly suggest doing deeper work. Because I’ve been doing this for a while, I know this strategy produces positive returns 2-3 years later about 85% of the time. However, I don’t know ahead of time which stocks will be the 15% that fail. So, I spread my bets around and play the odds. Any price below $66.90 I consider Fidelity National Information Systems a “Buy”.
Be the first to comment