


You are welcome!
fotofrog/E+ via Getty Images
The Nasdaq peaked on Nov. 22 of last year at 16,212. The valuation ratios also peaked at that time. The Nasdaq recently hit a low of 10,565 on June 16 of this year. That represents an ugly drop of 34.8% during that seven-month period of time. I would blame excessive valuations and rising interest rates as the main culprit for the quick and sudden drop. The Nasdaq is now attempting a trend reversal. Has the Nasdaq finally bottomed?
The S&P 500 index peaked at a forward PE ratio of about 24X back in November of last year. The average PE ratio over the last 10 years is more in the 16-18X range. That excessive 33% premium in the multiple has now been taken out of the market and almost matches exactly the magnitude of the sell-off in the Nasdaq. The sell-off in the S&P 500 has been 25% since last November. The sell-off in the Nasdaq has been greater because it began with even more excessive valuation ratios than the S&P 500.
The S&P 500 index peaked at a forward PE ratio of about 24X back in November of last year. The average PE ratio over the last 10 years is more in the 16-18X range. That excessive 33% premium in the multiple has now been taken out of the market and almost matches exactly the magnitude of the sell-off in the Nasdaq. The sell-off in the S&P 500 has been 25% since last November. The sell-off in the Nasdaq has been greater because it began with even more excessive valuation ratios than the S&P 500.
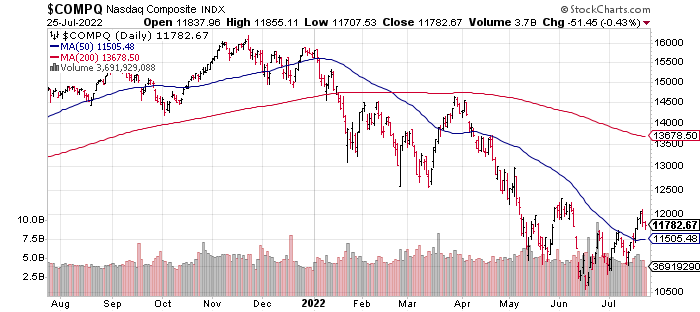
Bottom? (StockCharts.com)
Now, let’s go back to the chart above. The Nasdaq started forming a bottom back in early May. We now have a decent bottom formation of about 10 weeks. We also now have a very good attempt at a trend reversal to the upside in place.
This same pattern also shows up in the chart of the S&P 500 below. Also, note on the chart below how the S&P 500 has now broken above its 50-day moving average. This is very encouraging!
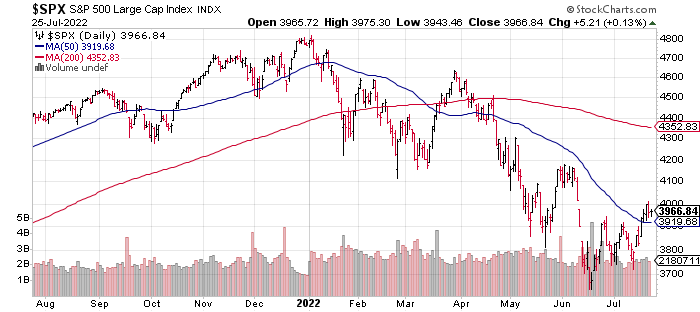
Bottom? (StockCharts.com)
The DJIA is also following in the Nasdaq’s and the S&P 500’s footsteps.
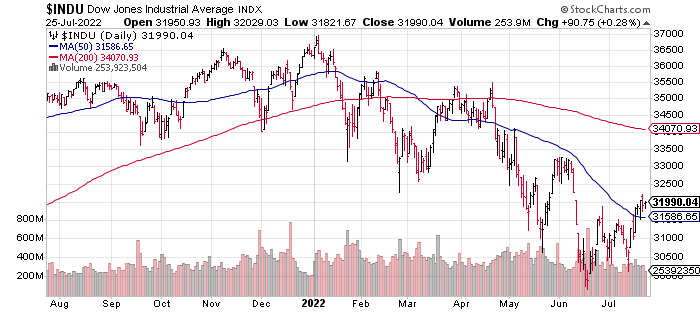
Also a bottom? (StockCharts.com)
There are no guarantees that these fresh, new trend reversals will follow through, but there are more reasons (other than technical analysis) for optimism here.
While the multiple (forward PE ratio) of the S&P 500 has contracted from 24X down to 17X, the earnings expectations have not contracted.
With a little over 20% of the S&P 500 companies now reporting earnings (with other than a few extreme exceptions), the earnings have mostly been in-line with estimates.
Furthermore, the guidance going forward has also been in line with expectations. I have not yet seen any damage to the earnings side of the valuation equation.
Another 175 companies from the S&P 500 will report earnings this week. These reports will be very critical. Can we maintain the trend of inline estimates for earnings and the recent technical trend reversals in the major averages?
So far so good. I’m finding some new buys in the healthcare, energy, and tech sectors on a daily basis!
Best Stocks Now Premium gives you access to Bill Gunderson, professional money manager & analyst with 23 years of experience.
You get Bill’s daily “live” buys and sells in his four portfolios: Emerging Growth, Ultra-Growth, Premier Growth, and Dividend & Growth. These portfolios have done very well since their 1/1/2019 inception.
JOIN NOW to get daily “live” buys and sells, weekly in-depth market-timing newsletter, access to Bill’s proprietary database with daily rankings on over 6,000 securities, and a daily live radio show!
Be the first to comment