

RiverNorthPhotography
One of the things that makes writing about companies enjoyable for me is learning about their histories. I find it fascinating to understand the people and their families who started their companies, the circumstances under which they began operations and the legacy they and their companies have left for future generations. One such company that had an interesting beginning is today’s Huntington Bancshares Incorporated (NASDAQ:HBAN), founded in 1866 as P.W. Huntington & Co.
P.W. Huntington was a banker from Ohio who ran the bank until 1918, when he handed the bank over to his three “Banking Sons” who ran the bank until 1958. P.W.’s great-grandfather, Benjamin Huntington, was a lawyer and politician from Connecticut who served as a delegate to the Second Continental Congress and was a member of the U.S. House of Representatives during the First U.S. Congress. Another relative, Samuel Huntington, was also a Connecticut politician who signed the Declaration of Independence and served as Governor of Connecticut. Finally, a different Samuel Huntington, the nephew and later adopted son of the other Samuel Huntington, was the third Governor of Ohio.
For some reason, P.W. Huntington avoided a career in politics, instead learning the banking industry from a very young age. Later, after hearing the U.S. Comptroller, Hugh McCullough, speak in support of the National Currency Act and state that “the capital of a bank should be a reality and not a fiction”, P.W. adopted his own creed – “Credit is a subtle thing”, with the understanding that lending money should be “scrutinized” and approached very “carefully”.
Over 150 years later, management of Huntington Bancshares is still following that sage advice. Huntington is now a regional banking powerhouse, having merged with Detroit-based TCF Bank in 2021. Now with over 18,000 employees operating in 11 states, the company has over $179 billion in total assets. Additionally, the company has paid a dividend every year since at least 1980.
While past performance is certainly not indicative of future results, by most measures, the company is a solid performer, and its stock performance has reflected this strong growth. P.W. Huntington may not have foreseen how the company has expanded across the mid-West. However, one thing that he would probably recognize is the fact that the company by all appearances has carefully scrutinized its money and lent it very carefully all these years.
Income Statement
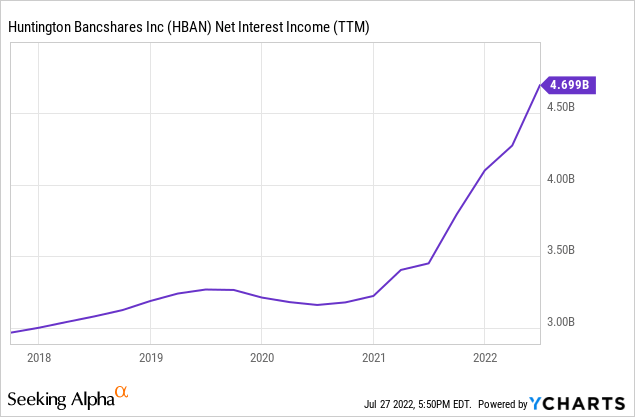
Now with the history lesson out of the way, we should examine the income statement, beginning with the top line revenues. For banks, net interest income is the primary driver of the top-line since lending, via deposits, is the primary business of a bank. In 2021, inclusive of the TCF Bank results, interest income increased 15% from 2020. This combined with an actual decrease in interest expense resulted in net interest income of $4.1 billion, 27% higher than the prior year. This strong growth has continued through the first half of this year with six-month net interest income of $2.4 billion, 33% higher than the first half of 2021. It should be noted the TCF merger closed in June 2021, so year over year comparisons are not totally apples-to-apples. Either way, the company is exhibiting really strong NII growth, especially with rising interest rates serving as a potential headwind.
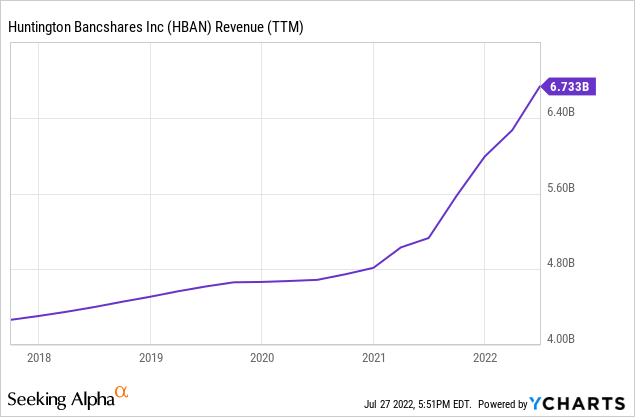
As for noninterest revenues, the company’s primary business is personal and commercial banking, with the majority of noninterest revenues comprised of service charges on deposit accounts, card fees and mortgage banking revenues. Altogether, noninterest revenues have grown 10% annually over the past five years, led by a strong increase in mortgage banking and credit card fees. It should be noted, however, that mortgage banking revenues dropped 44% in the first half of this year compared to 2021, mainly due to the increase in mortgage rates and general decrease in housing affordability. Overall, though, noninterest revenues increased 17% in the first half of this year. The chart below illustrates total revenue growth (TTM):
On the expense side, the company has done an excellent job maintaining expenses. Compensation is typically the largest expense category for financial firms. At HBAN, the compensation expense ratio has averaged 0.36 over the past five years, with 2021 coming in at 0.39, slightly higher than average. Through the first half of 2022, the ratio is 0.34, which is slightly below the historical average. The efficiency ratio, a measure of overall expenses, has averaged 0.62 over the past five years, with 2021 spiking to 0.73. This was primarily due to TCF Bank merger related expenses. Through the first six months of this year, the efficiency ratio was 0.61, slightly below the long-term average.
| 2015 | 2016 | 2017 | 2018 | 2019 | 2020 | 2021 | 2022YTD | |
| Comp Ratio | 0.38 | 0.38 | 0.35 | 0.35 | 0.35 | 0.35 | 0.39 | 0.34 |
| Efficiency Ratio | 0.66 | 0.68 | 0.63 | 0.59 | 0.58 | 0.58 | 0.73 | 0.61 |
Source: sec.gov, company filings
The period during and after a merger often result in unusual financial results. Investors need to make sure that as the integration progresses, expenses fall in line with the long-term trends, or at least stabilize to a much more moderate level post-acquisition.
Another line item unique to banks is the provision for loan losses. For HBAN, the average provision for loan losses has been 7.6% of total net revenues over the past five years. In 2020, because the pandemic shut down most of the economy, the provision ballooned to 22% of net revenues. Last year, as the economy got back toward normal and many workers returned to work, the provision was less than 1% of net revenues. So far this year, the provision is trending upward to 3.8% of net revenues in Q2.
| 2015 | 2016 | 2017 | 2018 | 2019 | 2020 | 2021 | 2022YTD | |
| Provision for loan loss ($m) | $100 | $191 | $201 | $235 | $287 | $1,048 | $25 | $184 |
| % of total revenues | 3.3% | 5.4% | 4.7% | 5.2% | 6.1% | 21.8% | 0.4% | 2.7% |
Source: sec.gov, company filings
Obviously, the economic backdrop is somewhat questionable at this moment, with rising inflation, higher interest rates, war in Ukraine and stubborn supply chain logjams. If economic conditions do not improve, investors can expect the provisions for loan losses to continue to increase, although I would not expect the same levels as 2020. However, if a recession does indeed take hold, then it would not be unreasonable to expect a provision of the level seen in 2020.
The bottom-line net income numbers are solid for HBAN. Operating margins have averaged 30% over the past five years, with 2021 coming in at 27%. However, the first half of this year has been even stronger, with an operating margin of 36%. Five-year net income for common stockholders has increased at 12.2% annually, with EPS increasing at a respectable 5.2% annually over the same period. In the first half of 2022, net income more than doubled to $943 million, while EPS increased 60% to $0.64 per share.
Balance Sheet
Turning to the balance sheet, total assets have increased 11.8% annually over the five-year period. Loan growth has been a solid 10.6% annually over this time, inclusive of the results of the TCF merger as of the end of 2021. Total liabilities have kept pace with assets with an 11.6% annual growth over the five-year period. Deposit growth has been key, resulting in a 13.6% annual five-year growth rate. One interesting point about deposits that the company pointed out in their Q2 presentation is the interest rate on deposits. It is basically flat over the past several years. This bodes well for future net interest income growth.
Huntington Bancshares Q2 Presentation
Notably, long-term debt has decreased over 3% annually over the past five years. Finally, equity has increased 13.4% annually, primarily driven by an increased reliance on preferred stock as a source of capital. However, common equity and tangible common equity have both increased 13.1% and 11.0%, respectively, over the past five years.
Ratios
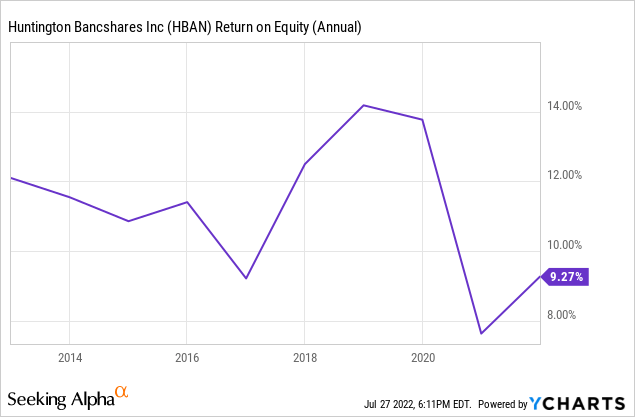
Return on equity has actually decreased over the past couple of years, from a high of 12.7% in 2018 to 8.0% at the end of 2021. At the end of Q2, ROE was 8.6%, a slight improvement over the end of the year. Return on common equity has followed the same trend, declining from a peak of 13.5% in 2018 to 8.3% in 2021. At the end of Q2, ROCE was 8.0%, slightly lower than the end of 2021. One item that is reducing the equity is the Accumulated Other Comprehensive gain (loss). The AOCI was a $2.1 billion loss at the end of Q2, compared to a loss of $105 million a year ago. This decrease primarily reflects the unrealized losses on securities, most likely due to losses on interest rate sensitive securities. As the markets turn around, this would improve, which would improve the equity position and the ROE/ROCE figures.
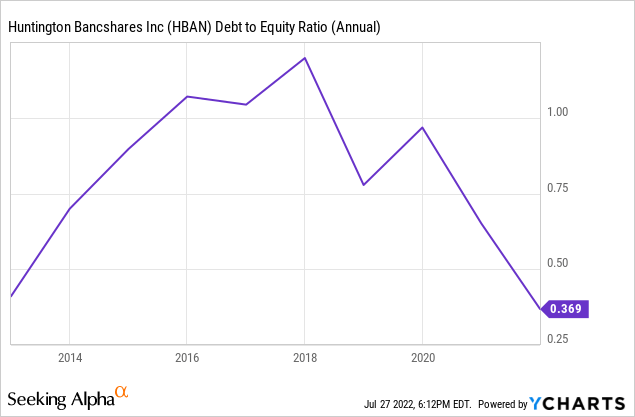
Debt to equity has steadily decreased, from a high of 1.32 in 2017 to just 0.39 in 2021. Similarly, debt to total assets has decreased from 0.09 in 2017 to 0.04 in 2021. Interest coverage ratios are strong, typically fluctuating between 2.7x and 5.6x interest. Full year 2021 was skewed because of adjustments made due to the merger. First half 2022 interest coverage was a very healthy 11.3x.
Credit Quality
In terms of credit quality, the company maintains excellent credit. Net charge offs in 2021 were 0.22% of loans, while non-performing assets were 0.67% of total loans. Both of these metrics improved, surprisingly, through the first half of 2022. The allowance for loan losses did tick up slightly from the end of 2021 to the end of Q2. This metric does bear scrutiny as it has increased a fair amount from where it was three or four years ago.
Stock Performance and Valuation
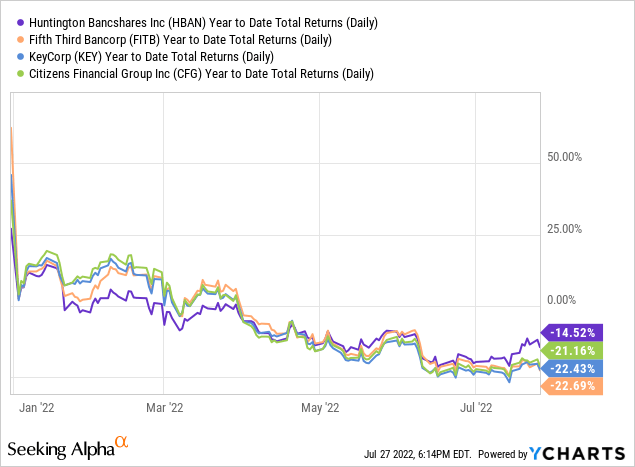
HBAN is a good, quality regional bank. Investors could certainly do a lot worse in this particular sector. Like many stocks this year, HBAN is down. Compared to several of its peers, HBAN has outperformed on a YTD basis.
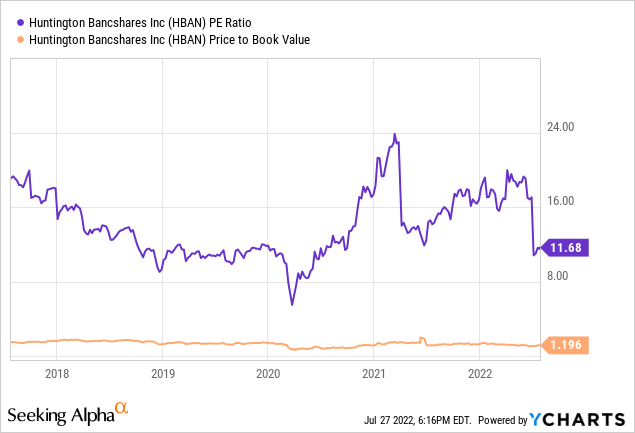
At a recent price of $12.85, the stock is trading at 12x last twelve months earnings with a 1.2x book value ratio. Both of these valuation figures are slightly below the stock’s five-year averages, reflecting lower EPS growth.
Furthermore, with EPS growth of 5.2%, the PEG ratio (P/E to Growth) is 2.3x. Compared to several of its peers, HBAN has a higher P/E ratio:
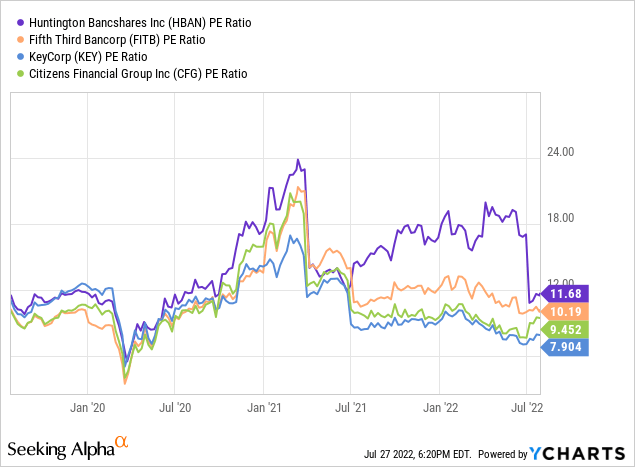
On a P/B basis, HBAN is toward the lower end:
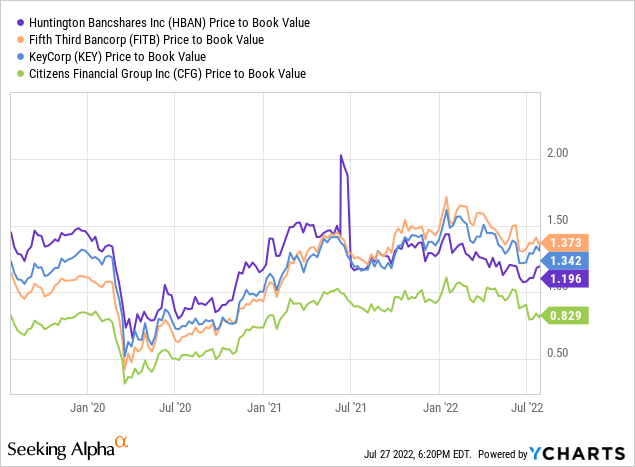
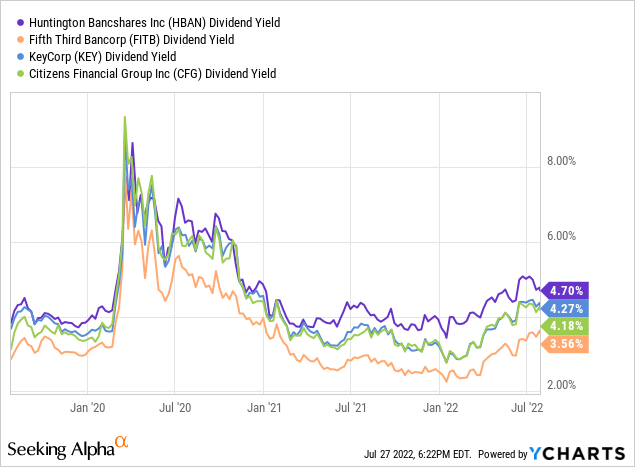
Using a variety of valuation methods, the fair value for this stock is about $14, so the stock is currently slightly underpriced. It does provide an above average yield of 4.67%, which is above the peer average of 3.81%.
As mentioned previously, EPS has grown at a 5% annualized clip over the past five years. If that can continue, along with a 4-5% yield, that is a solid 9-10% annual return, which for a bank is really good. I do not see a great deal of risk with HBAN, other than the big caveat which, of course, is that the economy does not slip into a deep or even a mild recession. If interest rates continue to rise, I think that is good for HBAN as they have proven they can maintain strong net interest income. However, at some point, deposit rates will have to increase to maintain market share.
Huntington Bancshares is a good, strong regional bank. For investors looking for steady dividends and earnings growth, it might be worth a look. The stock is currently priced at a slight discount. With a good, safe dividend, HBAN could be a solid option for investors who are looking for a bank that has really seen it all since 1866.
Be the first to comment