

felixR
We live in a large and connected world that, in order to operate, requires a significant amount of infrastructure. This includes infrastructure dedicated to various electrical solutions and utilities. One firm that focuses on providing offerings under this umbrella is Hubbell Incorporated (NYSE:HUBB). With a market capitalization of $12.60 billion as of this writing, the firm is a fairly sizable enterprise. Because of the COVID-19 pandemic, the business struggled from a revenue and profit perspective for a couple of years. But since then, it has returned to growth. In 2022, in particular, sales and cash flows were posting robust year-over-year improvements. Long term, I suspect this trend will continue. But this doesn’t necessarily mean that investors would be wise to pick up a stake in the business. Given how shares are priced right now, my belief is that the company is more or less fairly valued. Because of that, instead of taking a bullish stance on the firm, I have decided to rate it a ‘hold’ to reflect my view that returns should be similar to what the broader market should achieve moving forward.
A niche industrial play
According to the management team at Hubbell, the company operates as a world-class manufacturer of electrical and utility solutions. In total, it has no fewer than 75 brands that are used across the globe. To truly understand the company though, we need to dig a bit deeper. And what better way to do that than to break up the enterprise into the two key operating segments that it consists of.
The first of these units is the Electrical Solutions segment. For the most part, this segment meets the needs ‘Behind the Meter’. What this means, according to management, is that it meets the needs where owners and operators of building and other critical infrastructure actually consume energy. Specific products sold under this segment have applications in industrial, nonresidential, wireless communications, transportation, data center, and other related markets. The specific products that it sells include, but are not limited to, application wiring device products, connector and grounding products, lighting fixtures, and other electrical equipment. During the company’s 2021 fiscal year, this unit was responsible for roughly 44% of the revenue that Hubbell generated.
The other segment that the company has is the Utility Solutions segment. This includes operations that focus on both the ‘Front of the Meter’ and at ‘The Edge’. The former focuses on products and services where utilities transmit and distribute energy to their customers, while the latter connects utilities with owners and operators, and allows energy and data to be distributed back and forth. Specific examples include insulators, connectors, anchors, bushings, enclosures, smart meters, protection and control devices, and tomorrow. This is the largest of the company’s revenue sources, accounting for 56% of all sales in 2021.
Author – SEC EDGAR Data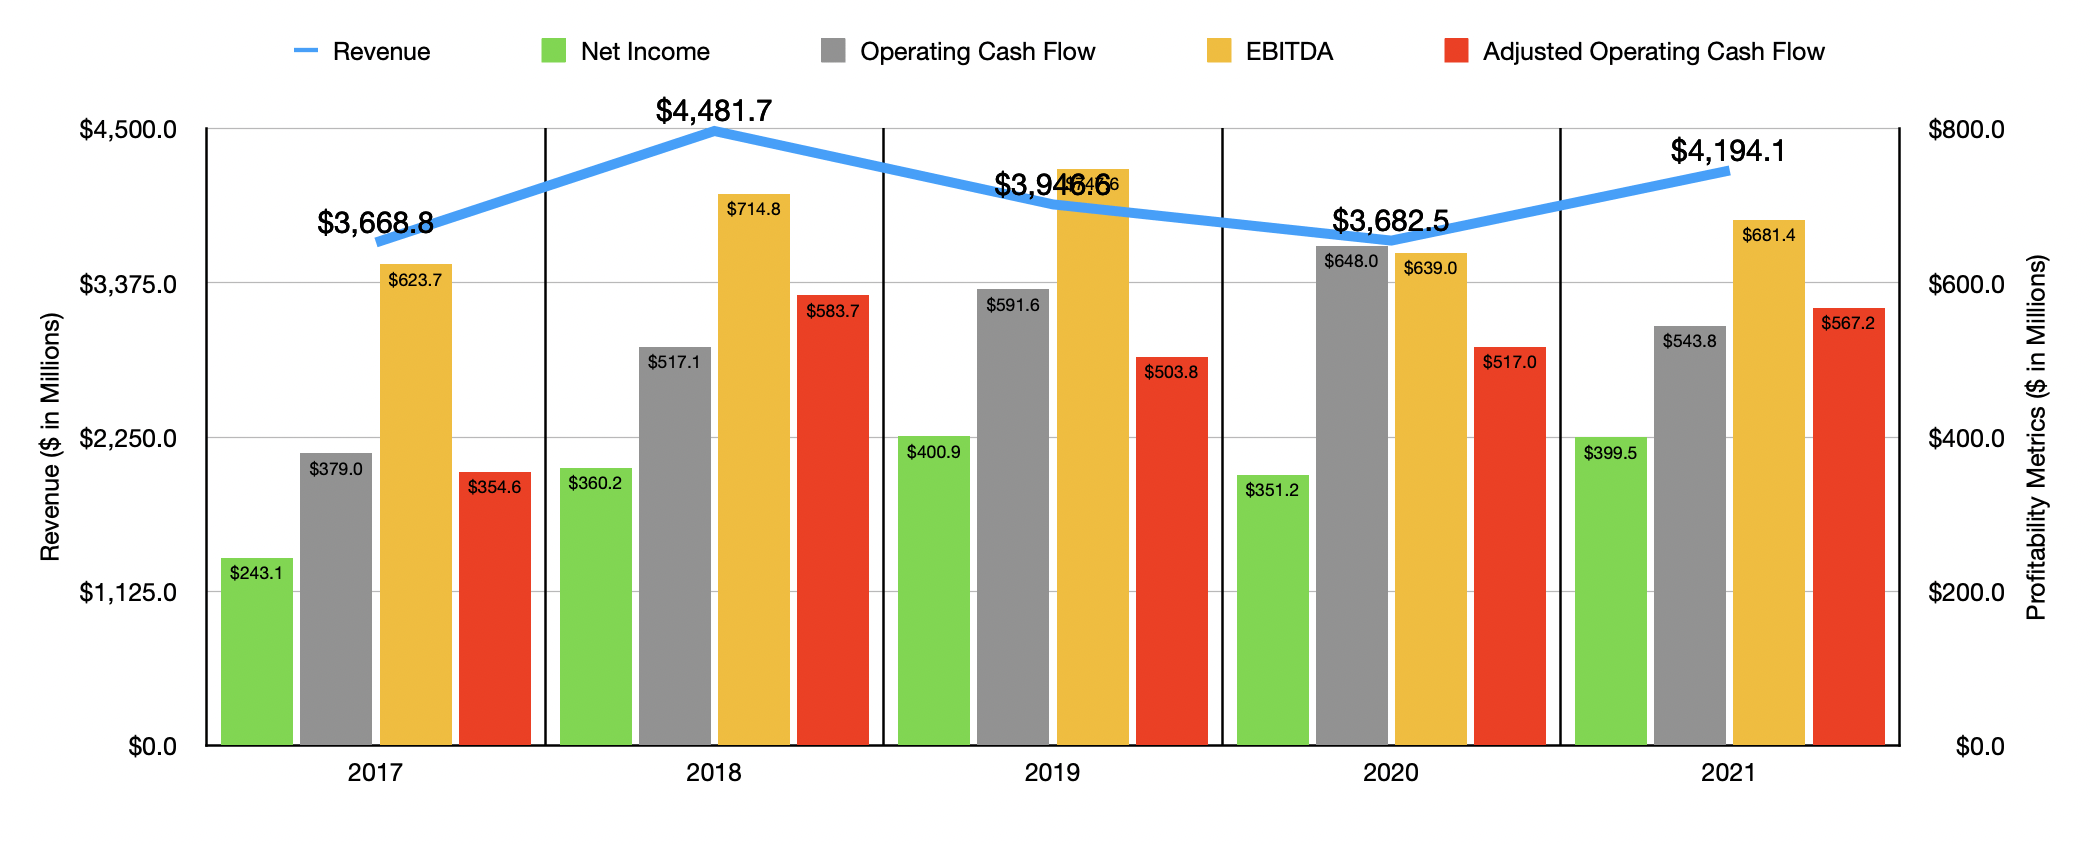
From 2017 to 2018, the company’s revenue expanded nicely, jumping from $3.67 billion to $4.48 billion. But from then through 2020, revenue slid materially, bottoming out at $3.68 billion in total. But in 2021, sales rebounded, hitting $4.19 billion in total. This works out to a 13.9% increase, with organic net sales rising by 9.7% thanks to favorable price increases and higher unit volume. Acquisitions added another 3.9% to sales while foreign currency fluctuations contributed 0.5%.
On the bottom line, the picture for the company has been fairly stable. From 2017 through 2019, net profits rose nicely from $243.1 million to $400.9 million. In both 2020 and 2021, there was no clear trend for the business. The end of the 2021 fiscal year resulted in net income of $399.5 million. Over the same five-year window, operating cash flow rose most years, growing from $379 million to $648 million before dropping in 2021 to $543.8 million. If we adjust for changes in working capital, the trend line for the company is a bit smoother. After falling from $583.7 million in 2018 to $503.8 million in 2019, the metric began rising consistently, ultimately hitting $567.2 million in 2021. A similar trajectory can be seen when looking at EBITDA. The only difference is that it peaked at $747.6 million in 2019. Though after a bit of pain in 2020, the metric did show some improvement in 2021, with EBITDA for that year totaling $681.4 million.
Author – SEC EDGAR Data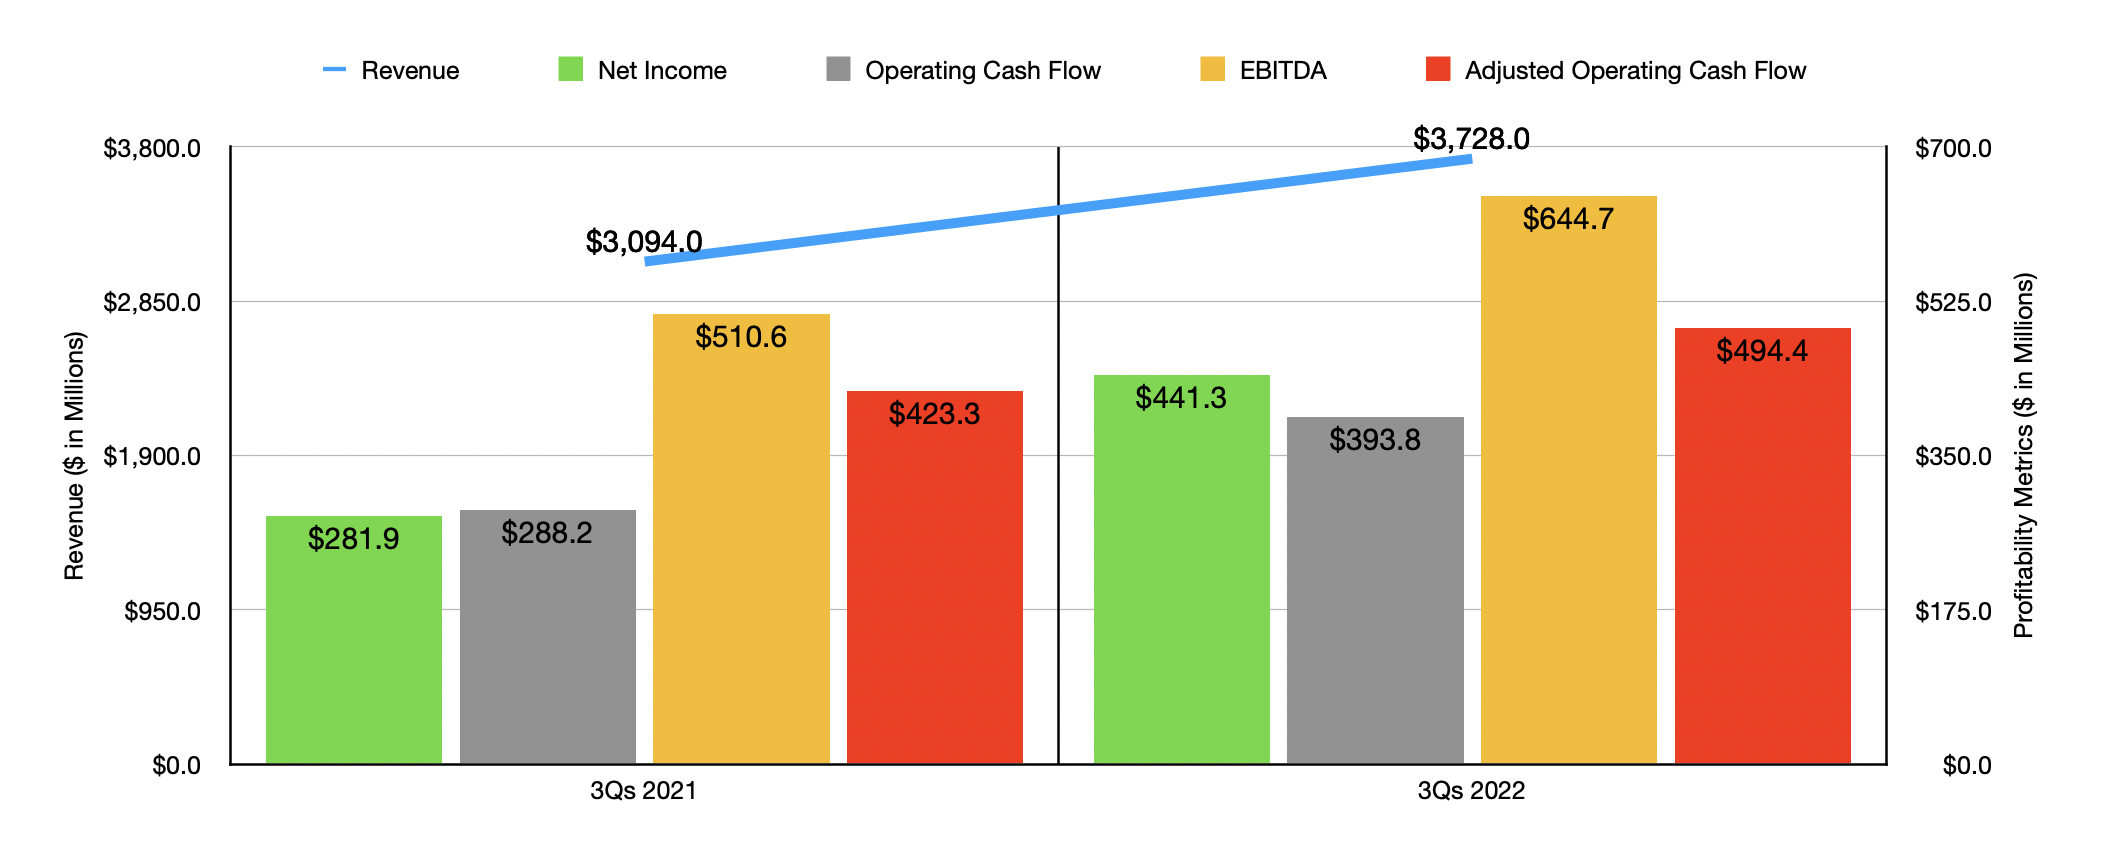
When it comes to the 2022 fiscal year, the picture for the company looks significantly better than I would have anticipated. Revenue in the first nine months of 2022 of $3.73 billion beat out the $3.09 billion reported the same time one year earlier. This surge of 20.5% was driven largely by a 20.3% rise in organic net revenue. However, the company did also benefit from a $20.5 million contribution thanks to acquisitions that it had engaged in. With the rise in sales also came higher profits. Net income of $441.3 million dwarfed the $281.9 million in profits experienced one year earlier. Operating cash flow jumped from $288.2 million to $393.8 million, while the adjusted figure expanded from $423.3 million to $494.4 million. And over that same window of time, EBITDA expanded from $510.6 million to $644.7 million.
When it comes to 2022 in its entirety, management expects sales growth to be between 18% and 19%, with organic growth contributing 17% to 18% upside. Adjusted earnings per share, meanwhile, should be between $10.25 and $10.45. At the midpoint, that would translate to net income of $558.9 million. If we annualize results experienced so far for the year, we should end up with operating cash flow, on an adjusted basis, of $662.5 million, as well as EBITDA totaling $860.4 million.
Author – SEC EDGAR Data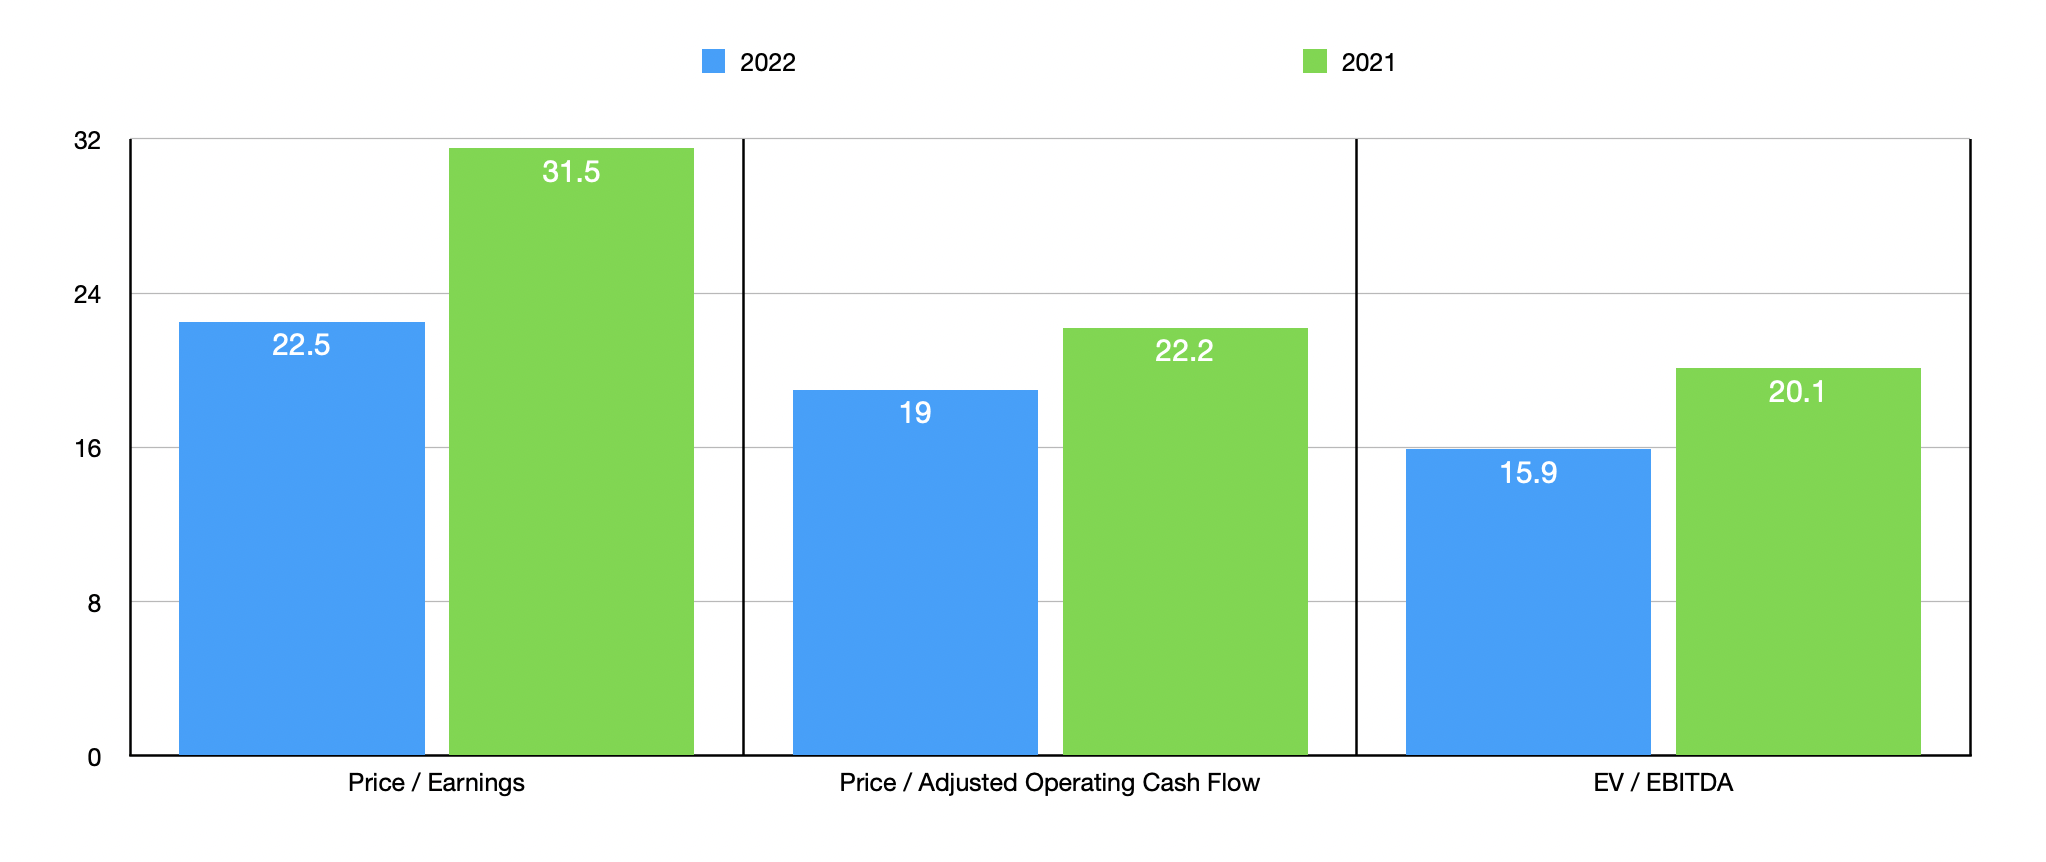
Taking the aforementioned data, we can easily value the firm. On a forward basis, the firm is trading at a price-to-earnings multiple of 22.5. The price to adjusted operating cash flow multiple is 19, while the EV to EBITDA multiple is 15.9. Although lofty, this pricing is better than what we get if we use data from the 2021 fiscal year as pictured in the chart above. I compared its pricing against five similar businesses. On a price-to-earnings basis, these companies ranged from a low of 17.1 to a high of 33.9. Two of the five prospects were cheaper than Hubbell. Using the price to operating cash flow approach, the four companies with positive results had multiples ranging from 18 to 378.5. Only one of the five firms was cheaper than our target. And finally, using the EV to EBITDA approach, the range was from 10.8 to 20.5. In this scenario, four of the five companies were cheaper than Hubbell.
| Company | Price / Earnings | Price / Operating Cash Flow | EV / EBITDA |
| Hubbell Incorporated | 22.5 | 19.0 | 15.9 |
| Powell Industries (POWL) | 33.9 | N/A | 20.5 |
| Regal Rexnord Corporation (RRX) | 24.1 | 27.4 | 12.2 |
| Generac Holdings (GNRC) | 17.1 | 378.5 | 10.8 |
| Sensata Technologies (ST) | 23.0 | 18.0 | 11.4 |
| nVent Electric (NVT) | 21.8 | 21.3 | 14.5 |
Takeaway
Historically speaking, Hubbell has experienced something of a bumpy ride. Although this is the case, it’s understandable when you consider the difficult economic conditions the company had to contend with. What’s most important now is that the firm has returned to growth and is doing quite well for itself. Shares are not exactly expensive, but they aren’t cheap either. And when you add in that current economic conditions might worsen from here, I believe that the most appropriate rating for the company is a ‘hold’ for now.
Be the first to comment